XAUUSD trading plan for the London market.After buying at a low level yesterday, the market rebounded and continued to fall. Today, the Asian market hit a low of 3208.
At present, geopolitical uncertainties are increasing. I think buying is still a reasonable choice. Buy near 3210-3200. The target is 3235-3248. It is necessary to observe whether the target is stabilized.
Remember to control trading risks when trading independently.
Xauusdidea

XAUUSD buying opportunitiesToday, I am adapting to low buy operation again. Yesterday, the lowest price in New York market reached 3278, and today the lowest price in Asian market hit the low near 3245. But with the addition of buy orders, the profit has expanded a lot again.
XAUUSD market quotation is 3298. This position can still be arranged for buying. Do not trade independently. Remember to leave me a message. Pay attention to the subsequent precise trading opportunities.

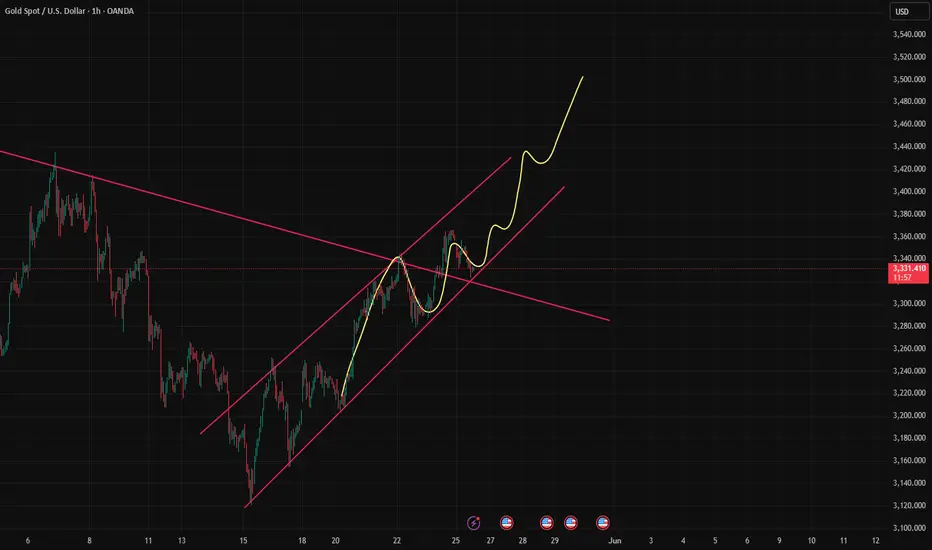
Elliott Wave Analysis – XAUUSD H1 Timeframe 29/05/2025
🔍 Current Wave Structure
Price is currently correcting within a WXY structure, also known as a double zigzag. At the moment, the market is progressing through wave Y, with two potential targets:
🎯 Target 1: 3245 – already reached, and price has bounced sharply from this zone.
🎯 Target 2: 3215 – a deeper target, requiring further confirmation from price action and real-time momentum.
📈 If wave Y has already ended at 3245, the market may now be in wave 1 of a new bullish cycle. Once wave 1 completes, we’ll look for wave 2, which typically offers a prime entry point for wave 3.
👉 Wave 2 often forms as a zigzag or flat correction. Using Fibonacci confluence and liquidity zones, the potential wave 2 pullback area is 3265 – 3262.
⚡️ Momentum Outlook
🕯 D1: Momentum is entering oversold territory → high probability of bullish reversal today or tomorrow.
🕯 H4: Reversal setup is forming; current H4 candle closes in just over an hour → watch for confirmation.
🕯 H1: Momentum is rising. Wait for a pullback in H1, followed by renewed bullish momentum without breaking below 3245 — that’s likely the end of wave 2 and the entry point for wave 3.
📌 Important Note:
If H4 momentum reverses downward and price fails to break above 3324, it could signal a continuation of the broader downtrend, with 3215 remaining as the next wave Y target.
🛒 Trade Setup
BUY ZONE: 3265 – 3262
Stop Loss: 3255
Take Profits:
• TP1: 3290
• TP2: 3324
• TP3: 3346
❗️ If price breaks below 3245, it would confirm that wave Y is still in progress. In that case, monitor the 3215 zone for a new buying opportunity.

XAUUSD Analysis todayHello traders, this is a complete multiple timeframe analysis of this pair. We see could find significant trading opportunities as per analysis upon price action confirmation we may take this trade. Smash the like button if you find value in this analysis and drop a comment if you have any questions or let me know which pair to cover in my next analysis.

GOLD H1 Intraday Chart Update For 29 May 2025As you can see that there are some strong zones mentioned in chart
Intraday Trend remains down because market sustains below 3300 Psychological level
once market will break 3300 psychological level successfully then move towards 3335
Scalping Range is 3250-3280
if Market breaks 3250 level it will move towards 3200
Disclaimer: Forex is Risky

XAUUSD Idea: Structure, Fibonacci Setup & S&P 500 Correlation📉 XAUUSD Trade Outlook 🧠🔍
Currently analyzing Gold (XAUUSD), and things are getting interesting. On the daily timeframe, we’ve seen a clear bearish break of market structure, and this shift is also evident on the 4-hour chart. 🕰️📉
I’m watching closely for a bullish retracement into my key Fibonacci 61.8% level, where I’ll be looking for confirmation of a bearish structural break to initiate a short position. 🎯🔽
When we compare this setup to the US500 (S&P 500), it becomes even more compelling. The indices have rallied hard and appear overextended — a correction seems likely. 📊🧾
If we do get that pullback in the indices, gold may rally temporarily, but my overall bias remains bearish. If the indices resume their uptrend after a pullback, I expect gold to weaken further, aligning with my current short-side outlook. ⚠️📉
🛑 This is not financial advice. Always do your own analysis and manage risk according to your trading plan.
💬 What are your thoughts on gold right now? Are you leaning bullish or bearish? Let me know in the comments! 👇

Golden Jedi counterattack! Key support ignites the bull engine📌 Gold Technical Analysis & Operation Strategy Update
Gold bottomed out and rebounded as expected, and the trend basically met recent expectations - oscillating upward around the support range below.
💡 Key Point Review
Today, gold opened at around 3300, with a minimum of 3291, and then rebounded, reaching a maximum of 3325. The overall trend still fluctuates within the range, with strong support below and obvious suppression above, and the overall performance is a narrow range of fluctuations.
📉 4-hour chart analysis
Support focus: 3285-3295 area
Pressure focus: 3330-3340 area
Short-term long-short watershed: 3275-3283 line
🔎 Before effectively falling below the watershed, it is still mainly seen as range fluctuations, and the high-altitude low-multiple strategy continues to be implemented.
📈 Operation strategy suggestions
1️⃣ Try to go long with a light position if the price falls back to 3295-3300
2️⃣ If the price falls back to 3280-3285, you can add to your position appropriately
🎯 Target focus: 3316-3320, and look to 3330-3340 after breaking through
⚠️ Risk control suggestions: strictly set stop loss, control position, and prevent the risk of range breakout.

Geopolitics Fail to Lift Gold as Dollar Regains MomentumOANDA:XAUUSD TVC:GOLD Gold trades near $3,300, respecting TL1 trendline resistance. A break below the $3,289 level may trigger a deeper pullback toward the key $3,247 support zone. On the flip side, reclaiming $3,315 could open the path toward $3,342 resistance.
On the news front, despite escalating Russia–Ukraine tensions and a record drone strike from Moscow, gold failed to gain. Risk sentiment improved after President Trump postponed the 50% EU tariff deadline, lifting both the U.S. dollar and Treasury yields. U.S. consumer confidence also surprised to the upside at 98.0 in May, dampening safe-haven demand.
Markets now await the Fed’s May Meeting Minutes, which may reinforce the cautious hawkish stance. This poses near-term downside risk to gold if policy flexibility remains limited.
Resistance : $3,315 , $3,342
Support : $3,289 , $3,247

GOLD M30 Intraday Chart Update for 28 may 2025Hello Guys, as you can see that GOLD intraday chart just shared with levels
you may do some scalping in the ranging zone, however today strong zone is 3265-3280 which also buying zone but must check confirmation before enter
as well as once market will break SBL level then you may also look long position
Remember always trade with SL
Disclaimer: Forex is Risky

3278-3320 key position is mainly high sell low buyAt present, gold rebounded after falling back to 3287, and fluctuated around 3300 in the short term. Pay attention to the support area of 3278-3283 below. If it does not break this area, you can still try to go long in the short term. After all, from a technical point of view, the decline during the day is a correction and adjustment to the previous rise.
From the 4-hour chart, the upper short-term focus is on the suppression of the 3316-3320 area, and the lower focus is on the support of 3278-3283. In terms of operation ideas, continue to maintain the interval strategy of "high-altitude and low-multiple", rely on key positions to sell high and buy low, and wait patiently for effective signals before entering the market. If the structure or rhythm of the market changes, the strategy will be adjusted in time and notified separately.

XAUUSD:Long trading ideas
On the whole, the easing of the trade end further reduces risk aversion, and the geopolitical situation supports the normalization. It is expected that gold will maintain a volatile pattern in the short term, and bullish in the medium and long term.
Below the strong support near 3288, back to step into the market can be more than a single rebound. (Those who hold long orders can add long positions at this position), the upper short target is 3320-25, then 3360.
So the trading strategy :BUY@3288-94 TP@3320-25
↓↓↓ More detailed strategies and trading will be notified here →→→
↓↓↓ Keep updated, come to "get" →→→

GOLD Will Keep Falling!
HI,Traders !
GOLD is going down
Now and the pair broke
The rising support line
Made and is going
Down again now so we are
Bearish biased and we will
Be expecting a further
Bearish move down !
Comment and subscribe to help us grow !

5/27 Gold Analysis and Trading SignalsGood afternoon everyone!
Yesterday, gold fluctuated within the flexible trading zone, and we only executed a long entry near 3323, which brought decent profit.
Today, gold opened with an upward move toward 3350, but quickly pulled back. The recent market shows a sideways consolidation, with the $3340 level acting as a key pivot zone:
Below 3340: dense support areas
Above 3340: resistance clusters
In this context, any breakout without strong momentum can easily lead to capital flow shifts, causing false breakouts or rapid pullbacks, making trend continuation more difficult.
📉 Technical View:
On the 30M chart, bearish momentum slightly outweighs bullish, and gold is likely to remain range-bound within the zone defined yesterday.
🗞 Fundamental Reminder:
There are a few important U.S. economic releases during the NY session. Watch closely to see if they provide a clear directional push.
📈 Today’s Trading Plan:
📉 Sell in the 3366–3386 zone (resistance area)
📈 Buy in the 3278–3256 zone (support zone)
🔁 Flexible intraday levels to monitor:
3353 / 3341 / 3334 / 3317 / 3309 / 3296 / 3284
Trade with flexibility, beware of fake breakouts, and focus on NY session data-driven opportunities. Let me know if you have questions — good luck and happy trading!

Short term is still dominated by short positions!Although the easing of trade tensions in the short term has led to a correction in gold prices, the three core factors supporting the strength of gold still exist: expectations of loose global monetary policy, rising geopolitical risks, and the long-term weakening trend of the US dollar. In particular, the market expectation that the Federal Reserve may maintain loose monetary policy will continue to provide momentum for gold to rise.
From the daily chart, the price of gold has shown a clear upward trend since this year. Although there have been several corrections in the middle, the bulls still control the medium and long-term market. After the previous rise in the H4 cycle, it is not so strong now. Instead, it is a volatile trend. The Bollinger band is closed, and the trend strength still needs market stimulation to rise again.
The 1-hour moving average of gold has begun to turn, so the rising strength of gold bulls has been suppressed. The high point of the 1-hour rebound of gold has been getting lower and lower, and the low point has also begun to fall. The 1-hour gold has begun to fluctuate downward. The downward trend of the gold rebound is suppressed near 3340. Gold rebounds near 3340 and can still be shorted.

XAUUSD Hello Traders. This is my analysis for XAUUSD. I am not a professional and I would be happy if you share your opinion in the comments.

XAUUSD:Go long at 3320-3325
Gold rebounded after stepping back near 3200 last week, picking up and rising under the influence of the news. Since 3200 stepping back formed support, coupled with the influence of long news, the day is mainly long.
The 4-hour chart shows the lower rail support at 3320-3325 and the upper rail pressure at 3360-65. You can trade around this range.
So the trading strategy: Buy@3320-3325 TP@3360-3365
↓↓↓ More detailed strategies and trading will be notified here →→→
↓↓↓ Keep updated, come to "get" →→→

5/26 Gold Trading SignalsGood afternoon everyone!
I just returned from a weekend trip and apologize for the late update today — thank you all for your patience and continued support!
Gold has shown mild downward movement in a one-sided consolidation pattern today. This is a technical pullback after reaching a key resistance zone, reflecting selling pressure at higher levels. Today is Memorial Day in the U.S., which explains the low volatility and reduced trading volume.
🔎 Technical Outlook:
Once gold reached around 3360, it entered a significant resistance zone. If bulls intend to maintain the current uptrend, then the support around 3272 will be a critical level during this pullback. Before that, we should also keep an eye on 3322, 3318, and 3298.
On the 2-hour chart, a bearish divergence has formed, which needs to be resolved, possibly through sideways consolidation or a further pullback.
🗞 Fundamental Outlook:
The news is relatively quiet today, but important economic data and speeches will begin tomorrow, which may trigger larger market moves.
📈 Today’s Trading Plan:
📉 Sell in the 3352–3368 zone (resistance area)
📈 Buy in the 3292–3272 zone (support zone)
🔁 Flexible intraday levels to watch:
3348 / 3332 / 3323 / 3312 / 3305 / 3296
Stay flexible and manage risk accordingly. If you have any questions or want to discuss your trading strategy, feel free to reach out. Wishing everyone a smooth and profitable session!

Here is the trend of gold prices in the next three weeks!The hourly level trend indicates that the current support position is 3310-3320. And it is the retracement position after the downward trend is broken. It is also a small retracement point after the rebound.
At present, the news trend is basically mixed, offsetting each other. However, in the following period, the growth of risk aversion will boost the rise of XAUUSD, and geopolitics is also an important influencing factor.
Short-term buying opportunities are considered at 3325-3300. The short-term target focuses on the pressure of 3375-3400.
Remember the core of swing trading. Follow the wave of trading. Do not trade independently to avoid losses. If you are not sure about the trading opportunity. Remember to leave me a message in the swing trading center.
Gold Eyes Breakout or Breakdown: All Eyes on PCE and FOMCTVC:GOLD OANDA:XAUUSD Gold (XAU/USD) surged above $3,350 last week, boosted by safe-haven flows following Moody’s downgrade of the U.S. credit rating and rising geopolitical tensions. Concerns over U.S. debt sustainability, weak dollar sentiment, and renewed trade risks kept investor demand for gold elevated.
Technically, gold is currently trading within an ascending channel. Price is now hovering near a key resistance zone around $3,364, while the $3,324 breakout level below may act as pivotal support. A pullback below this level could expose downside risk toward the lower channel boundary. Meanwhile, a sustained break above resistance may invite further bullish momentum toward $3,400.
This week, attention turns to key U.S. data including FOMC minutes, Q1 GDP, and the Fed’s preferred inflation gauge — core PCE. Any upside surprise in inflation may weigh on gold, while geopolitical headlines and fiscal uncertainty are likely to continue supporting the upside.
Resistance : $3,364 , $3,400
Support : $3,324 , $3,315

#XAUUSD: +2000 Pips Correction US-China Trade Deal ConfirmedGold has experienced a significant decline in recent days, primarily due to fundamental market factors that have caused its price to fall from 3430 to 3209, resulting in a loss of approximately 2210 pips. Consequently, we recommend that you consider selling Gold if it aligns with your analysis and assessment. It is imperative that you implement strict risk management measures while trading Gold.
It is important to note that this analysis does not guarantee a price decline or that the market will behave as described. Therefore, we strongly advise you to conduct thorough trade planning before making any trading decisions.
We extend our sincere gratitude for your unwavering support over the years.
Our primary objective is to assist you in making well-informed decisions. Therefore, we encourage you to contact us if you have any inquiries or require further information.
Additionally, we would be delighted to receive your insights on which cryptocurrency pair you would like to explore next. Please do not hesitate to share your preferences.
Best regards,
Team Setupsfx_

XAUUSD[GOLD]: Another Possible Swing Sell Happening! Swing MoveGold rejected twice as we had described in our last two analyses on Gold. We remain heavily bearish on Gold and expect a swift bearish move within the next week or following week. We are eyeing two targets. Please use this analysis accordingly and avoid overtrading. This is not a confirmation, and do not use the marked arrow as an entry or exit point. The marked red area drawn there represents a potential reversal zone from which price may reverse.
As always, this analysis does not guarantee that price will move as described in the chart. Please use your own knowledge and trading plan while trading Gold. Good luck and trade safely.
Want to support us? Do the following ❤️
-LIKE THE IDEA
-COMMENT YOUR VIEW
-SHARE IF YOU AGREE
Much love ❤️
Team Setupsfx_

XAUUSD[GOLD]: Bearish Correction Is Happening! Gold rejected at 3350, dropping almost 600 pips to 3290. We can expect the price to drop further to around 3250, potentially reversing from there. A possible entry point is 3304, followed by a drop from there.
If you’d like to contribute, here are a few ways you can assist us:
- Like our ideas
- Comment on our ideas
- Share our ideas
Team Setupsfx_🚀❤️

XAUUSD Analysis todayHello traders, this is a complete multiple timeframe analysis of this pair. We see could find significant trading opportunities as per analysis upon price action confirmation we may take this trade. Smash the like button if you find value in this analysis and drop a comment if you have any questions or let me know which pair to cover in my next analysis.
