7/25: Key Levels to Watch Closely for Next Week's TradingGood evening, everyone!
Due to health reasons, I had to take a short break from updates — thank you all for your understanding and support.
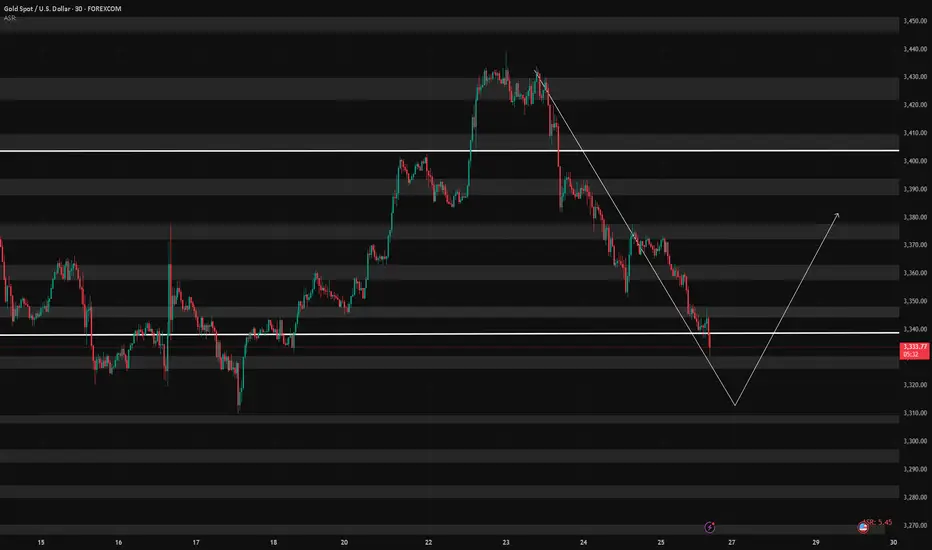
This week, gold rallied to the 3440 level, forming a double-top pattern, and has since entered a phase of consolidation with a downward bias, currently retracing back to the key 3337-332 support area.
While a short-term rebound is possible from the 30-minute chart perspective, the weekly structure is not favorable to the bulls. On the daily chart, price has once again reached the MA60 support, and is currently forming three consecutive bearish candles, which suggests that bearish momentum may continue.
Unless there is significant bullish news next week, the market may remain under pressure. Key levels to monitor:
Upside resistance zones: 3343, 3352, 3358, 3366, 3372, 3378, and 3386–3392
Downside support zones: 3337, 3332, 3323, 3312
If the weekly chart breaks down, watch for: 3300 psychological level and 3260 (weekly MA20)
Additionally, during this week's decline, a price gap has been left between 3395–3398. If the market starts to rebound on the 2-hour chart, there is a chance this gap will be filled. However, this area also serves as strong resistance, and any approach toward it could result in heavy selling pressure. Caution is advised in the event of a sharp rally.
I'm still recovering and unable to monitor the markets for extended periods. Once my health improves, I’ll resume regular updates. In the meantime, feel free to leave any questions, and I’ll do my best to respond. Thanks again for your continued support, and I wish everyone success and strong profits in the market!
Xauusdidea
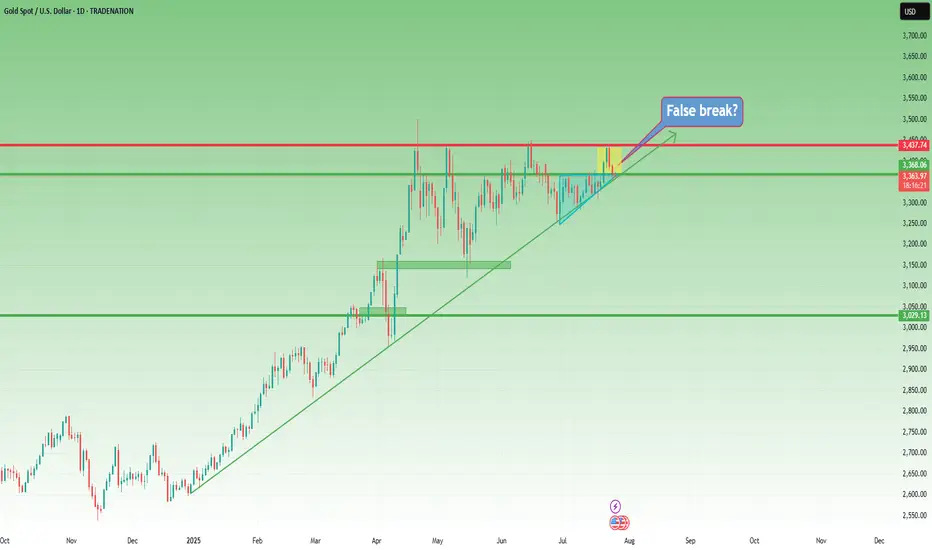
XAUUSD – The Structure Is Still Bullish... But Barely Holding 📌 In yesterday’s analysis, I mentioned that although Gold corrected deeper than expected, dropping below 3400, the bullish structure remained intact — and I stayed true to that view by buying dips.
🎯 The trade didn’t go as planned. Fortunately, the New York rebound from 3350 helped me exit at breakeven.
🧭 So now the big question is:
Is Gold reversing to the downside?
The answer: Not confirmed yet.
The structure is technically still bullish, but the chart is far from pretty.
🧨 What’s going wrong?
❌ Bearish engulfing candle on Wednesday – I chose to ignore it yesterday, but it’s still there.
❌ The breakout above 3375 (ascending triangle resistance) is failing – and could now turn into a false breakout trap.
❌ The ascending trendline from January 2025 is under pressure.
❌ And if today we close near 3350, the weekly chart will show a bearish Pin Bar – not exactly a sign of strength.
📉 My current plan:
- If price rallies back above 3380 → I’m looking to sell into strength, not buy.
- If we break below 3350 → I’ll also look to sell the breakdown.
Right now, for Gold to regain bullish momentum, it needs to reclaim 3400. No compromise.
⚠️ Summary:
Yes, the bigger structure is still bullish.
But momentum is fading, and price action is starting to turn against the bulls.
We need confirmation, not hope.
If 3350 breaks cleanly – things could accelerate to the downside.
Disclosure: I am part of TradeNation's Influencer program and receive a monthly fee for using their TradingView charts in my analyses and educational articles.
Trend corrected, long funds reduced, sellers returned#XAUUSD
The current moving average is still spreading downward, and the 4-hour chart closed with a large negative line. The market has not yet given a clear feedback on the current trend. However, after a large amount of buying funds intervened, the gold price hit a high of around 3377 and then stagnated. The short-term bullish momentum has weakened, and there is a certain risk of a correction and decline. Sellers are beginning to return📉.
Currently, you can consider participating in short selling at 3370-3377💡. If it rebounds directly to 3400-3405, you can still short if it does not break🔍. The target is 3360 below, and 3350 or even 3330 if it breaks🎯.
🚀 SELL 3370-3377
🚀 TP 3360-3350
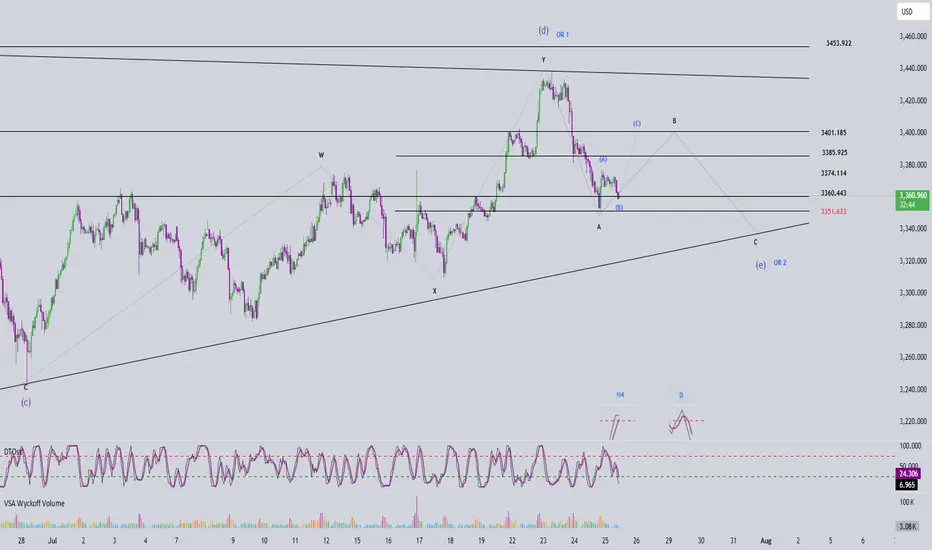
Elliott Wave Analysis – XAUUSD July 25, 2025📊
________________________________________
🔍 Momentum Analysis
• D1 Timeframe: Momentum is declining. Based on the current pace, it’s likely that only 1–2 more daily candles are needed before momentum enters the oversold zone → suggesting one more potential downward leg.
• H4 Timeframe: Momentum is about to turn bearish, indicating we might see a sideways movement or a slight drop in the short term.
• H1 Timeframe: Momentum is currently falling. By the end of the current H1 candle, momentum will likely enter the oversold zone → potential for a bullish reversal soon.
________________________________________
🌀 Elliott Wave Structure
• A clear 5-wave Wave A has already formed with no irregular patterns, so I’m expecting Wave B (black) to unfold as a 3-wave structure.
• Within this black Wave B, price is now developing Wave B (blue), meaning Wave A (blue) has already completed. Looking at the lower timeframe, I can identify a 5-wave structure → suggesting a zigzag correction in the form of 5-3-5 for black Wave B.
• Target for Wave B (blue): The 3360 area – this is a support level and also aligns with Fibonacci confluence, making it a strong candidate for the end of Wave B (blue) and a potential reversal zone.
• If price respects the 3360 level, then projected targets for Wave C (blue) would be around 3386 or 3402.
• However, if price breaks below 3351, the current wave count becomes invalid. In that case, we will shift to an alternate scenario and look for a buy opportunity near the lower edge of the triangle (c)-(e) and other confluence support zones.
________________________________________
🔄 Combining Momentum & Wave Structure
• D1 momentum shows weakening in this downward move, and the lower boundary of the triangle (c)-(e) is a prime area to look for the end of Wave e.
• Ideally, we want to see:
o A short-term bounce upward aligning with H1 momentum reversal to complete Wave C (blue).
o Then a confluence with H4 momentum turning bearish, indicating possible trend continuation or reversal.
________________________________________
📌 Trade Plan
• For experienced traders:
Watch closely around 3385 and 3401 for reversal signals to enter Sell positions.
• For beginners, I recommend the following limit setup:
o SELL ZONE: 3399 – 3402
o SL: 3501
o TP1: 3374
o TP2: 3351
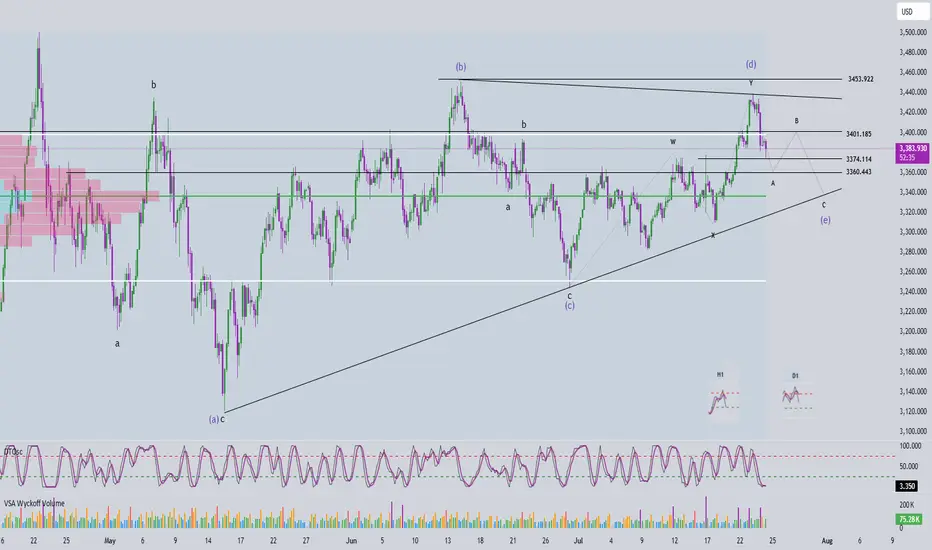
Elliott Wave Analysis – XAUUSD July 24, 2025📊
________________________________________
🔍 Momentum Analysis:
• D1 Timeframe: Momentum is currently in a downtrend, indicating that the dominant trend in the short term (at least until early next week) is likely to remain bearish or sideways.
• H4 Timeframe: Momentum has entered the oversold zone and is showing signs of a potential bullish reversal. This suggests that a corrective upward move may occur today.
• H1 Timeframe: Momentum is still declining and is expected to need around two more H1 candles before entering the oversold zone, implying that one more leg down may occur before a recovery begins.
________________________________________
🌀 Elliott Wave Structure Update:
Yesterday’s expectation of a breakout above the resistance zone at 3453 to confirm the start of a new bullish trend did not materialize. Instead, price dropped to the 3374 region, opening up two primary scenarios:
✅ Scenario 1: The correction is still unfolding
• Wave (d) in blue appears to be complete.
• The current leg is likely wave (e), the final leg in a contracting triangle correction.
• In this case, the lower boundary of the triangle and overlapping support zones will serve as key levels to watch for the completion of wave (e).
✅ Scenario 2: Wave 1 of a new bullish trend has completed
• The current decline is wave 2 in a new bullish impulsive sequence.
• The objective here is to identify the bottom of wave 2 to prepare for a potential buy entry into wave 3, which is expected to be stronger and longer than wave 1.
📌 Key difference between the two scenarios:
• Scenario 1 → Wave (e) completes, followed by wave 1 of wave 5.
• Scenario 2 → Wave 2 completes, followed by a powerful wave 3 of wave 5.
________________________________________
🧩 Current Wave Structure:
• A five-wave bearish structure is currently unfolding on the chart.
• According to Elliott Wave Theory, corrective patterns do not typically form five-wave structures.
• Therefore, this is likely wave A in a zigzag (5-3-5) formation.
• Possible targets for wave 5 within wave A:
o Target 1: 3374 – current reaction zone.
o Target 2: 3360 – next significant support level.
________________________________________
📌 Combining Wave Structure with Momentum:
The D1 momentum is firmly bearish, reinforcing the view that the market is undergoing a larger ABC correction.
On the H4 timeframe, momentum is oversold and showing early signs of reversal, aligning with the potential formation of wave B — typically a weak, sideways upward move. The likely resistance zone for the end of wave B lies between 3401 and 3410.
Meanwhile, H1 momentum is still falling and not yet in the oversold zone, suggesting there may be one more move down to complete wave 5. The ideal target for this final leg is around 3360.
Summary:
• D1 bearish → confirms ongoing major correction.
• H4 oversold → supports a potential weak wave B.
• H1 still declining → wave 5 may complete around 3360 before a recovery begins.
________________________________________
💼 Suggested Trading Plan:
For traders with limited experience or those not yet confident in reading live market signals, a Buy Limit strategy at clear support levels is recommended:
• Buy Zone: 3362 – 3360
• Stop Loss: 3352
• Take Profit:
o TP1: 3384
o TP2: 3400
🎯 For experienced traders, it is advised to observe price action at the target support zones and look for real-time reversal signals to optimize entry timing.
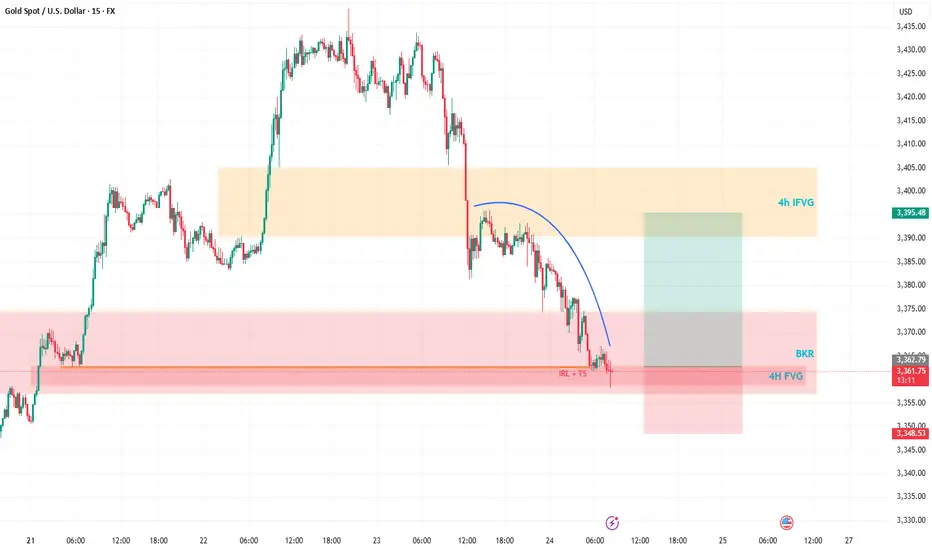
Gold’s Wild Ride: A Trader’s Take on What’s NextHey Fellow Traders! 👋
Gold’s been an absolute beast this week, smashing through both buyers and sellers like it’s playing a high-stakes game of market whack-a-mole! 😅 After Wednesday’s wild moves and today’s follow-up, Gold’s keeping us all guessing.
Right now, I’m not locking in a long-term bias—Gold’s too unpredictable for that. But here’s the exciting part: I’m eyeing a short-term long opportunity. Why? The price just dipped into a 4H Fair Value Gap (FVG) and tagged a Breaker, setting up a potential bounce. 📈
My plan? I’m expecting Gold to sweep up the highlighted liquidity and charge toward the 4H Inversion Fair Value Gap (IFVG). Once it hits that zone, I’ll be glued to the charts, watching for its reaction to decide the next move. 🧐
As always, trade smart! Set your stops, size your positions wisely, and don’t let Gold’s volatility catch you off guard. Protect your capital first—always! 💡
What’s your take on Gold right now? Are you jumping on this setup or waiting for more confirmation? Drop your thoughts in the comments below, give this post a like, and follow for more updates! 👇 Let’s keep the trading convo going! 🔥
#GOLD Will Keep Growing!
HI,Traders !
#GOLD keep trading in An uptrend
along the rising support So as the gold
is approaching A the support we will be
Expecting a bullish rebound !
Comment and subscribe to help us grow !

XAUUSD Top-down analysis Hello traders, this is a complete multiple timeframe analysis of this pair. We see could find significant trading opportunities as per analysis upon price action confirmation we may take this trade. Smash the like button if you find value in this analysis and drop a comment if you have any questions or let me know which pair to cover in my next analysis.

Correction is not bearish, buy on rebound at low levelToday is critical. Yesterday, gold fell under the pressure of 3396. The next 3396 area is very critical, and it will be relatively weak below it. If it goes up, the market rebound will expand. Pay attention to 3405 or 3420 area, with the focus on 3420. As long as it is below here, it will be mainly bearish. Breaking through 3420, the market is expected to continue to rise and break yesterday's high to test the 3450 area, and then seek to fall again. On the downside, pay proper attention to the 3380 area, which is short-term support; the focus is on the 3370~3365 area, which is the next bull-bear watershed.
The daily line fell yesterday and included the previous day's big positive rise, which represents the current high-level fluctuation of the price. At present, we need to pay attention to the lower moving average support corresponding to SMA10 at 3367, while the moving average SMA30 is around 3351-53, the middle track is at 3344, and the moving average SMA60 is at 3330.
From the daily level: today's decline will not fall below 3351-53, and it is likely to be around 3367-70. We have the opportunity to participate in long orders near 3370.
Therefore, if the price touches 3370-3365 for the first time during the day, you can consider going long, with the target at 3390-3400; if the downward trend of gold continues during the day, you can go long again at 3355-3353, defend 3345, and exit the market after earning a difference of $10-20.
OANDA:XAUUSD
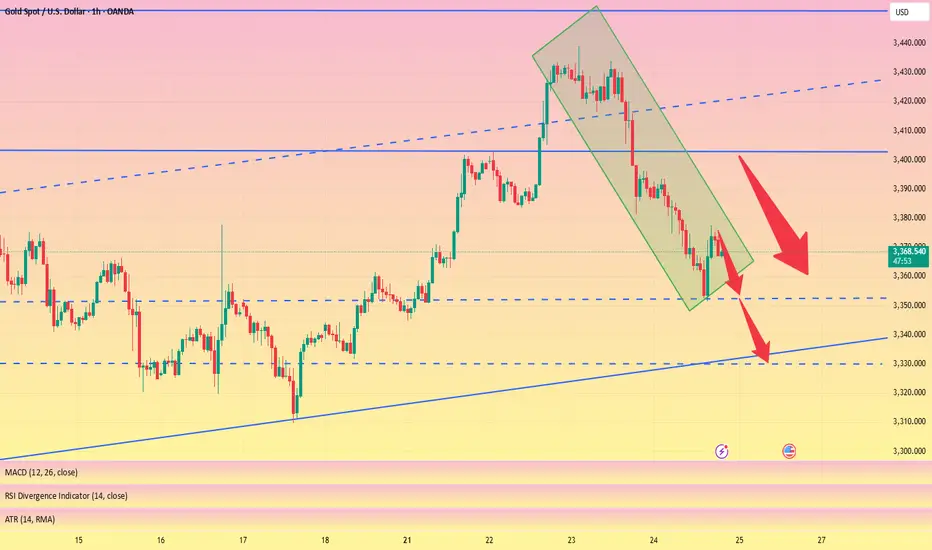
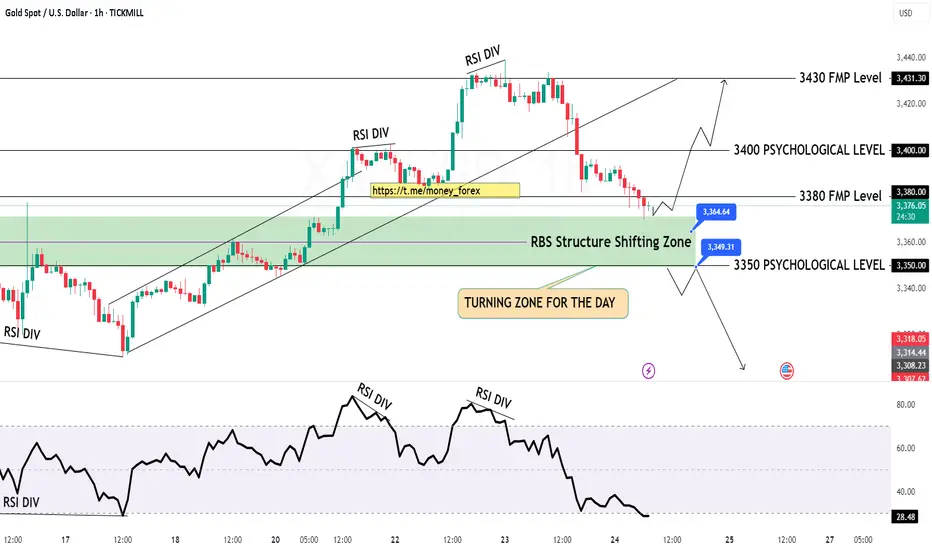
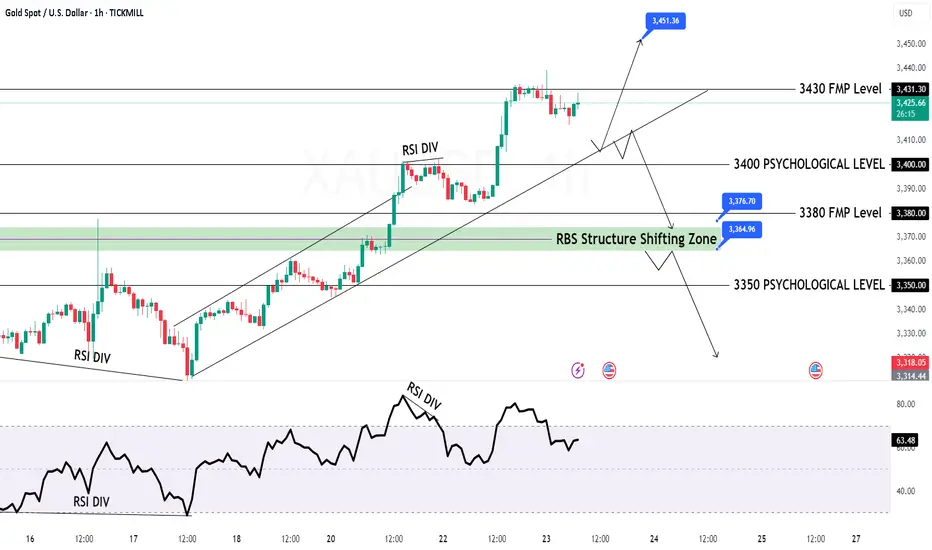
GOLD H1 Chart Update for 24 July 2025Hello Traders,
we got fall yesterday on RSI DIV and right now all eyes on 3350 Psychological level breakout if market successfully breaks that level then it will move towards 3330 or even 3315 level
some retracements remains pending around 3400-3412 zone GOLD will might retrace that zone before going further down
Reminder: PMI's day in the market
Disclaimer: Forex is Risky
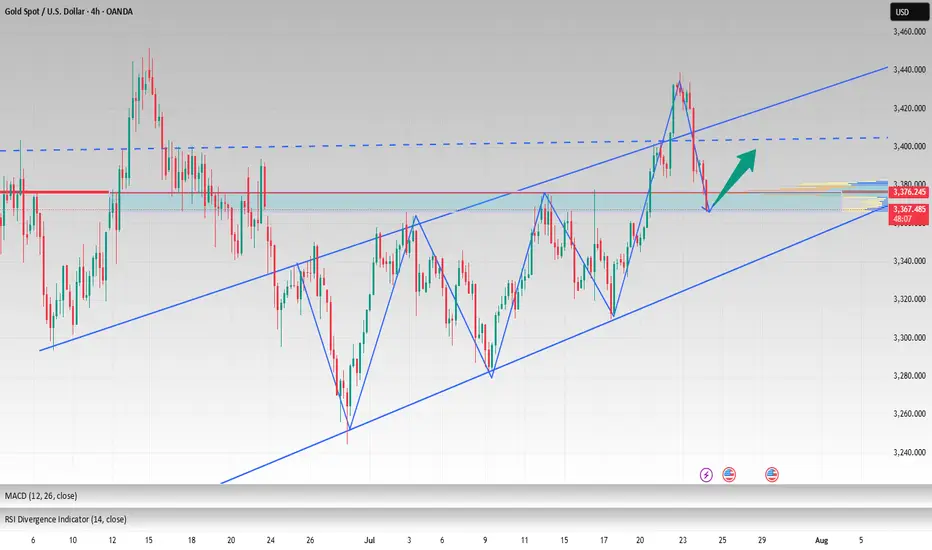
Deep Pullback on XAUUSD Gold: What I'm Watching Now🚨 Gold Update & Trade Plan 🚨
Taking a look at Gold (XAUUSD) right now — it's been trending strongly in an uptrend 📈, showing impressive momentum over the past sessions. However, we've recently seen a deep pullback 🔻 that has tapped into a key liquidity pool 💧.
From this level, I'm anticipating a bullish reaction 🔁, and I’m eyeing a potential scalping or intraday opportunity. In the video, we break down:
🔹 Market structure
🔹 Price action analysis
🔹 Trend context
🔹 A complete trade plan
🎯 Entry, stop-loss, and targets are all discussed based on technicals — with precision and discipline.
This is my personal trading plan based on how I read the markets — not financial advice. Trade safe and stay sharp! ⚔️💹

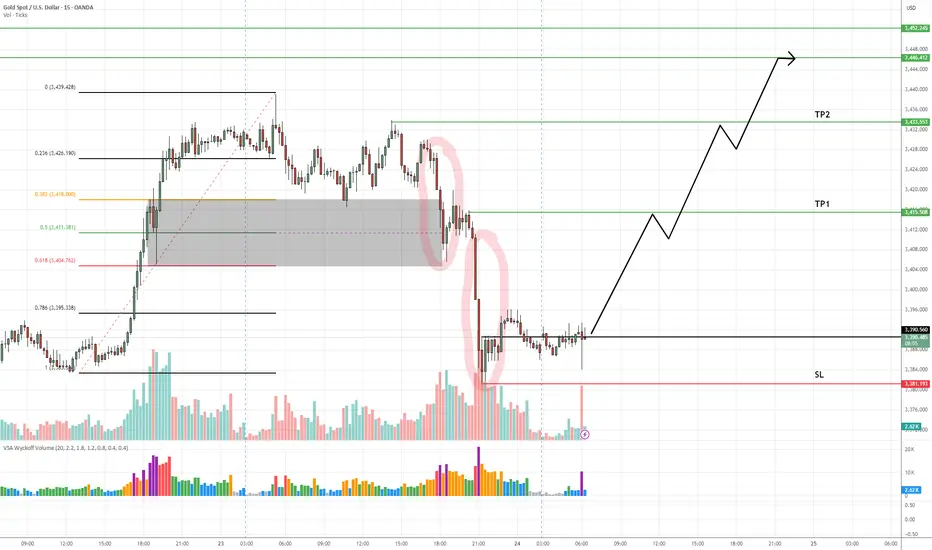
XAUUSD Buy Setup – VSA + Smart Money Reaction at Demand Zone✅ Entry: Current price action (around 3,392)
🎯 Take Profit 1 (TP1): 3,415
🎯 Take Profit 2 (TP2): 3,446–3,452
🛑 Stop Loss (SL): 3,381 (below the confirmed demand zone)
📊 Technical Insight (VSA-Based Analysis):
The sharp markdown into the demand zone occurred with expanding volume and wide spreads, a classic sign of stopping volume—potential smart money absorption of panic selling.
The second wide-range down candle was followed by lower volume and tighter spread bars, indicating supply exhaustion.
The market is forming a cause (accumulation) at the bottom of this drop, confirmed by:
No follow-through selling despite high volume
Narrow spread candles showing hesitation from sellers
Increasing volume on small up-bars, suggesting hidden buying
The zone aligns with previous structure and lies just above the 0.786 Fib retracement, adding further confluence to the bullish case.
LONG Setup - Smart Money Bias (15m)
## 🟢 LONG Setup - Smart Money Bias (15m)
- **Pair**: XAU/USD (Gold)
- **Timeframe**: 15m
- **Entry Zone**: Around **3390.050**
- **Stop Loss (SL)**: **3377.200**
- **Take Profit Targets**:
- **TP1**: 3402.800
- **TP2**: 3410.500
- **TP3**: 3418.800
---
### 📌 Confluences:
- Demand zone respected and tapped.
- Bullish reaction from POI (Point of Interest).
- FVG (Fair Value Gap) filled and reversal initiated.
- BOS + CHoCH in lower timeframe confirmed.
- Forecast projection aligns with upside inefficiency.
---
### 🧠 Strategy:
- Smart Money Concepts (SMC)
- Liquidity Sweep below demand
- Risk-Reward Ratio: ~1:2.3
🚨 **Note**: Trade with caution around US market open hours (volatility expected).
📌 Disclaimer & Reflection
Before we dive into today's mark down, I want to take a moment to address the previous signal that hit stop loss. As traders, we must acknowledge that losses are part of the process—no matter how solid our analysis may be. I take full responsibility for the outcome, and I appreciate the trust and patience of this community.
Every stop is a reminder that perfection doesn't exist in the markets—only probabilities. What matters most is how we adapt, learn, and continue to evolve.
Let's move forward with clarity and discipline.

Gold breaks new high, expect a pullback in the evening#XAUUSD
After the rapid rise of the previous day, the gold market has fallen into an overbought state, but yesterday's increase of nearly $60 still provided solid support for the bulls. It is expected that the market will show repeated fluctuations in the future⚖️.
In terms of operation, it is recommended to pay close attention to the gains and losses of the 3,400 mark. If it is successfully broken through, it is expected to further test the 3,420-3,425 and 3,450 lines; on the downside, pay attention to the top and bottom conversion support of 3,403📈.
📊At present, you can consider shorting near 3430, defending 3440, and aiming at 3410💡
🚀SELL 3430-3440
🚀TP 3415-3405
gold on bullish#XAUUSD price expect bullish range between 3430, breakout there will take the price above 3450-3453.
Entry on buy 3430, target 3453, stop loss 3419.
Below 3416 holds a strong bearish continuation, target 3400.

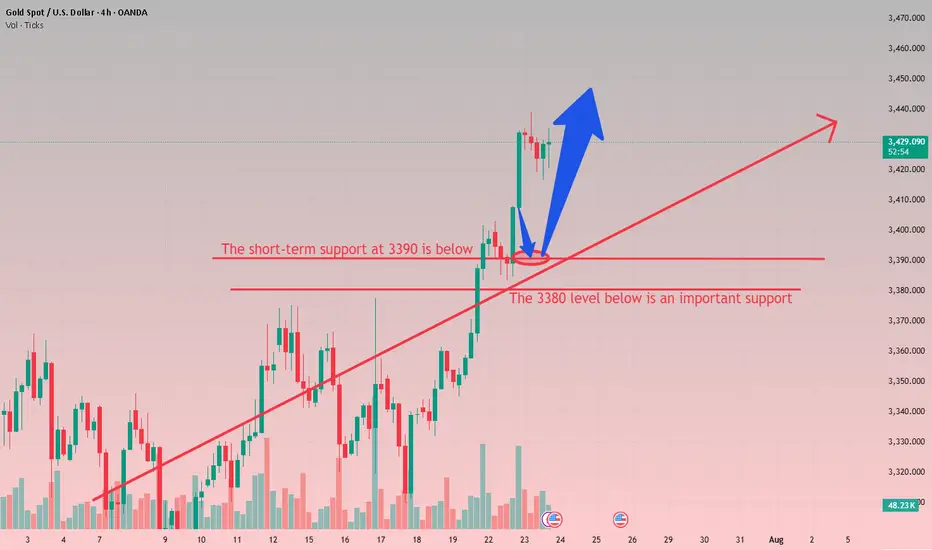
Don't chase gold at high levels, buy more when it falls back to From the 4-hour analysis, today's support is around 3400-10. If the intraday retracement relies on this position, the main bullish trend remains unchanged. The short-term bullish strong dividing line focuses on the 3380 mark. If the daily level stabilizes above this position, the rhythm of retracement will continue. Short positions against the trend should be cautious.
Gold operation strategy:
Gold retracement to 3400-10 line to go long, retracement to 3390-95 line to cover long positions, stop loss 3379, target 3435-3440 line, continue to hold if it breaks;
XAUUSD Analysis todayHello traders, this is a complete multiple timeframe analysis of this pair. We see could find significant trading opportunities as per analysis upon price action confirmation we may take this trade. Smash the like button if you find value in this analysis and drop a comment if you have any questions or let me know which pair to cover in my next analysis.

CFD XAU/USD - 5m Buy Setup# 🟦 CFD XAU/USD - 5m Buy Setup
**Market:** CFD XAU/USD
**Timeframe:** 5 Minutes (M5)
**Direction:** 🔵 BUY
---
## 📌 Setup Details
- **Entry Zone:** Inside the blue arrow structure (curved shape detected)
- **Pattern:** Bullish curve + upward break of micro-structure
- **Bias:** Buy after confirmation of support on blue arrow structure
- **Context:** Momentum pickup after prior liquidity sweep
---
## ✅ Trade Levels
- **Entry:** At the retest of the curved zone (preferably lower wick tap)
- **Stop Loss (SL):** Below the curve base – approx. `SL: XX.XX`
- **Take Profit 1 (TP1):** Reaction to intraday high – approx. `TP1: XX.XX`
- **Take Profit 2 (TP2):** Next visible supply / FVG zone – approx. `TP2: XX.XX`
- **Take Profit 3 (TP3):** Breakout continuation target / 1:3 RR level – approx. `TP3: XX.XX`
---
## 📈 Notes:
- Ensure confirmation via bullish engulfing / momentum candle before entry.
- Avoid chasing — wait for price to tap into demand with low volume.
- Align with overall bias (check higher timeframe 15m or 1h).
---
*Posted by @Persiaux_King 👑*

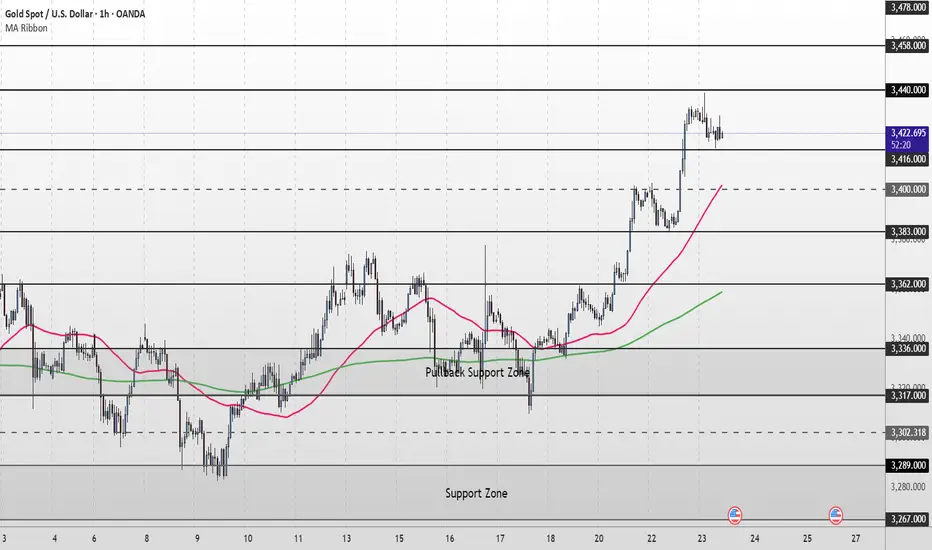
XAU/USD Intraday Plan | Support & Resistance to WatchGold has continued its rally, breaking through the 3,416 resistance and pushing into the next upside zone.
Price is now trading around 3,421, just below the 3,440 resistance cluster.
The structure remains bullish with price holding firmly above both the 50MA and 200MA, which are acting as dynamic support.
A confirmed break and hold above 3,440 would open the path toward 3,458 and potentially the higher‑timeframe target at 3,478 if momentum extends.
If price fails to sustain above 3,416–3,440 and begins to fade, watch the initial pullback toward 3,400.
A deeper move below that would shift focus to 3,383 - 3,362 and then the Pullback Support Zone.
Failure to hold there could expose price to the lower Support Zone if bearish pressure builds.
📌 Key Levels to Watch
Resistance:
‣ 3,440
‣ 3,458
‣ 3,478
Support:
‣ 3,416
‣ 3,400
‣ 3,383
‣ 3,362
‣ 3,336
🔎 Fundamental Focus
⚠️Not much on the calendar today. Still, manage your risk and stay prepared for any unexpected volatility.
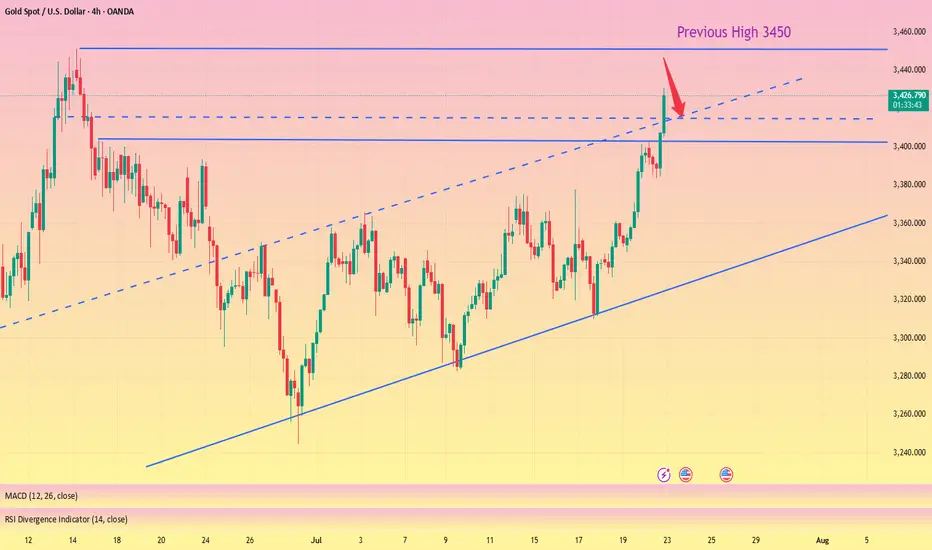
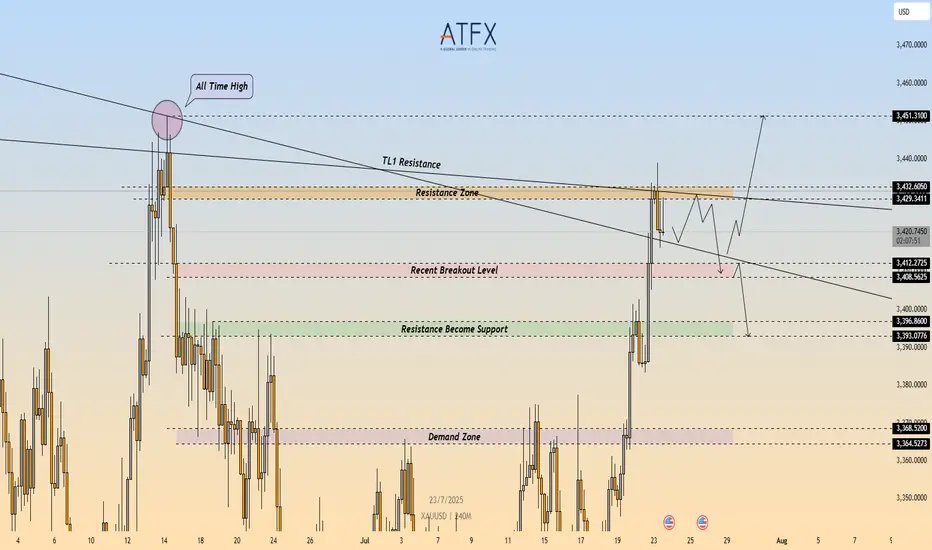
XAU/USD: Bearish Rejection at $3,432 – Short Setup in Play🔴 XAU/USD – Bearish Rejection at Key Resistance Zone ($3,432)
🔍 Technical Outlook
Gold (XAU/USD) failed to break through the $3,429–$3,432 resistance zone, which aligns with a descending trendline (TL1) and prior swing high. The rejection from this confluence zone is reinforcing bearish pressure, with price now carving out lower highs on the 4H timeframe.
A clean break below $3,412 would confirm bearish continuation and open the door toward the $3,400 area, followed by the demand zone at $3,368–$3,365.
🔻 Short Setup
Entry: 3,432
Stop Loss: 3,436
Take Profit 1: 3,412
Take Profit 2: 3,396
R\:R Ratio: ≈ 1 : 6.95
Invalidation: Close above 3,436
📌 Key Levels
Resistance: 3,429 – 3,432
Support 1: 3,412
Support 2: 3,368 – 3,365
Trendline: Long-term descending resistance acting as ceiling
📘 Summary
Gold remains capped beneath a critical resistance cluster. The rejection around $3,432 could trigger a deeper pullback toward $3,396, especially if sellers push price below $3,412. Bearish bias remains valid while price holds under the trendline.
📉 Bias: Bearish
📈 Confirmation Trigger: Break below $3,412
⚠️ Invalidation Level: Above $3,436
GOLD Intraday Chart Update for 23 July 25Hello Traders
First of all i hope you were enjoying yesterday move with 400 Pips Reward
For today we have 3400 Psychological remains in focus if market breaks below 3400 then it will move towards 3364-76 zone otherwise we are remain buyers above 3400 Level
Strong Resistance zone for intraday is at 3445-3465 if market cross 3465 the it will move towards ATH test which is around 3500
Disclaimer: Forex is Risky
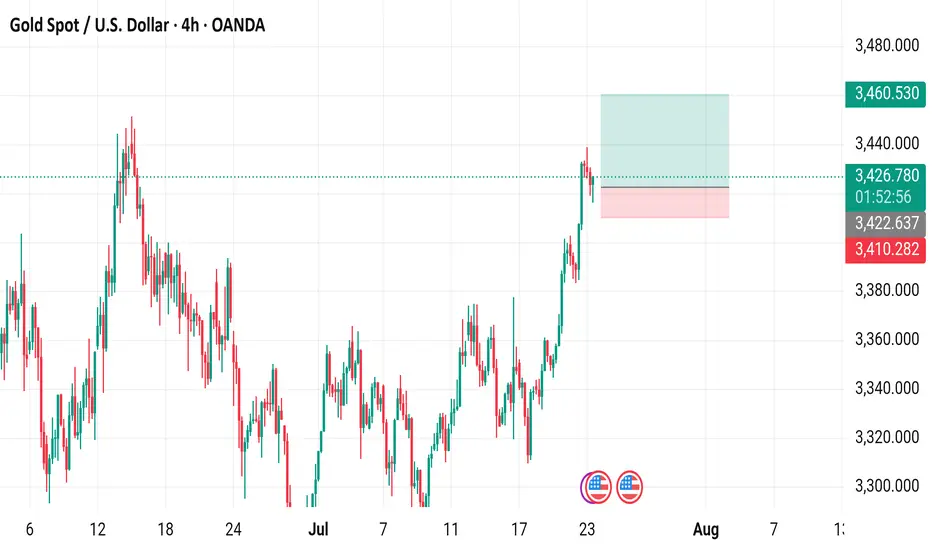
Gold Spot / U.S. Dollar (XAUUSD) - 4 Hour Chart (OANDA)4-hour chart from OANDA displays the price movement of Gold Spot (XAUUSD) from late July to early August 2025. The current price is 3,426.260, with a recent decrease of 5.185 (-0.15%). The chart shows a buy price of 3,426.580 and a sell price of 3,425.950, with a resistance level around 3,460.530 and support near 3,410.282. The data reflects trading activity as of 01:54:22 on July 23, 2025.
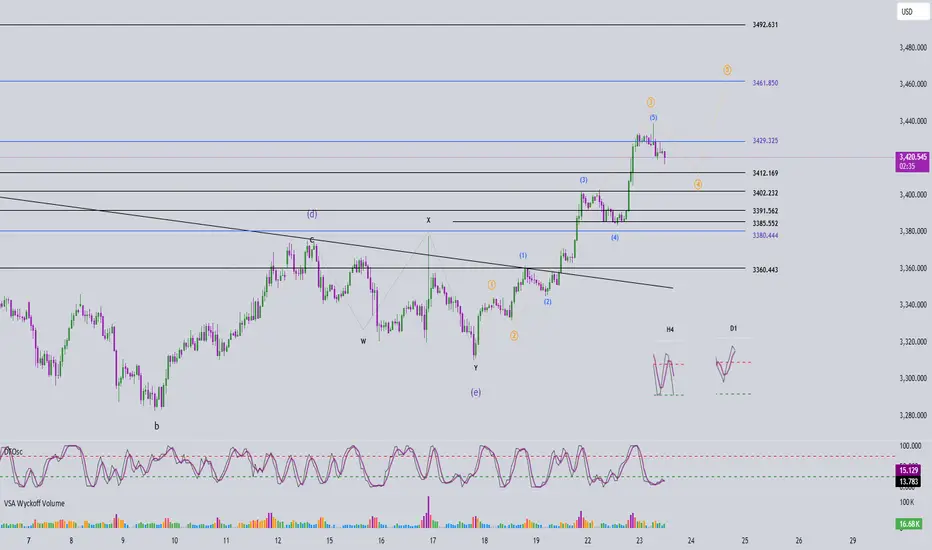
Elliott Wave Analysis – XAUUSD July 23, 2025________________________________________
🔍 Momentum Analysis:
• D1 Timeframe: Daily momentum is showing signs of a potential bearish reversal. We need to wait for today’s daily candle to close to confirm this. It signals that the bullish momentum is weakening.
• H4 Timeframe: Momentum is turning down. It may take around 2 more bearish H4 candles to push momentum into the oversold zone → suggesting continued downside movement today.
• H1 Timeframe: Momentum is already in the oversold zone and the indicators are “clinging” together → implying possible continued minor declines or sideways movement.
________________________________________
🌀 Elliott Wave Structure Update:
• On the H1 chart, a 5-wave structure (yellow) is unfolding.
o Wave 3 (yellow) appears completed, supported by a clear 5-wave internal structure in blue.
o The market is currently in Wave 4 (yellow) – a corrective move.
🔸 Potential Wave 4 (yellow) targets:
• Target zone 1: Around 3412
• Target zone 2: Around 3402
📌 Once Wave 4 (yellow) completes, we anticipate the market will form Wave 5 (yellow).
🔸 Projected Wave 5 (yellow) targets:
• TP1: 3461
• TP2: 3492 (in case of an extension)
________________________________________
🔄 Combining Momentum & Wave Structure:
• The potential bearish reversal in D1 momentum suggests the current bullish trend may be nearing its end – consistent with Wave 5 being the final push before a broader correction.
• H4 and H1 momentum support the ongoing correction in Wave 4.
✅ Wave 4 typically takes the form of a zigzag, flat, or triangle → Wait for a strong bullish H1 candle to confirm the end of Wave 4 and initiate a buy entry.
________________________________________
📊 Trade Plan:
🟩 Buy Zone 1:
• BUY ZONE: 3414 – 3412
• SL: 3407
• TP1: 3439
• TP2: 3461
• TP3: 3492
🟩 Buy Zone 2:
• BUY ZONE: 3403 – 3401
• SL: 3393
• TP1: 3439
• TP2: 3461
• TP3: 3492