gold on buy retrace#XAUUSD buy on 2 times breakout above 3300. The bullish needs formation there to start buying.
Buy limit 3300 on 2 times breakout, target 3316-3328, stop loss 3290.
Below 3287 holds bearish continuation if the m30-H1 closes below there target 3267.
Xauusdidea

GOLD Intraday H2 Chart update for 9 July 2025Hello Traders
as you can see that we have strong resistance on 3310 level only break above that level will consider bullish move
Below 3300 Psychological level market remains Bearish and move towards 3245 level
FOMC Meeting minutes dues today
Disclaimer: Forex is Risky
XAUUSD 15Min – Bullish Reaction from Demand Zone | SMC AnalysisSmart Money Concept (SMC) Analysis
Price has tapped into a clearly defined 4H Demand Zone (highlighted in green) with multiple rejections. Prior liquidity was swept below the 3288 region, trapping early sellers and grabbing institutional interest. This is a classic liquidity grab + demand zone confluence.
🔹 Entry: 3290 – Inside Demand Zone
🔹 SL: 3282 – Below Liquidity Sweep
🔹 TP: 3320 – Targeting Last Broken Structure (Break of Structure)
🧠 Smart Money Clues:
Liquidity grab under the lows ✅
Clean rejection wick ✅
BOS (Break of Structure) above needed for confirmation
Anticipating move back to 3320.57 (blue line) – previous SMC mitigation level
🟢 If price breaks above 3300 with strong volume, more upside is likely.
#XAUUSD #GoldAnalysis #SmartMoney #SMC #DemandZone #LiquidityGrab #TradingView #ForexSignals

Elliott Wave Analysis – XAUUSD July 9, 2025
🔻 Momentum Analysis
D1 timeframe: Momentum is approaching the oversold zone and may reverse upwards today or tomorrow.
H4 timeframe: Momentum is already in the oversold zone. The two momentum lines are converging, signaling weakening downward pressure and a potential reversal.
🌀 Elliott Wave Structure
The price level around 3318 (previous buy zone) failed to hold, despite a ~100-pip bounce before continuing to decline.
Currently, price is nearing the lower boundary of a contracting triangle – a typical abcde corrective pattern.
Based on the current wave structure:
- Wave d (purple) appears to be complete.
- Price is now likely forming wave e, expected to end near 3279, which coincides with the triangle’s bottom support.
If the pattern holds, a strong breakout above the upper triangle boundary is expected once wave e completes.
However, note: the formation of a triangle during a corrective wave often signals that the uptrend is nearing its end in the longer term.
📌 Trading Plan
Given the complex 3-wave structure typical of triangles, risk is elevated, so:
Trade with reduced position size, or
Preferably wait for a confirmed breakout above the triangle before entering.
Suggested Trade Setup:
✅ Buy Zone: 3280 – 3277
❌ Stop Loss: 3270
🎯 Take Profits:
TP1: 3309
TP2: 3342
TP3: 3390

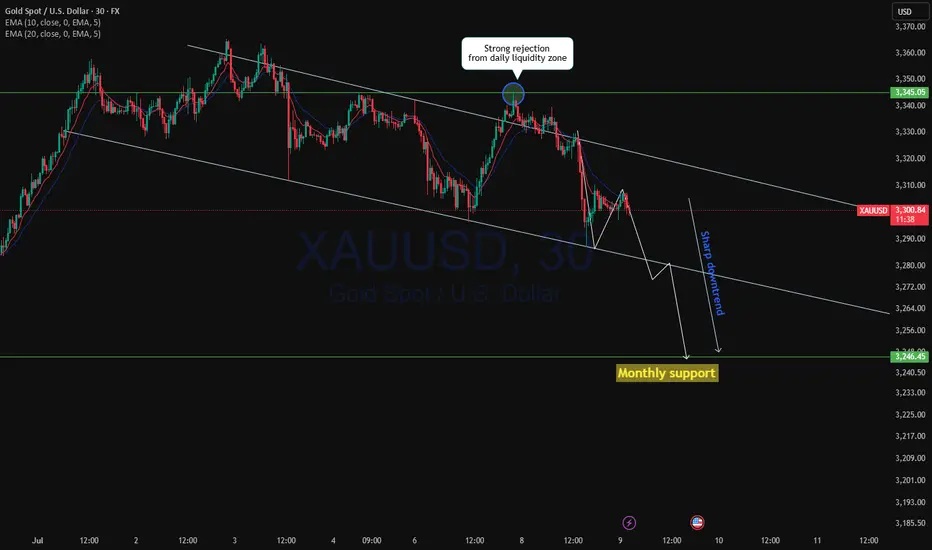
XAUUSD Continue to drop?XAUUSD from daily resistance of 3345.00 after strong liquidity grab price started to fall with strong momentum to the daily support level. Yesterday we have seen a long daily doji formed with a long wick at the bottom followed by wick fill as expected with long bearish engulfer with both cross over of 10ema and 20ema.
Currently price in sharp downtrend and possibility to drop to monthly support below 3250.00
A bearish trade is high probable.
XAU/USD Analysis – Expecting Fibonacci Retracement to 0.618 I’m currently anticipating a short-term retracement in XAU/USD towards the 0.618 Fibonacci level around 3323, followed by a continuation of the bearish move targeting a Fair Value Gap (FVG) around 3272.
📌 Technical Confluence:
The market has recently shown a strong bearish impulse, and the current price action appears to be forming a corrective retracement.
The 0.618 retracement level aligns with a key resistance area around 3323, increasing the probability of a bearish reaction from this zone.
There’s a visible FVG left unfilled near 3272, which may act as a price magnet.
I’m also watching for a liquidity sweep above local highs, followed by bearish confirmation on the lower timeframes (e.g., 5min) to trigger a short entry.
📉 Trade Idea:
Looking for a sell entry near 3323 after confirmation (liquidity grab, bearish structure shift, etc.)
Target: 3272 FVG zone
Stop Loss: Just above recent highs or liquidity zone, depending on intraday structure

Wednesday's Gold Trend Analysis and Trading RecommendationsGold surged on Tuesday but then kept pulling back during the U.S. session, hitting a recent new low, with intense seesawing between bulls and bears currently. The fluctuating U.S. tariff policies have triggered volatility in risk-averse sentiment, while the over 95% probability that the Federal Reserve will keep interest rates unchanged in July has provided support to the U.S. dollar.
Technically, focus should be on the key support level around 3260 and the strong resistance range of 3320 above. The hourly chart shows short-term moving averages diverging downward, with candlesticks under pressure and showing short-term weakness, suggesting there is still a need for a pullback tomorrow. The current bull-bear watershed lies at the 3390 mark; if gold fails to break through and stabilize above 3315 effectively, any short-term rebound can be seen as a good opportunity to enter short positions.
The 4-hour chart indicates that gold found support near 3287 and slowly recovered losses, but it remains trapped in a consolidation pattern recently. Although the 3287 support is effective, the consolidation range has not been broken. The future direction depends on the actual defensive strength of the 3260 support level and the direction of the range breakout.
For Wednesday's trading, the main strategy is to go short on rebounds. Focus on the resistance zone of 3315-3320, where short positions can be established. The downside targets are 3270 and the key support level of 3260 in sequence. If 3260 is broken through effectively, it may open up more downward space.
XAUUSD
sell@3315-3320
tp:3300-3280-3260
Investment itself is not the source of risk; it is only when investment behavior escapes rational control that risks lie in wait. In the trading process, always bear in mind that restraining impulsiveness is the primary criterion for success. I share trading signals daily, and all signals have been accurate without error for a full month. Regardless of your past profits or losses, with my assistance, you have the hope to achieve a breakthrough in your investment.

Gold Returns to the $3,300 per Ounce ZoneOver the past two trading sessions, gold has depreciated more than 1.5%, as a consistent bearish bias begins to emerge in price action. For now, selling pressure has remained steady, supported by a temporary decline in global economic uncertainty and a recent rebound in U.S. dollar strength, factors that have led gold’s upward momentum to steadily weaken.
Lateral Range Remains Intact
Recent price action in gold has defined a well-established sideways channel, with resistance near $3,400 and support around $3,200 per ounce. So far, price movement has been insufficient to break out of this range, making it the most relevant technical structure to monitor in the short term. As long as price remains within these boundaries, neutrality may continue to dominate.
Technical Indicators
MACD: The MACD indicator continues to oscillate near the neutral zero line, signaling that momentum from moving averages remains balanced. If this pattern persists, the sideways range could extend further.
RSI: A similar pattern is unfolding with the RSI, which is hovering around the 50 level, indicating a constant balance between buying and selling pressure. Sustained moves at this level could reinforce short-term price neutrality.
Key Levels to Watch:
$3,400 per ounce: This historical high acts as the most significant resistance in the short term. A breakout above this level could trigger a stronger bullish bias and revive the upward trend stalled in recent weeks.
$3,300 per ounce: The current level aligns with the 50-period simple moving average. Price movement around this zone could extend market neutrality.
$3,200 per ounce: A key support level and recent low. A retest of this area could trigger a more decisive bearish bias in the short term.
Written by Julian Pineda, CFA – Market Analyst

XAUUSD:Sharing of the Latest Trading StrategyAll the trading signals this week have resulted in profits!!! Check it!!!👉👉👉
Gold Market Analysis:
Overnight Dynamics: Following Trump’s reinstatement of tariffs, gold’s safe-haven demand drove another rally, but it still pulled back after facing pressure at the 3345 level. The decline extended today, requiring attention to the sustainability of safe-haven flows—recently, safe-haven-driven rallies have often been followed by pullbacks, so caution remains warranted for further gold corrections.
Technical Trends:
On the daily chart, gold continues to trade in a narrow range, with short-term moving averages essentially converging and flattening, suggesting a high probability of continued sideways movement in the near term.
The current range is temporarily compressed between 3285–3345, with the market bias leaning toward a "range-bound bearish" trend.
Trading Bias: Maintain a bearish stance on rebounds!
Trading Strategy:
Sell@3330-3320
TP:3300-3280

XAUUSD Short / Sell Setupwait for the entry and place tp & SL, must use SL, never exceed more than 2% on SL of your portfolio on any trade. If tp is achieved first then trade setup will be invalid.
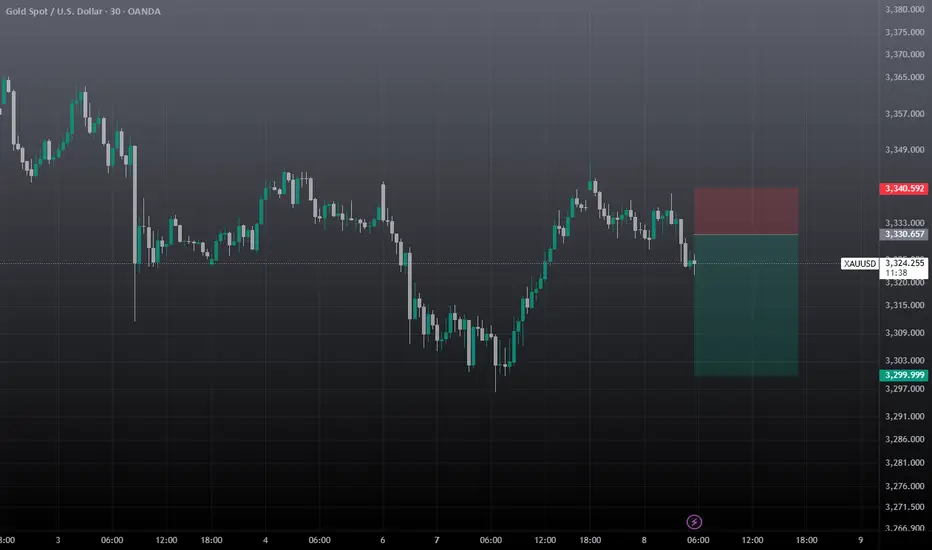
Setupsfx_ | XAUUSD(Gold):07/07/2025 Update | Gold dropped nicely when the market opened last night, dropping around 600 pips. However, it couldn’t hold on to the gains and came right back to the selling zone. There are two entry points and two potential targets.
Good luck and trade safely!
Team Setupsfx_

XAUUSD Breakout Done , Long Entry Valid Now To Get 150 Pips !Here is my opinion on Gold On 15 Mins , we have a very good closure with breakout candle and now the price retest the broken res and new support and we can enter a buy trade as a scalping , if we have a 4H Closure Below 3326.00 this idea will be not valid anymore.

GOLD ON BUY FROM 3316#XAUUSD price we expect drop till 3316 for bullish range to form.
Buy limit 3316-3315.5, target 3330, stop loss 3310.
Below 3306 holds bearish continuation, target 3290-3280.
Bullish range can form above 3330 on 2 times breakout, target 3345

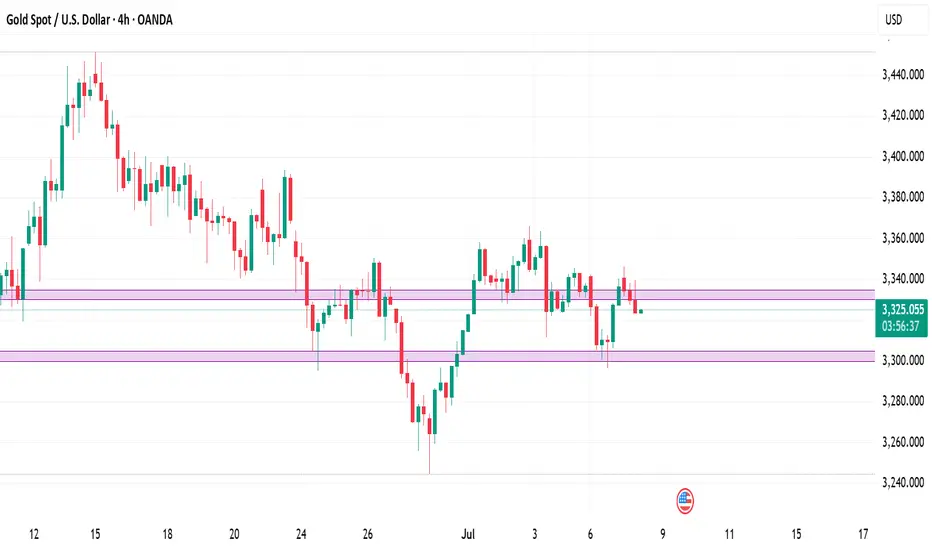
4‑Hour Technical Framework- 8th July 2025Current Price: ~$3,330
Timeframe Focus: 4‑Hour and 1‑Hour
Directional Bias: Neutral-to-Bearish
Methodologies Used:
✅ Price Action, Fibonacci Levels, Support & Resistance
✅ Supply & Demand Zones
✅ ICT / Smart Money Concepts (BOS, CHoCH, Liquidity, OB, FVG)
4‑Hour Market Structure Analysis
Gold has shifted into a neutral-to-bearish regime on the 4‑hour timeframe, after a decisive Break of Structure (BOS) below prior swing lows at ~$3,345 and a clear Change of Character (CHoCH) as bulls failed to sustain above the ~$3,350 level. Price currently hovers around ~$3,330, consolidating within a bearish Fair Value Gap (FVG) left by the recent impulsive drop.
Key Observations:
A liquidity grab above $3,349 (stop sweep) preceded a sharp reversal, validating this as a sell-side liquidity zone.
The 4H supply zone / bearish Order Block (OB) at $3,345–$3,350 remains unmitigated and likely to attract sellers.
Immediate downside is cushioned by a 4H demand zone & FVG at $3,300–$3,305, which has acted as support during the prior dip.
A deeper daily demand zone rests around $3,280–$3,290, which aligns with historical support and unmitigated buy‑side liquidity.
Key 4‑Hour Levels to Watch
Price Level Type Notes
$3,360–$3,365 Supply / Fib 61.8% Strong resistance
$3,345–$3,350 Supply / OB + 50% Fib Primary sell zone
$3,330–$3,334 Bearish FVG Active imbalance
$3,300–$3,305 Demand / FVG Primary buy zone
$3,280–$3,290 Demand (daily OB) Secondary buy zone
The neutral-to-bearish bias is reinforced by the fact that price has failed to reclaim prior support and continues to respect supply zones.
1‑Hour Intraday Trade Ideas
Zooming into the 1‑hour chart, we align intraday setups with the broader 4H directional bias: selling into supply and covering into demand.
Setup 1: Short at 4H Imbalance
Entry: ~$3,332–$3,334 (inside active FVG)
Stop-Loss: Above $3,335
Targets:
TP1: $3,305
TP2: $3,280
Confluences: BOS + CHoCH, 4H FVG, sell‑side liquidity above.
Setup 2: Short on Retracement
Entry: ~$3,345–$3,350 (50% Fib + OB)
Stop-Loss: Above $3,352
Targets: Same as Setup 1.
Setup 3: Aggressive Long (Countertrend)
Entry: ~$3,300–$3,305 (demand + FVG)
Stop-Loss: Below $3,295
Target: $3,327
Note: Only valid if strong bullish reaction occurs in demand.
The Golden Setup
Sell at ~$3,332–$3,334 (active 4H imbalance) with a target of $3,300.
This setup offers maximum confluence — bearish FVG, BOS, and supply rejection — with tight risk parameters and favorable reward/risk ratio.
Summary Table
Bias Levels of Interest
Directional Bias Neutral-to-Bearish
Strong Sell Zones $3,330–$3,334 and $3,345–$3,350
Strong Buy Zones $3,300–$3,305 and $3,280–$3,290
Closing Notes
Gold continues to respect Smart Money footprints on the 4‑hour chart, suggesting more downside unless bulls reclaim $3,350 decisively. Today’s focus remains on short opportunities at premium levels into supply and imbalances, targeting well‑defined demand areas below.
Watch price action closely in the $3,332–$3,334 zone for the highest‑probability short entry of the session — The Golden Setup.
XAUUSD Outlook: How Risk Sentiment Could Shape the Next MoveI’m currently analysing XAUUSD (Gold) 🟡, which has come under bearish pressure 📉, showing signs of downside momentum. In the video 🎥, we also explore the inverse correlation between Gold and risk assets like the NASDAQ 📊.
Keep a close eye on NASDAQ movements—if risk assets break bullish 🚀, we may see further weakness in Gold. On the other hand, if risk sentiment shifts and risk assets break bearish 🛑, Gold could attract safe-haven demand and gain strength 💪.
We also dive into the price action, market structure, and pull up the volume profile 🧩. Gold is currently trading around the Point of Control (POC) ⚖️—a key level where significant volume has accumulated. A clean break above or below this area could act as a technical trigger for the next move 📈📉.
As always, this is not financial advice ⚠️—just my market view.

XAUUSD Analysis todayHello traders, this is a complete multiple timeframe analysis of this pair. We see could find significant trading opportunities as per analysis upon price action confirmation we may take this trade. Smash the like button if you find value in this analysis and drop a comment if you have any questions or let me know which pair to cover in my next analysis.

GOLD H2 Intraday Chart Update for 8 July 2025Hello Traders
Gold is still in a range between 3300 - 3350 Psychological level, all eyes on breakout of both mentioned psychological levels for now
Intraday Strong support zone is located 3290-3300
Intraday Strong Resistance zone is located 3350-3360
US TARIFF WAR remains agenda for now
Disclaimer: Forex is Risky

Elliott Wave Analysis – XAUUSD – July 8, 2025🔎 Momentum Analysis
On the daily (D1) timeframe, momentum is currently declining. At the same time, the 4H momentum is showing signs of reversing downward. This suggests a likely short-term corrective decline, which provides a basis for projecting potential Elliott Wave patterns.
🌀 Elliott Wave Structure
On the 4H chart, I currently see two main possible scenarios:
Scenario 1: Contracting Triangle Correction (abcde – purple)
This scenario assumes a contracting triangle correction labeled abcde in purple.
The market appears to be in wave d (purple), which is unfolding as a wxy corrective structure. Currently, it is likely in wave y.
The projected target for the end of wave y is between 3393 – 3402.
However, due to the declining momentum, I expect a short-term pullback to the 3318 – 3321 region before price resumes upward to complete wave d.
Scenario 2: Larger WXY Correction
In this case:
Wave W has completed as a standard 3-wave abc.
Wave X has also completed as a double zigzag.
Wave Y appears to be forming a small contracting triangle abcde in red.
Currently, the price is being compressed between the upper and lower boundaries of the red triangle, suggesting that it is in the final wave e.
In this scenario, the projected retracement also aligns with the 3318 – 3321 zone. After completing wave e, price is expected to break out strongly above the upper boundary of the red triangle.
✅ Strategic Conclusion
Both scenarios point to a confluence zone at 3318 – 3321, making this a key potential buying area. Two trading approaches can be considered:
Aggressive Entry: Buy within the 3318 – 3321 range.
Conservative Entry: Wait for a confirmed breakout above the red triangle before entering a long position.
📈 Suggested Trade Plan
Buy Zone: 3318 – 3321
Stop Loss: 3308
Take Profit 1: 3342
Take Profit 2: 3362
Take Profit 3: 3393

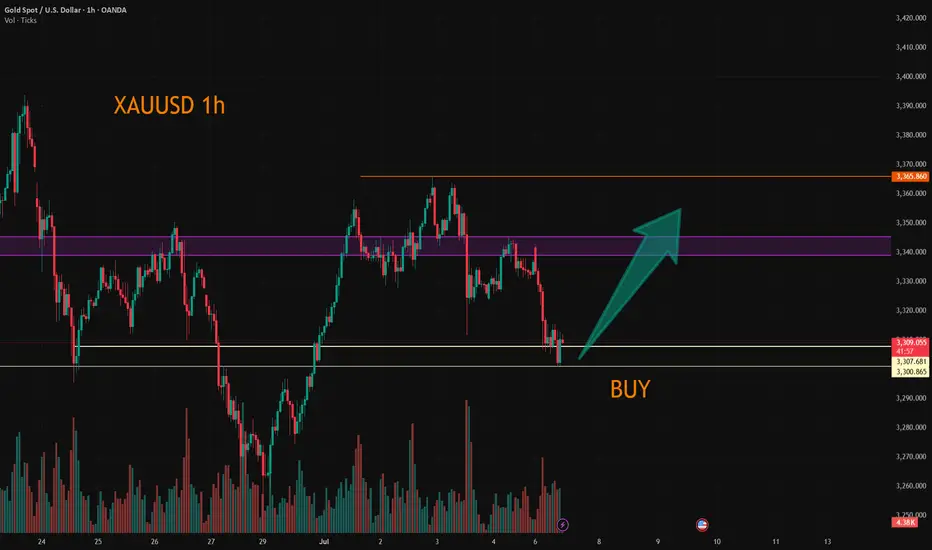
XAUUSD Short Term Possibility AnalysisGold has an are between 3324 to 3328. It hold for a while there and target back to one hour OB which is residing on 3355 to 3365. Previous day gold move shows intense buying which is sign of potential buying in gold. As weekly candles show strong uptrend the possible move for gold will be in uptrend therefore two scenarios are shared here. If gold breaks 3324 to 3328 support it will possibly target the daily low which is residing on 3295.

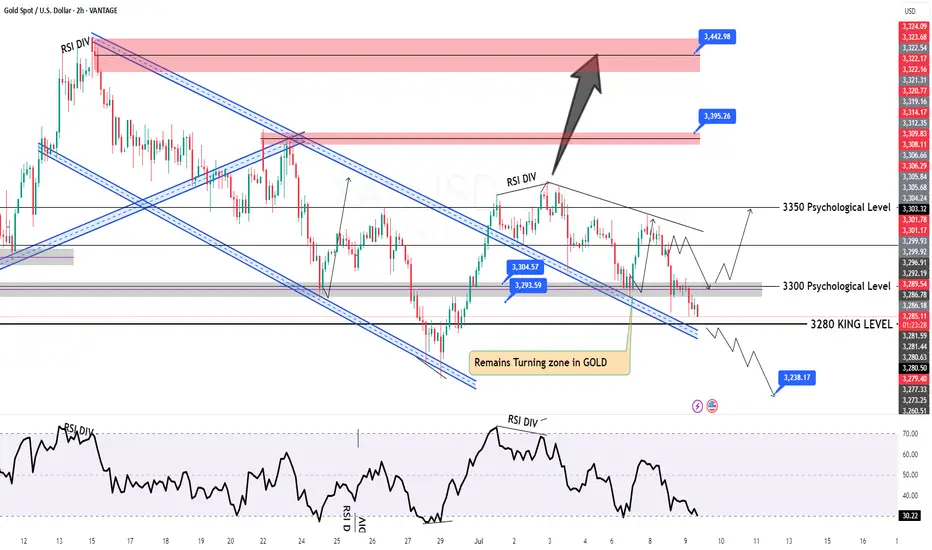
XAU/USD Eyes Key Resistance Amid Fresh Tariff Fears🟡 TVC:GOLD Gold Price Forecast: XAU/USD Eyes Key Resistance Amid Fresh Tariff Fears
OANDA:XAUUSD Spot gold (XAU/USD) is recovering from intraday lows near $3,296, now trading around $3,330 as fears over renewed U.S. tariffs fuel safe-haven demand. President Trump has begun issuing formal letters announcing fresh import tariffs—25% on South Korea, additional measures on Japan, and a 10% universal tariff on countries aligning with BRICS. With the 90-day tariff pause expiring August 1 and no trade progress in sight, geopolitical and economic uncertainty continue to support gold’s floor.
📉 Technical Structure
XAU/USD remains within a descending channel on the 1H chart, with price currently approaching the $3,338–$3,340 Resistance Zone 1. A clean breakout above the upper channel boundary could trigger a move toward the broader $3,364 Resistance Zone 2. Conversely, failure to break above Resistance Zone 1 would keep the bearish channel intact, with downside targets toward the $3,302–$3,305 support zone.
📌 Key Technical Zones
Resistance Zone 1: $3,338–$3,340
Resistance Zone 2: $3,364
Support Zone: $3,302–$3,305
Channel Structure: Bearish unless broken to the upside
📘 Strategy Summary
XAU/USD is showing signs of short-term recovery, but remains technically capped unless it breaks through $3,340 resistance. As long as the descending channel holds, rallies may be sold into. A confirmed break above $3,340 could shift bias toward $3,364, while rejection may reopen the path to $3,305 and potentially lower.
⚠️ Disclaimer
This analysis is for informational purposes only and does not constitute investment advice. Please consult a licensed financial advisor before making trading decisions.

Tuesday Outlook on Gold (XAU/USD)
After Monday’s move into the 4H Fair Value Gap and rejection near the trendline and Asia High, I’m expecting a corrective move to start Tuesday.
I’m currently watching two possible downside targets:
🔸 Scenario 1: A short-term drop into the upper part of the 4H FVG (around 3320–3310) – this zone could act as intraday demand and cause a quick bounce.
🔸 Scenario 2: A deeper retracement toward the unfilled imbalance around 3290–3280, lining up with the London Low and completing the 4H FVG.
This would be a more significant liquidity sweep before a potential bullish reaction.
From both zones, I’ll be looking for price action to confirm a possible long setup back toward the trendline and above.
Let’s see how Tuesday plays out.

XAUUSD:Go long
Gold prices fell back in Asian trading on Monday, as they digested Friday's negative data. The short term may be partial shock, but the medium and long term news surface uncertainty or to provide support for gold prices, so trading ideas, retracement to do long can.
Trading Strategy:
Both 3300 and 3308 can be used to enter the long position, short-term traders can look at 3325-30, followed by 50 around.
For intermediate traders, the target sees 3365-70 unchanged, and the retracting of 3300/3310/3330 is an opportunity to go long.
More detailed strategies and trading will be notified here ↗↗↗
Keep updated, come to "get" ↗↗↗
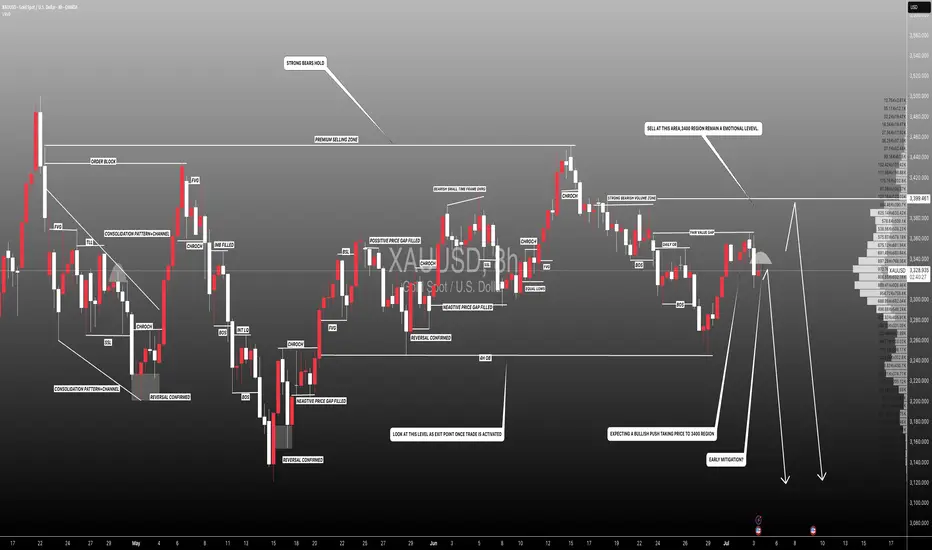
#XAUUSD: Early Mitigation Or Sellers Trap! Let's See Gold dropped after touching 3365 taking price to 3318.Currently ranging market showing confusion over how gold would react to NFP data which is coming out tomorrow. At this moment we are quite certain that price would drop tomorrow either from entry one or entry two. Please use accurate risk management while trading.
Good luck and trade!
Team Setupsfx_