XAUUSD Analysis todayHello traders, this is a complete multiple timeframe analysis of this pair. We see could find significant trading opportunities as per analysis upon price action confirmation we may take this trade. Smash the like button if you find value in this analysis and drop a comment if you have any questions or let me know which pair to cover in my next analysis.
Xauusdideas

GOLD UPDATES – XAUUSD -MAY 22nd ahead of Unemployment claims&PMIGold is walking on a tightrope today — and below it is a pit full of retail stops. With a full lineup of high-impact USD news and price tapping into key supply zones, you already know:
The first move is bait. The second pays the sniper.
🧨 FUNDAMENTAL MINEFIELD – MAY 22
Today is packed with market-moving data — every piece adds fuel to the fire:
🕒 15:30 – Unemployment Claims
230K forecast vs. 229K previous
👀 A miss = USD weakness, gold spike
🧨 A beat = potential pressure on gold
🛠️ 16:45 – Flash PMIs (Manufacturing & Services)
Manufacturing: 49.9 → contraction
Services: 51.0 → weak expansion
💥 This is the real bias decider. Two beats = gold down. Two misses = gold up. One of each = chop zone.
🌍 G7 Meetings – All Day
Geopolitical tension brewing? That’s the stealth trigger gold always loves.
🧠 MACRO STRUCTURE OUTLOOK
• HTF still shows price moving inside key supply
• D1/H4 momentum looks bullish but stretched
• No clean HTF BOS, and no new structural dominance post-May 21 sell setup
⚠️ Translation: Rally looks strong but smells like trap. NY session will expose the truth.
🗺 GOLDMINDSFX SNIPER ZONE MAP ✅
🔴 SUPPLY / SHORT BIAS ZONES
• 3355–3364
→ H1/H4 supply + internal sweep zone
→ Primary area for fakeouts/premium fades
• 3385–3395
→ Old POI + unmitigated H4 OB
→ Algo zone for stop-hunt before dump
• 3418–3427
→ Daily imbalance extension
→ Low-touch, high-R:R trap — news only
🟢 DEMAND / LONG BIAS ZONES
• 3315–3308
→ H1 OB + micro break zone
→ Must hold for bullish continuation
• 3298–3288
→ Post-CHoCH FVG + OB = sniper buy zone
→ High-prob bounce zone
• 3270–3260
→ H4 breaker + old demand
→ Key flip zone — if lost, bears take control
• 3236–3228
→ D1 OB + FVG tail
→ Only valid in a meltdown. Deep liquidity final boss.
🎯 CONTROL ZONE: 3315–3308
→ Holds = bulls stay in the game
→ Breaks = we open the door to 3288–3260 slides
⚔️ PLAYBOOK
✅ BULLISH SCENARIO
News comes in weak → price sweeps 3308 or 3288 → reclaims on M15
→ Enter on confirmation
❌ BEARISH SCENARIO
USD data strong → gold nukes 3308 → flips it to resistance
→ Short confirmed rejection at 3355 or 3385
⚠️ TRAP SCENARIO
Expect first move post-news to be fake. Spike above 3355 or below 3308 is bait.
→ Real sniper entry = the second move, after reclaim or rejection with structure
🎯 FINAL WORD
No confirmation = no entry.
The market doesn’t care how you feel. It only respects execution.
“Structure is the setup. News is the trap. Your job is to wait.”
If this helps you stay clear and deadly — drop a 🚀 and follow for sniper-grade clarity daily.
📌 Important Notice!!!
The above analysis is for educational purposes only and does not constitute financial advice. Always compare with your plan and wait for confirmation before taking action.

XAUUSD Analysis todayHello traders, this is a complete multiple timeframe analysis of this pair. We see could find significant trading opportunities as per analysis upon price action confirmation we may take this trade. Smash the like button if you find value in this analysis and drop a comment if you have any questions or let me know which pair to cover in my next analysis.

XAUSD FOMC - Gold Sniper Plan - May 7 - 2025💥 XAUUSD FOMC Sniper Plan – May 7, 2025
"We Don’t Chase Breakouts. We Build the Trap Before the Noise."
🌍 Macro & Geopolitical Context – What Really Matters Today
Markets are frozen in anticipation of tonight’s FOMC bombshell:
📌 20:00 UTC – FOMC Statement & Rate Decision
📌 20:30 UTC – Powell Speaks
Traders are split. Some expect a dovish tone to push gold through ATH. Others brace for a hawkish surprise.
But let’s get one thing straight:
Gold has already run thousands of pips. It doesn’t need help going higher — it needs a reason not to collapse.
That’s what Powell holds in his hands tonight.
Meanwhile, geopolitics stay hot in the background:
Middle East tensions simmer (again).
Trump pressure on Powell to step down adds political risk.
Global yields are compressing → gold remains macro-favored.
This is not a time for guessing. This is a time for traps.
🧠 Current Structure Snapshot (Price: 3431)
HTF is still bullish, but we're extended.
Last confirmed HH = 3488, with ATH = 3500
We're in a short-term retrace under a H4 CHoCH → excellent sniper conditions.
🧱 Key Structural Levels
Zone Type Price Range Context
🔼 R2 3488–3495 Last HH OB + extension sweep trap
🔼 R1 3448–3455 H4 OB + liquidity pocket under HH
🔽 S1 3378–3384 H4 OB + FVG + EMA 50 confluence
🔽 S2 3333–3340 D1 OB + CHoCH + imbalance zone
We don't use FIBO extensions for guessing entries. We use them to target the crowd who does:
Extension Price Range Use
1.272 3530–3535 TP3 only
1.618 3575–3580 Final exhaustion area
🎯 Sniper Setups – Real, Refined, Ruthless
🟢 Buy #1 – 3378–3384
Valid H4 OB
FVG tail fill + internal liquidity
RSI around 40 + EMA 50 bounce
SL: 3365
TP1: 3405 | TP2: 3430 | TP3: 3455
🧠 Our first reaction zone before news madness.
🟢 Buy #2 – 3333–3340
D1 OB + imbalance
Clean internal liquidity from 3300–3330
Confluence with CHoCH base
SL: 3315
TP1: 3370 | TP2: 3405 | TP3: 3448
💎 This zone is invisible to retail — perfect trap before spike.
🔴 Sell #1 – 3448–3455
H4 OB at premium
EMA rejection + FVG close
Pre-news stop hunt ideal here
SL: 3462
TP1: 3430 | TP2: 3405 | TP3: 3385
🎯 Don’t short gold randomly — short it here, where retail longs trap themselves.
🔴 Sell #2 – 3488–3495
Last HH OB before ATH
Strong fibo ext confluence
Sweeps = liquidity + exhaustion
SL: 3504
TP1: 3465 | TP2: 3430 | TP3: 3395
If they want to break ATH before Powell, we’ll be waiting above it.
⚙ EMAs in Sync
EMA Signal
21 Tested from below — sell confluence at 3448
50 Lining up near Buy #1
200 Far below — macro still bullish
🧠 Execution Plan
Stay flat before FOMC unless setups trigger with PA confluence
Anticipate whipsaws → SLs must be respected
If price consolidates above 3455 = bullish continuation likely
If it sweeps 3448–3455 and rejects = sell of the week
Drop a 🚀 and follow us: if you’re not trading emotion — you’re trading execution.
📌 Important Notice!!!
The above analysis is for educational purposes only and does not constitute financial advice. Always compare with your plan and wait for confirmation before taking action.

Gold Updates before NY - XAUUSD Tuesday May 6, 2025GOLDMINDSFX | XAUUSD 1H Updated Probable set-ups
Current Price: 3379 | 6 May 2025
Gold plays games. We play levels.
HIGH-PROBABILITY SELL REACTION ZONES (listed lowest to highest)
🔴 3382–3387 ⚠️
Trigger: 5M CHoCH + M-pattern
Note: This is a liquidity tap zone where price may react sharply. Quick reaction expected — not a trend changer.
Confidence: ⚠️ Short-term scalp opportunity with structure rejection
🔴 3404–3410
Trigger: LTF rejection + BOS
Note: Classic reversal zone after sweeping major liquidity. If we reject here, this may offer the best structured sell of the day.
Confidence: Strong structure-based sell zone
🔴 3425–3432 ❄️
Trigger: 1M CHoCH or sweep + engulfing
Note: Final institutional sweep zone above the visible range. If price pushes here without rejection, we wait. If it rejects, this is the sniper zone.
Confidence: ❄️ High-risk, high-reward level — confirmation mandatory
HIGH-PROBABILITY BUY REACTION ZONES (listed lowest to highest)
🟢 3303–3310
Trigger: 5M CHoCH + rejection wick
Note: Clean origin of bullish structure with unmitigated demand. If price returns, this may offer a strong long with confluence.
Confidence: Solid demand zone aligned with structure
🟢 3333–3340 ⚠️
Trigger: 1M CHoCH + wick rejection
Note: Riskier buy zone near premium — only valid with strong confirmation. Can become liquidity before deeper drop.
Confidence: ⚠️ Caution advised — use only with clear LTF reversal signs
FINAL STRATEGY
Sell interest builds heavily between 3382–3432 — structured reactions expected at key levels
Buy interest valid only below 3340 — anything higher is impulsive
No confirmation = no entry — we trade structure, not feelings
📌 Important Notice!!!
The above analysis is for educational purposes only and does not constitute financial advice. Always compare with your plan and wait for confirmation before taking action.

Gold 4H Outlook - XAUUSD May 4th🔍 XAUUSD – H4 Outlook (May 4, 2025)
Trend:
🔻 Bearish structure still intact after the lower high at 3533 (ATH) and CHoCH at 3420.
🔹 Price is now ranging below lower high, with weak demand attempts from 3200–3240 zone.
🔸 Order flow bearish unless major BOS above 3320.
🗝 Key H4 Levels & Confluences
🔵 3195–3220 → H4 Demand + EQ + FVG
🧲 Last strong reaction zone pre-rally
🔁 Untapped OB + minor gap
🔄 EMA21 dynamic support below it
🟣 FIBO 61.8% of swing leg (April move)
🔵 3280–3295 → H4 POI (Supply Flip Zone)
📉 Reaction to this zone previously rejected bullish continuation
🧱 Confluence with 4H OB + minor FVG + EQ
⚠ If broken → clean magnet toward 3320
🔺 3315–3325 → Major LH Zone + Liquidity Magnet
💧 Internal liquidity build-up
🟤 If flipped → could induce bullish CHoCH on HTF
🚨 Final decision zone before possible premium push
🔻 3050–3075 → Weekly OB + H4 FVG
⛔ Major HTF demand below current price
🔄 EMA100 crossover area
🧲 Long-term buy interest if macro risk spikes
⚠ Summary:
Gold remains in a bearish HTF context, but is holding at key demand near 3220.
Rejection from 3280–3295 could reinforce bearish continuation.
Break above 3325 flips structure bullish — until then, sellers still in control.
🙏 Like this breakdown? Boost and follow us for sniper setups all week.
📌 Important Notice!!!
The above analysis is for educational purposes only and does not constitute financial advice. Always compare with your plan and wait for confirmation before taking action.
#XAUUSD #GoldOutlook #SMC #LiquidityHunt #SmartMoneyFlow

Gold Ideas - April 29th, after NEWS - Jolts Job Openings🔥 GoldMindsFX – Intraday Trade Plan (April 29 PM NY)
US JOLTS missed (7.19M vs 7.48M).
Mixed narrative with CB Consumer Confidence = high probability of NY whipsaws, liquidity games, and no clean trend.
PA still trapped in a Monday Range prison between 3280–3350. Boss fight still pending.
🟥 SELL ZONES
Sell Zone 1: 3317–3330
🔸 Previous NY reaction high + last upside liquidity sweep
🔸 Confluences: EQ retest, M15 FVG, weak internal BOS
📍 Entry only on LTF bearish rejection
🔻 SL: Above 3332
🎯 TP1: 3306
🎯 TP2: 3288
🎯 TP3: 3265
⚠️ Risk: If 3330 breaks impulsively, step aside
Sell Zone 2: 3350–3360
🔸 Major HTF rejection zone
🔸 Psychological sell trigger
📍 Entry after M15/M5 confirmation (CHoCH + engulfing preferred)
🔻 SL: Above 3363
🎯 TP1: 3317
🎯 TP2: 3288
🎯 TP3: 3260
✅ Confidence: Very high — but price may not reach it today
🟩 BUY ZONES
Buy Zone 1: 3280–3288
🔸 Protected Asia/NY lows
🔸 Previous demand sweep zone + micro bullish CHoCH
🔸 Strong bounce history
📍 Look for M5/MS flip + OB/FVG combo
🛡️ SL: Below 3275
🎯 TP1: 3306
🎯 TP2: 3317
🎯 TP3: 3330
⚠️ Risk: Rejection from 3306 must be watched for trap spike
Buy Zone 2: 3260–3265
🔸 Deep liquidity grab zone
🔸 Untapped OB + M15 imbalance
🔸 Full sweep of Asia and NY structural lows
📍 Enter on M1–M5 confirmation (mini CHoCH + FVG)
🛡️ SL: Below 3254
🎯 TP1: 3288
🎯 TP2: 3306
🎯 TP3: 3317
❄️ Patience required — only active if NY dumps hard
📌 Important Notice!!!
The above analysis is for educational purposes only and does not constitute financial advice. Always compare with your plan and wait for confirmation before taking action.
🖊️ If these insights help you refine your trading plans, give us a boost and follow GoldMindsFX on TradingView. Let's grow together! 🛡️

Gold Ideas - XAUUSD Weekly Outlook | April 28, 2025🧠 Quick Outlook:
Gold remains locked in a corrective range after its aggressive rally to new all-time highs.
Price is currently consolidating between major liquidity zones, preparing for its next big move.
However, growing geopolitical risks — including rising Middle East tensions and potential currency interventions out of Japan — could trigger safe-haven flows, especially during Asia session volatility.
While the high timeframe structure remains bullish above the 3220–3235 pivot,
the immediate tactical focus is on the 3340–3365 zone, where key liquidity battles are unfolding.
🔥 Major Zones to Watch:
Resistance 3380–3395 Major supply and flip zone — strong liquidity cluster
Resistance 3350–3360 Minor local resistance — potential bull trap area
Support 3260–3280 Critical intraday support and liquidity pocket
Support 3220–3235 Last pivot standing to maintain bullish structure
⭐Tactical Focus This Week:
🎯 Will Gold reject or conquer the 3380–3395 stronghold?
🎯 Will 3350–3360 act as a stepping stone or a snare for early buyers?
🎯 Are buyers prepared to defend the 3260–3280 liquidity pocket with real force?
🎯 What happens if 3220 collapses?
Patience and sniper discipline will make the difference this week, as Gold approaches critical decision points and major news.
📌 Important Notice!!!
The above analysis is for educational purposes only and does not constitute financial advice. Always compare with your plan and wait for confirmation before taking action.
🖊️ If these insights help you refine your trading plans, give us a boost and follow GoldMindsFX on TradingView. Let's grow together! 🛡️

Gold Ideas 1H Market Analysis - Easter Monday 21st of April✅ XAUUSD – 1H Market Analysis (April 21, 2025 – NY Open Prep)
🕊️ Market Reminder:
It’s Easter Monday, and London + German markets are closed, so price may behave oddly due to lower European liquidity. NY might be more manipulative — expect traps, not clean momentum.
🧠 Current Market Context
Price is holding firm at new ATH: 3397
We’ve entered the "danger zone" — structure is still bullish but we’re deep in premium
No bearish CHoCH on 1H — but momentum is slowing down visibly
Clean higher lows since April 17 low (around 3284), all protected so far
🔺 Zones ABOVE Price (Premium Trap Zones)
🔺 Zone Range Notes
🟥 Premium Liquidity 3405–3414 Prior ATH + fib extension + ADR high – ideal NY fakeout zone
🔻 Spike Risk Zone 3425–3445 Overextended 1.272–1.414 fibs – only in case of news/fake rally
⚠️ Exhaustion Layer 3455–3470 Extension of fib projection (1.618 zone) – major trap risk if touched
🟢 Zones BELOW Price (Discount Value Areas)
🟢 Zone Range Notes
💧 Minor Imbalance 3373–3380 Quick scalp retrace area – only valid on clean rejection wick or M5 OB
⚙️ Intraday Balance 3350–3360 Great sniper re-entry zone – clean imbalance + OB overlap – 💥 HOT ZONE
🟩 Demand Base 3325–3305 Deep value OB + macro continuation zone – long setup if we fully retrace
🧱 Institutional Support 3284–3288 Clean CHoCH origin – trend-defining demand, invalidation if broken
📍 Structure Summary
1H still bullish, no bearish BOS
ADR is almost maxed out, so NY might trap above 3400 and then sweep lower
No fair retrace since 3360 breakout — buyers are sitting below, not above
Major liquidity pools now exist both above 3410 and below 3350
🔥 Bias:
Cautiously bullish, but we’re due for a shakeout.
🔻 If NY pumps into 3410–3425 and fails → fade it.
🟢 If price returns to 3350–3360 → sniper buy zone.
📉 No blind trades today. Let price trap first.
📌 Important Notice!!!
The above analysis is for educational purposes only and does not constitute financial advice. Always compare with your plan and wait for confirmation before taking action.

Gold Ideas ahead of CPI on April 10thCurrently, Gold is at 3082, with a mix of uncertainty ahead of tomorrow's CPI release. The market is in a wait-and-see mode as traders position ahead of the data, which could drive volatility. With the macro context in mind, we’ll be focusing on key support and resistance levels, aiming to capture price action based on SMC &more.
🔻 Sell Zone #1 – Intraday Fade
📍 Sell (confirmation only): 3,095 – 3,108
📉 SL: 3,110
🎯 TP1: 3,080
🎯 TP2: 3,060
🎯 TP3: 3,040
⚠️ Tip: Move SL to breakeven when TP1 hits fast
🔺 Sell Zone #2 – Double Tap and Dump
📍 Entry: 3,125 – 3,139 (Ideal: 3,135 – 3,139)
📉 SL: 3,145
🎯 TP1: 3,105
🎯 TP2: 3,080
🎯 TP3: 3,055
⚠️ Tip: Use only with clear rejection (M5/M15 M-pattern or bearish engulfing)
🟢 Buy Scenario 1 – “Reclaim Retest”
📍 Entry: 3,066 – 3,068.50
📉 SL: 3,062
🎯 TP1: 3,089
🎯 TP2: 3,113
🎯 TP3: 3,127
🧠 Trigger: M1/M5 CHoCH or Bullish Engulfing
📌 Confluence: M5 Order Block + Fair Value Gap (Discount Zone)
🟩 Buy Zone – Deep Value Pullback (Fresh Setup)
📍 Entry: 3,035 – 3,040
📉 SL: 3,025
🎯 TP1: 3,080
🎯 TP2: 3,095
🎯 TP3: 3,110
⚠️ Tip: Wait for strong bullish reaction (M5/M15)
📌 Important Notice!!!
The above analysis is for educational purposes only and does not constitute financial advice. Always compare with your plan and wait for confirmation before taking action.
📣 If this strategy sparked clarity, hit that like button and follow. 💛

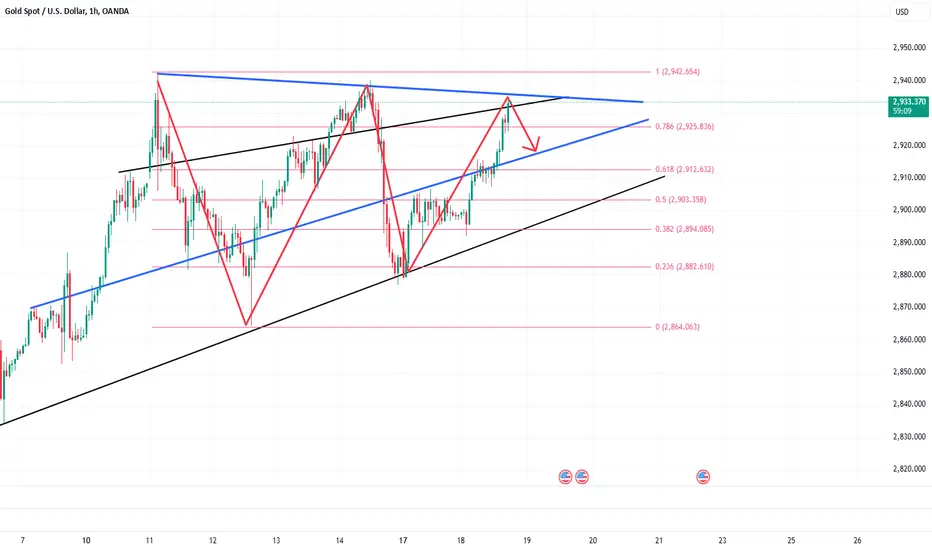
Gold is about to plummet, double short gold!Brothers, gold accelerated to around 2985, but it could not cross 2990. The closer it is to the 3000 mark, the greater the resistance it faces. After the news is digested by the market to a certain extent, it is difficult for gold to have enough momentum to continue to break through the 2990-3000 market psychological mark in the short term, so a retracement will inevitably follow!
The accelerated squeeze of gold has been separated from the technical side. After the news returns to normal, gold will inevitably have a technical retracement demand, so we can boldly short gold again in the 2985-2990 area! Tomorrow, Friday, will definitely be a turning point. Gold will at least retrace to the 2950-2940 zone tomorrow, and may even extend to the area around 2935.
So in short-term trading, I still insist on using double trading lots to short gold at 2985-2990! Looking forward to making a profit of 400-500 pips in the short term!Trading means that everything has results and everything has feedback. I have been committed to market trading and trading strategy sharing, striving to improve the winning rate of trading and maximize profits. If you want to copy trading signals to make a profit, or master independent trading skills and thinking, you can follow the channel at the bottom of the article to copy trading strategies and signals

Gold is about to take off like a rocket, boldly go long gold!Bros, don't have any doubts about the rise of gold. Gold is just accumulating upward momentum during the shock process. Once the shock ends, gold will take off like a rocket.
In the short term, gold has tested the support of the 2900-2890 area many times and has never fallen below, confirming that the support in this area is effective. In addition, the candle chart forms multiple long lower shadows in the short period, indicating that the gold price refuses to fall, which will attract more off-market funds to buy gold. In this market, the longer the gold shock time, the higher the increase, so please relax and let us look forward to the gold rocket taking off! The first target in the short term is 2920. Once gold stands above 2920, gold is bound to reach 2930, and it is even expected to continue to rise to 2955
Trading means that everything has results and everything has feedback. I have been committed to market trading and trading strategy sharing, striving to improve the winning rate of trading and maximize profits. If you want to copy trading signals to make a profit, or master independent trading skills and thinking, you can follow the channel at the bottom of the article to copy trading strategies and signals

Buy gold and wait for a breakoutBros, the recent rise and fall of gold has not continued, and the overall price is still fluctuating widely in the 2930-2895 area. After the fierce game between the long and short sides, there is not enough momentum to support the structural breakthrough of gold. However, according to the current structural trend, gold has repeatedly tested the area around 2920-2930 and has been effectively supported at 2890-2900. Overall, the probability of gold breaking upward is greater.
Then in short-term trading, we can temporarily go long on gold in the 2905-2985 area, and first see whether gold can stand above 2920. If gold stands above 2920 for a long time, then gold will definitely break through 2930 and still have the opportunity to test the previous high area near 2955.
Trading means that everything has results and everything has feedback. I have been committed to market trading and trading strategy sharing, striving to improve the winning rate of trading and maximize profits. If you want to copy trading signals to make a profit, or master independent trading skills and thinking, you can follow the channel at the bottom of the article to copy trading strategies and signals

XAUUSD and USDJPY Top-down analysisHello traders, this is a complete multiple timeframe analysis of this pair. We see could find significant trading opportunities as per analysis upon price action confirmation we may take this trade. Smash the like button if you find value in this analysis and drop a comment if you have any questions or let me know which pair to cover in my next analysis.

Continue to short goldBros, gold is currently continuing to rebound to around 2892. This wave of rebound is really unexpected. It was originally expected that gold would fall back after rebounding to around 2890. Unexpectedly, gold broke through the 2890 mark after a slight pause.
Fortunately, gold was not strong during its breakthrough, indicating that the sustainability of gold's rebound remains to be examined, and the 2900-2910 zone above poses structural resistance to gold in the short term. I predict that gold will fall back again before it can even touch 2900, so I am still optimistic about gold's retracement in the short term.
Now I have shorted gold. Although I have a slight loss now, I am not worried about my short position. If gold cannot continue and break through the 2900-2910 zone in one fell swoop, gold will also retest the 2875-2865 support zone.
Bros, profits are the ultimate goal in trading. Accumulating profits is what changes lives and destinies. Choosing wisely is far more important than just working hard. If you want to replicate trade signals and earn stable profits, or if you want to deeply learn the correct trading logic and techniques, you can consider joining the channel at the bottom of this article!

Gold is expected to continue to reach new highs of 2970-2980Dear Traders,
Although gold has slightly retreated after touching around 2948, it is still holding above the 2935-2930 region, maintaining a strong bullish trend.
Based on the current gold structure, gold has repeatedly failed to break the 2920-2925 support zone during its pullback, and has not formed a sustained downtrend. On one hand, this reflects strong buying support at lower levels; on the other hand, the pullback space is limited. Therefore, before any trend reversal, gold is likely to have another rally to test new highs. I expect that if gold manages to hold above the 2950-2955 region in this rally, it will likely attempt to reach the 2970-2980 zone.
So, for short-term trading, leading into Thursday and Friday, we should primarily focus on going long on gold, with key support around the 2940-2930 region. If gold reaches the 2970-2980 region, we can then consider shorting it.
Bros, are you optimistic about gold continuing to hit new highs? Do you know how to grasp the trading rhythm? If you want to learn more detailed trading ideas and get more trading signals, you can choose to join the channel at the bottom of the article to make trading no longer difficult and make making money a pleasure!

What to do if you hold a short position?Dear Traders,
Gold has continued its upward movement, supported by strong buying interest, pushing above 2930, with bullish momentum regaining control. However, at this stage, I do not believe it is wise to chase further long positions in gold.
I am currently still holding short positions in gold, and despite its apparent strength, I am not concerned about my short positions. This is because gold is once again facing resistance at previous highs, and according to the trendline, the 2936-2940 region remains a key resistance zone. Therefore, it is likely that gold will pull back upon reaching this zone and test support in the 2915-2910 region.
In terms of short-term trading, I will continue to short gold in batches above 2930, using the 2936-2940 resistance zone, and expect a retracement towards the 2915 area.
Bros, do you have the courage to short gold with me? If you want to learn more detailed trading ideas and get more trading signals, you can choose to join the channel at the bottom of the article to make trading no longer difficult and make making money a pleasure!
Continue to hold long positions, target: 2670-2680Bros, as I mentioned in my previous article, gold remains in a clear bullish structure. The recent short-term pullback is merely a consolidation phase to accumulate bullish momentum for further upside. As anticipated, gold retraced to the 2650-2640 zone, reaching a low of around 2650 before rebounding. Currently, gold has recovered to approximately 2658.
In line with my trading strategy, I have already entered long positions on gold. Although I went long slightly earlier at around 2651, it is clear that gold has rebounded as expected, and our long positions are now profitable! Based on the step-like structure of gold's upward trend, there is still potential for gold to continue rising to the 2670-2680 region. Let’s hold on to our long positions and look forward to achieving even greater profits!
Bros, have you followed me to do long gold? If you want to learn more detailed trading ideas and get more trading signals, you can choose to join the channel at the bottom of the article to make trading no longer difficult and make making money a pleasure!

XAUUSD Possible bounce to resistance line!XAUUSD has created a strong up trending market structure on the lower timeframe. Weekly price action just has got bounce we may see the price bouncing back to the upside to the weekly liquidity zone at 2651.06. As of on 1 hour timeframe the price already has created smooth uptrend, price may continue to rise in the upcoming sessions.

Continue to buy goldAs I mentioned in my last article, gold will continue to rise. We went long on gold near 2662 in the last transaction and closed the transaction by hitting TP: 2676 for profit, easily earning 140 Pips, a very successful transaction!
At present, gold has risen to a maximum of around 2679, breaking yesterday's high in one fell swoop. The hourly level M top suppression has been ineffective, and the rising pattern remains intact. At present, gold still has the momentum and space to continue rising, so gold may still rise or even try to touch around 2690. , then we can just follow the trend and go long gold in trading.
Of course, we can't chase gold directly, but because gold has a small retracement space during the rise, we can't expect too much retracement before going long on gold, and the short-term support area has moved up to the 2670-2660 area, so we can go long on gold based on this support area.
Bros, do you continue to be bullish on gold with me? If you want to learn more detailed trading ideas and get more trading signals, you can choose to join the channel at the bottom of the article to make trading no longer difficult and make making money a pleasure!

First short gold, then go long gold!Bros, this week's new trading journey begins from now!
Gold rebounded again under the support of safe-haven buying, and now it has reached around 2658. To be honest, gold is currently in a relatively obvious upward arrangement, and there is still room for gold to continue to rise.
However, overall, gold has not yet escaped the scope of shocks, so it is not good to directly chase gold near 2658, and the current strength of gold's rise is not firm. Gold needs to fall back to increase the liquidity of gold bulls, so we might as well consider trying to short gold with 2660-2670 as resistance, and wait for gold to fall back to the appropriate area before participating in long gold!
Bros, let's try to short gold first, and then wait patiently for gold to fall back before re-participating in long gold!If you want to learn more detailed trading ideas and get more trading signals, you can choose to join the channel at the bottom of the article to make trading no longer difficult and make making money a pleasure!

XAU/USD 29 November 2024 Intraday AnalysisH4 Analysis:
-> Swing: Bearish.
-> Internal: Bullish.
Bias/analysis remains the same as analysis dated 25 November 2024.
Price Action Analysis:
As mentioned in yesterday's analysis dated 24 November 2024, whereby price was expected to print a bearish CHoCH. This is how price printed.
Currently, price is trading within an established internal range.
Intraday Expectation:
Price is anticipated to trade down to either discount of internal 50% EQ, which is marked in blue, or H4 demand zone before targeting weak internal high priced at 2,721.420.
Note:
With the Federal Reserve's dovish stance and persisting geopolitical uncertainties, heightened volatility in Gold is expected to continue. Traders should proceed with caution and adjust risk management strategies in this high-volatility environment.
H4 Chart:
M15 Analysis:
-> Swing: Bearish.
-> Internal: Bearish.
Today's analysis and bias will remain the same as analysis dated 26 November 2024.
Price Action Analysis:
Intraday expectation and analysis dated 25 November 2024 printed as anticipated, with price successfully printing a bearish iBOS after targeting the weak internal low.
A correction from yesterday's intraday expectation: instead of targeting the weak internal high, price was expected to target the weak internal low.
Price has since printed a bullish CHoCH, indicating, but not confirming, bullish pullback phase. We are now trading within an established internal range.
Intraday Expectation:
Price is anticipated to trade up to either the internal 50% EQ or the M15 supply zone before targeting the weak internal low at 2,605.310.
Alternative Scenario:
The H4 timeframe has printed a bearish CHoCH, indicating the initiation of a bearish pullback phase coupled with the fact that H4 TF is now trading in discount of internal 50%. However, this suggests that bearish momentum on M15 may face limitations as the broader H4 phase unfolds.
Note:
Given the Federal Reserve's dovish stance and persistent geopolitical tensions, volatility in Gold prices is likely to remain elevated. Traders should remain cautious and prepared for potential price whipsaws in this high-volatility environment.
M15 Chart:

Gold remains around $2,675-$2,670 due to a stronger USD.Gold (XAU/USD) stays around $2,672-$2,670 as trading opens in Europe on Monday, continuing its recent downtrend from the October 31 record high. The USD remains slightly below last week's 4-month peak, driven by optimism over Trump’s economic policies, which are pressuring gold for the second consecutive day.
Investors expect Trump’s policies to boost growth and inflation while limiting strong Fed easing, keeping US Treasury yields high and pushing funds away from non-yielding gold. However, a mild risk sentiment may support gold as traders await US inflation data and Fed Chair Powell’s speech later this week.
Personal opinion:
A sell-off below last week's low around $2,643 could trigger further downside, potentially pushing gold towards the October range low at $2,605-$2,602. However, a rebound above $2,700 faces strong resistance near $2,718 and the $2,740-$2,745 zone. A break above these levels could signal the end of the correction and push gold towards $2,750 and the $2,758-$2,790 range, or even the record high from October 31.
Pay attention to the price range:
Buy Zone: 2656 - 2654
SL: 2649
Buy Zone: 2666 - 2664
SL: 2659
Sell Zone: 2687 - 2689
SL: 2694
