7/1 Gold Analysis and PMI Data Trading StrategyGood afternoon, everyone!
Gold has now entered a resistance zone, and on the 30-minute chart, a technical correction appears likely. This correction typically takes one of two forms:
A direct pullback from current levels;
A minor upward push before the pullback, intensifying the need for correction.
In most cases, the second scenario doesn’t result in a large move—unless it’s accompanied by strong news. Given this setup, today’s trading idea is to:
Start with a small short position near current resistance;
Add to the position if price pushes slightly higher, and patiently wait for a pullback. This strategy has shown over 80% historical success rate.
Key support levels to watch:
If the price rises before pulling back: 3321–3316
If the price drops directly: 3313–3306
On the 4-hour chart, the rebound is not yet complete, so if the pullback finds solid support, there’s still room for buy-side setups in line with the short-term trend.
⚠️ Important: U.S. PMI data will be released during the New York session. Strategy depends on pre-release price positioning:
If price remains below 3312, and the data is bullish → look for long setups.
If price is above 3323, wait for a post-data rally to sell into.
If the data is bearish → consider selling immediately.
Stay flexible, manage your positions wisely, and trade with discipline ahead of the U.S. session.
Xauusdlong

Gold price recovers above 3300⭐️GOLDEN INFORMATION:
Gold (XAU/USD) trades at $3,292 after rebounding from an intraday low of $3,246 and looks set to close out June with a modest gain of over 0.18%. However, its upward momentum has been restrained by easing geopolitical tensions in the Middle East and growing optimism over forthcoming trade agreements. Meanwhile, analysts at Citi expect Gold to consolidate within the $3,100 to $3,500 range throughout the third quarter.
In Washington, US Treasury Secretary Scott Bessent expressed confidence that the “One Big Beautiful Bill” will make progress in the coming hours. The sweeping tax reform legislation, which narrowly passed the Senate over the weekend, includes major tax deductions funded by reductions in Medicaid spending and green energy incentives.
⭐️Personal comments NOVA:
Gold price recovers above 3300 , ahead of NF reports this week . Accumulates above 3300
⭐️SET UP GOLD PRICE:
🔥SELL GOLD zone: 3353- 3355 SL 3360
TP1: $3340
TP2: $3330
TP3: $3320
🔥BUY GOLD zone: $3272-$3270 SL $3265
TP1: $3283
TP2: $3295
TP3: $3310
⭐️Technical analysis:
Based on technical indicators EMA 34, EMA89 and support resistance areas to set up a reasonable BUY order.
⭐️NOTE:
Note: Nova wishes traders to manage their capital well
- take the number of lots that match your capital
- Takeprofit equal to 4-6% of capital account
- Stoplose equal to 2-3% of capital account

The latest analysis and layout of gold in July made a good start📰 News information:
1. Geopolitical situation
2. PMI data
📈 Technical Analysis:
Yesterday, we gave the idea of looking at the upper resistance of 3310-3320. The 4H pressure is still at 3327. As long as this key resistance level is not effectively broken, gold will fall again. On the contrary, if it stabilizes above 3327, the trend may reverse. In the short term, pay attention to the upper resistance of 3327. If it is not broken, you can short with a light position. If it falls below 3300-3290, consider going long.
🎯 Trading Points:
SELL 3310-3320
TP 3305-3300
BUY 3300-3290
TP 3310-3320-3350
In addition to investment, life also includes poetry, distant places, and Allen. Facing the market is actually facing yourself, correcting your shortcomings, confronting your mistakes, and strictly disciplining yourself. I hope my analysis can help you🌐.
TVC:GOLD FXOPEN:XAUUSD PEPPERSTONE:XAUUSD FOREXCOM:XAUUSD OANDA:XAUUSD TVC:GOLD

The limit is 3320. Rebound and still short📰 News information:
1. Gold market liquidity at the end of the month
2. Impact of geopolitical situation
📈 Technical Analysis:
Currently, gold has rebounded to around 3295, reaching our ideal trading area. I have given the short-selling trading idea in the previous post. At present, in the short term, we still maintain the short-selling trading idea before effectively breaking through the upper resistance. Focus on the 3325 line of resistance
🎯 Trading Points:
SELL 3295-3310-3320
TP 3285-3270
In addition to investment, life also includes poetry, distant places, and Allen. Facing the market is actually facing yourself, correcting your shortcomings, confronting your mistakes, and strictly disciplining yourself. I hope my analysis can help you🌐.
OANDA:XAUUSD FOREXCOM:XAUUSD FX:XAUUSD PEPPERSTONE:XAUUSD FXOPEN:XAUUSD TVC:GOLD

Exclusive operation suggestions for future market trends!!!Gold bottomed out and rebounded on Monday, so wait patiently for room for future gains. Technically, from the current hourly chart, the gold entity has always been above 3278, and it only pierced through 3275 and then began to rebound. If the retracement does not break the 618 position, there will inevitably be a high point in the future. So next, we should focus on the vicinity of 3280. If gold always closes above 3280, then the high point of 3297 on Monday is likely to be refreshed. Secondly, from the perspective of 123 seeking 4, if it goes up again, it is very likely to touch around 3310. 3310 is exactly around 618. And it is also the top position of this hourly chart range. Therefore, gold should be shorted above 3280 with caution, and the probability of touching above 3300 is very high. In terms of operation, it is recommended to directly enter the market to go long near 3280, and look at 3310-3320. If you want to short, you must wait at least for 3310-3320 before you can enter the market to short once.

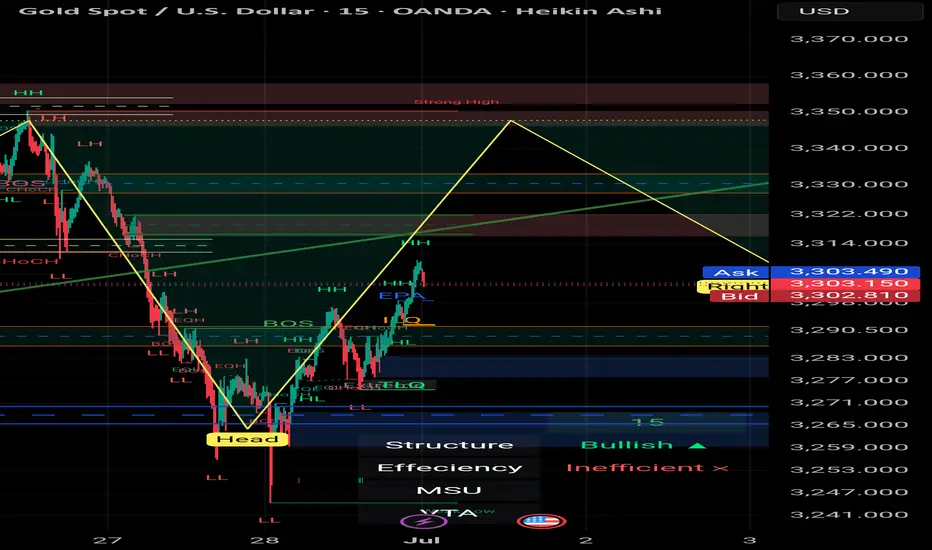
Gold Market Outlook – 1st of July | XAU/USD | 30min | by Mohsen # Gold Market Outlook – 1st of July | XAU/USD | 30min | by Mohsen Mozafari Nejad
🔸 **Instrument:** Gold Spot / USD (XAU/USD)
🔸 **Timeframe:** 30min
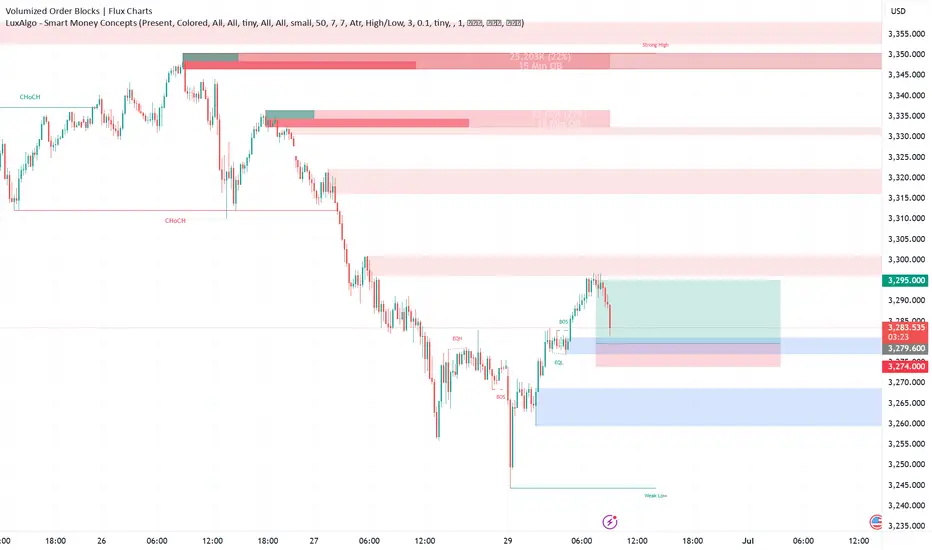
🔸 **Methodology:** Smart Money Concepts (SMC) + Liquidity + OB + Market Structure
🔸 **Focus:** New Monthly Open Setup
---
## 🔍 Market Context:
- **Structure:** Bullish on LTF (MSU)
- **Efficiency:** ✅ Clean & Efficient Delivery
- **Recent Activity:** Reverse H&S completed + double BOS + CHoCH confirmed
- **Price Level:** Trading near key Supply zone (3300–3315)
- **Monthly Context:** July begins with bullish momentum & previous session showed aggressive buy-side pressure
---
## 🧠 Technical Breakdown:
1. **Strong recovery** after clearing deep liquidity sweep (Head zone)
2. **Bullish BOS** structure confirmed on LTF → Multiple HH and HL formed
3. Price now testing **Key Supply/OB zone at 3300–3315**
4. Above this zone lies a **Strong High (SH) around 3,350**, a potential liquidity magnet
5. Overall bias is bullish unless strong rejection appears from upper OB
---
## 📌 Trade Plan:
| Position | Entry Confirmation Zone | Stop Loss (SL) | Take Profit (TP) |
|----------|--------------------------|----------------|------------------|
| Long | Above 3,303–3,310 (structure hold) | Below 3,294 | TP1: 3,325 / TP2: 3,340 / TP3: 3,348 |
| Short (scalp only) | Bearish reaction from 3,345–3,350 | Above 3,353 | TP1: 3,310 / TP2: 3,290 |
---
## ⚠️ Risk Factors to Watch:
- 🔺 High-impact USD news (July 1st releases: Manufacturing PMI / employment preview)
- 🔺 Overextension above supply zone without support → trap risk
- 🔺 Bull trap risk if price spikes above 3,340 then sharply reverses
---
## ✅ Summary:
> **Start of July** could fuel volatility and directional momentum.
> The structure is clearly bullish short-term, but upper liquidity zones remain **highly reactive**.
> Smart traders will wait for reaction at the 3,340–3,350 SH zone before overcommitting.
**Structure:** 🟢 Bullish
**Trend:** 📈 MSU
**Efficiency:** ✅ Clean
**Liquidity:** 🔺 Above SH & Below recent HL
---
📊 Prepared by: **Mohsen Mozafari Nejad**
GOLD Breakout Done Let`s Buy It To Get Clear 200 Pips !Here is my opinion on 30 mins T.F , We have a very good bullish price action and we have a very good breakout with amazing bullish candle and now the price back to retest the breakout area , it`s my fav place to enter a buy trade and the price can move 200 Pips easy , i`m waiting for retest and good bullish price action to enter a buy trade .

Gold Is Set to Bottom Out and Rebound This WeekGood morning, everyone!
At today’s open, gold once again dipped into the 3258–3248 buy zone, then rebounded toward 3270. From a structural perspective, gold has clearly entered a downward trend, but this decline is unlikely to be one-directional—short-term rebounds and consolidations are expected along the way.
Based on my experience, below 3250 remains a favorable area for initiating long positions. Whether the price rebounds directly or continues lower before building a stronger base to challenge 3300 again, the broader outlook remains bullish as long as the 3200 support holds. A bottoming reversal this week is still the more probable scenario.
As such, the focus early this week should be on buying near the lows, with short opportunities on rebounds as a secondary strategy. Monitor key support levels for signs of strength.
This week is also packed with important data—including PMI, Non-Farm Payrolls (NFP), and the unemployment rate, in addition to regular economic releases. Given the current macroeconomic backdrop, significant market volatility is expected—bringing both risk and opportunity. Manage your exposure carefully and stay adaptable.

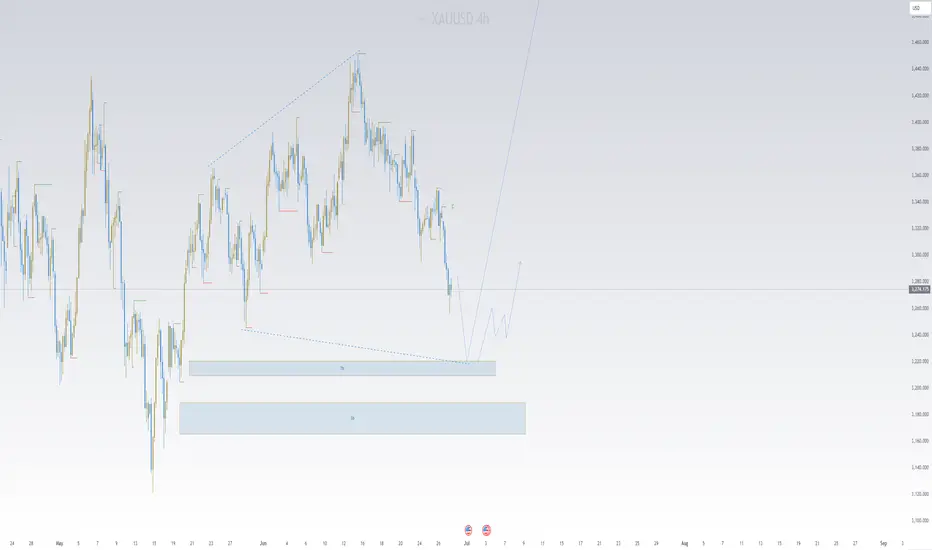
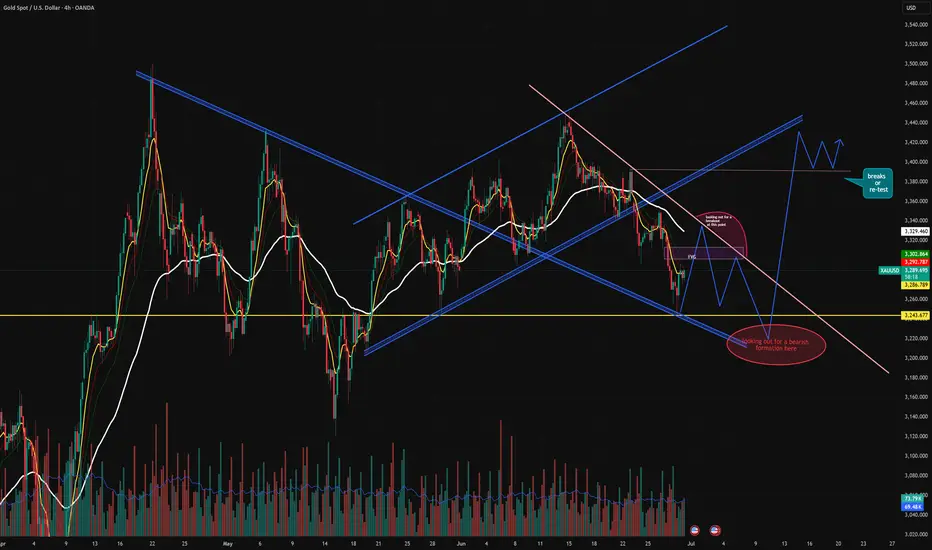
XAUUSD 4H Analysis:= Key Levels, FVG Reaction & Structure projec🔔 XAUUSD 4H Analysis – Key Levels, FVG Reaction & Structure Projections
Gold is currently trading within a complex structure after breaking down from a rising parallel channel and is now testing confluence zones that could dictate the next major move.
📈 Scenarios:
🔺 Bullish Path: Clean breakout and retest above the FVG zone and descending trendline → price could re-enter the previous rising channel targeting 3,400+.
🔻 Bearish Path: Rejection from the FVG & trendline → look for lower highs to form → continuation toward 3,243 key support and possibly beyond.
If support breaks below $3,246, the next level of interest lies near $3,200 psychological round number.
📌 Conclusion:
We’re in a decision zone. The next move depends on how price behaves around the FVG and trendline resistance. Patience and confirmation will be key — breakout traders and mean reversion traders both have defined setups ahead.
#this is not a buy sell advice.
#just a view
#apologies and credit if someone has already seen and posted this.
XAUUSD – June 30, 2025: Trade Strategy Right Now – Focus on SellGold OANDA:XAUUSD has been recovering slightly toward the 3,282 USD zone, but macroeconomic headwinds remain strong:
- The U.S. Dollar Index (DXY) TVC:DXY remains above 106.3 – the highest level in a month – making gold less attractive due to increased opportunity cost.
- U.S. 10-year Treasury yields remain firm around 4.35%, reflecting market expectations that the Fed will maintain tight monetary policy.
- Core PCE data for June remains elevated, far from the Fed's 2% target – lowering the likelihood of a rate cut anytime soon.
- Geopolitical tensions are cooling off, reducing demand for safe-haven assets like gold.
➡ These macro factors suggest that the current rebound in gold is more technical than fundamental, and unlikely to signal a major trend reversal.
1. Technical Analysis – XAUUSD OANDA:XAUUSD on D1 Timeframe
- After bouncing from 3,255 USD, price is now testing the 3,285 – 3,295 USD resistance zone.
- This is a Fibonacci retracement zone (0.5 – 0.618) from the previous bearish leg 3,314 → 3,255.
- EMA20 and EMA50 remain downward-sloping, signaling that the dominant trend is still bearish.
- RSI is hovering around 52, suggesting mild momentum but not enough for a confirmed bullish reversal.
➡ The current price behavior aligns with a pullback within a downtrend, with potential for continuation to the downside.
2. Trade Setup – Short-Term Sell Strategy
Primary Setup: Sell the Rally
Entry: Sell near 3,294 – 3,295
Stop Loss: 3,300
Take Profit 1: 3,260
Take Profit 2: 3,244
Take Profit 3: 3,225
Ps: Gold OANDA:XAUUSD is showing signs of a technical bounce, but fundamentals and structure still support the downtrend. Selling at resistance remains the preferred strategy as long as macro pressure persists.
The strategy will be updated continuously – don't forget to save and follow to avoid missing key opportunities.
Analysis by @Henrybillion

Bulls recover in new week, gold price returns to 3300⭐️GOLDEN INFORMATION:
Gold prices (XAU/USD) regained some lost ground during Monday’s Asian session, buoyed by growing expectations that the US Federal Reserve may implement more interest rate cuts this year—and potentially sooner than previously anticipated. Such prospects weigh on the US Dollar, making the dollar-denominated metal more attractive to overseas buyers.
However, the recent improvement in global risk sentiment—driven by the US-China trade accord and a ceasefire agreement between Israel and Iran—could reduce demand for Gold’s safe-haven appeal. Investors now turn their attention to upcoming comments from Federal Reserve officials, with speeches from Atlanta Fed President Raphael Bostic and Chicago Fed President Austan Goolsbee expected later in the day.
⭐️Personal comments NOVA:
Gold price recovered, accumulating at the beginning of the new week around the price range of 3300. Still in the main downtrend.
⭐️SET UP GOLD PRICE:
🔥SELL GOLD zone: 3316- 3318 SL 3323
TP1: $3305
TP2: $3290
TP3: $3277
🔥BUY GOLD zone: $3248-$3246 SL $3241
TP1: $3258
TP2: $3270
TP3: $3286
⭐️Technical analysis:
Based on technical indicators EMA 34, EMA89 and support resistance areas to set up a reasonable BUY order.
⭐️NOTE:
Note: Nova wishes traders to manage their capital well
- take the number of lots that match your capital
- Takeprofit equal to 4-6% of capital account
- Stoplose equal to 2-3% of capital account

Analysis and layout of gold trend at the end of the month📰 News information:
1. Gold market liquidity at the end of the month
2. Impact of geopolitical situation
📈 Technical Analysis:
From the beginning of the decline of gold near 3338 on Friday to today's lowest point near 3244, gold has fallen by nearly $94. At present, gold has rebounded as expected. In the short term, I think we have two key areas to pay attention to. The first is the position of 3290-3295, which is a 50% rebound, and the second is the upper top range limit range of 3300-3320. Of course, if it breaks through 3280 and then retreats, it can also be long twice, but the current price rebounds, considering the position of the temporary low long position, there is not much trading opportunity. First look at the key areas given to find opportunities for shorting, and pay attention to the opportunity of retreating to 3280-3270 below.
🎯 Trading Points:
SELL 3290-3295
TP 3380-3370
SELL 3300-3310-3320
TP 3290-3280-3270
BUY 3270-3260
TP 3290-3300
In addition to investment, life also includes poetry, distant places, and Allen. Facing the market is actually facing yourself, correcting your shortcomings, confronting your mistakes, and strictly disciplining yourself. I hope my analysis can help you🌐.
OANDA:XAUUSD FOREXCOM:XAUUSD FX:XAUUSD PEPPERSTONE:XAUUSD FXOPEN:XAUUSD TVC:GOLD

#GOLD buy limit in M5we will buy GOLD @ 3278.60 with the small SL @3274.00
target is 3285 and 3295
we will see
The rebound short-selling trend remains unchangedFrom the 4-hour analysis, the upper short-term resistance is around 3297-3301, and the pressure at 3315-3316 is paid attention to. The pressure at 3324 is focused on. In terms of operation, the rebound continues to be the main short and the trend is downward. The short-term support below is around 3250-3255. The overall main tone of high-altitude participation remains unchanged relying on this range.

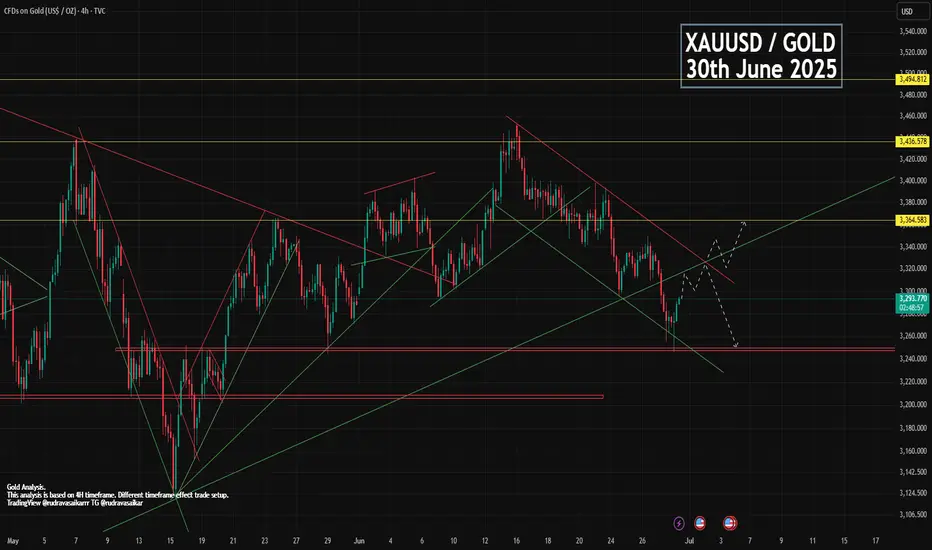
GOLD 30th JUNE - MONTH-END BULLISH OR BEARISHDue to war no update on gold, gold made bolt move downward. Slowly war has been becoming calm but no good news about it has been stopped completely. But you can see some great and correct structure in gold chart where you can find amazing entry and exit points. Gold lower was 1246 since then. Now gold is trading in bullish flag and expecting to breakout. And after breakout we can expect a big move upward.
Key point.
Support - 3248, 3272, 3289
Resistance - 3298, 3313, 3332, 3349
Comment and like for analysis. Love it then follow
Any Query Reach Us or comment down.
Follow for more updates.
Rudra Vasaikar Wishes You A Great And Very Amazing Trading Life. Trade Safe, Trade Right.
RISK WARNING 🔴 🔴 🔴
There is high risk of loss in Trading Forex, Crypto, Indices, CFDs, Features and Stocks. Choose your trade wisely and confidently, please see if such trading is appropriate for you or not. Past performance is not indicative of future results. Highly recommended - Information provided by Rudra Vasaikar/Pro Trading Point are for Educational purpose only. Do your investment according to your own risk. Any type of loss is not our responsibility.
HAPPY TRADING.
"The Great Gold Heist" – XAU/USD Master Plan🏆 "The Great Gold Heist" – XAU/USD Master Plan (High-Risk, High-Reward Loot!) 🚨💰
🌟 Attention, Market Robbers & Money Makers! 🌟
Hola! Oi! Bonjour! Hallo! Marhaba! 🤑💸
🔥 Based on the legendary Thief Trading Strategy (technical + fundamental heist tactics), here’s our blueprint to STEAL massive profits from the XAU/USD (Gold vs. Dollar) market! 🔥
🎯 The Heist Plan (Long Entry Setup)
Entry Point 📈: *"The vault is UNLOCKED! Swipe bullish loot at any price—but for a cleaner steal, set Buy Limits within 15-30M recent swing lows/highs. ALERT UP! ⏰"*
Stop Loss 🛑: "Thief’s SL hides at the nearest swing low (3H TF: 3250.00) OR below the last daily candle wick. Adjust based on your risk appetite & lot size!"
Target 🏴☠️: 3490.00 (or escape early if the cops—err, bears—show up!)
⚡ Scalper’s Quick Loot Guide:
"Only scalp LONG! Rich? Go all-in. Broke? Join the swing traders & rob slow ‘n’ steady. Use Trailing SL to lock profits!"
📊 Market Status:
XAU/USD (GOLD) – Neutral (But Bullish Sneak Attack Likely! 🐂💥)
"The heist is ON, but watch for traps—overbought zones, consolidation, and bearish robbers lurking!"
🔍 Pro Thief Moves:
✅ Fundamentals Matter! (COT Reports, Geopolitics, Macro Data, Sentiment—check our BIO0 for the full loot list!) 🔗👉🏻☝🏻
✅ News = Danger! Avoid new trades during releases. Trail your SLs to protect stolen cash! 📰🚨
💖 Support the Heist Crew!
"Hit the BOOST BUTTON 💥 to strengthen our robbery squad! More boosts = easier money steals daily!"
🚀 Stay tuned—another heist drops soon! 🐱👤💎

Gold's 3290-3300 Support : Next Week Aims for Gap-Up Retest Last week, gold opened with a gap-up on Monday 🔼, then trended downward 🔽.
⚡ Notably, the 3290-3300 support zone held firmly from Monday to Thursday, demonstrating strong resilience.
🌱 The price plunged to around 3255 on Friday but rebounded promptly.
🔥 For next week, the opening may surge toward the 3290-3300 zone, warranting close attention.
🚀 Buy@3260 - 3270
🚀 TP 3280 - 3290 -3300
Accurate signals are updated every day 📈 If you encounter any problems during trading, these signals can serve as your reliable guide 🧭 Feel free to refer to them! I sincerely hope they'll be of great help to you 🌟 👇

XAUUSD 30/6 – 4/7/2025: Selling Pressure Builds - In the past week, gold OANDA:XAUUSD has been under consistent selling pressure due to the following key macro factors:
- The U.S. Dollar Index (DXY) TVC:DXY surged, raising the opportunity cost of holding gold and leading to widespread sell-offs.
- 10-year U.S. Treasury yields hovered around 4.30%–4.35% , reinforcing expectations that the Fed will keep rates higher for longer.
- Core PCE data for June indicated that inflation remains elevated, reducing the likelihood of imminent rate cuts by the Federal Reserve.
- Geopolitical tensions in the Middle East have temporarily eased, diminishing gold’s safe-haven appeal in the short term.
➤ As a result, these combined factors are applying downward pressure on XAUUSD, especially after price decisively broke the 3,300 USD support zone.
1. Technical Analysis of XAUUSD – Daily Timeframe
On the D1 chart:
- Price has broken below the key support zone 3,300 – 3,331 USD, confirming a short-term bearish structure.
- The Fibonacci retracement from the 3,399 peak to the 3,295 low has completed its pullback to the 0.5–0.618 zone (3,345 – 3,359 ) but was strongly rejected by sellers.
- Price is now trading below both EMA20 and EMA50, indicating strong bearish momentum.
- RSI has turned back under 50 and has not yet reached oversold territory, suggesting further downside potential exists.
2. Key Resistance and Support Zones for XAUUSD
Technical Role ( 3,345 – 3,359 )
- Major confluence resistance (Fibonacci 0.618 + supply) ( 3,295 – 3,300 )
- Immediate resistance zone (post-breakdown retest) ( 3,260 – 3,235 )
- Short-term support and potential buy interest ( 3,223 – 3,205 )
- Strong medium-term support (Fibonacci 1.0 + April lows)
3. Trading Strategy for XAUUSD This Week (30/6 – 4/7/2025)
Strategy 1 – Favor Short Positions Aligned with Bearish Momentum
Entry: Sell near 3,295 – 3,300 (anticipating resistance retest)
Stop Loss: 3,304
Take Profit 1: 3,290
Take Profit 2: 3,285
Take Profit 3: 3,275
Strategy 2 – Countertrend Buy at Key Support with Confirmation
Entry: Buy near 3,235 – 3,240 only if bullish reversal candles (pin bar or bullish engulfing) appear on H4 or D1
Stop Loss: 3,230
Take Profit 1: 3,245
Take Profit 2: 3,250
Take Profit 3: 3,260
Ps : XAUUSD is currently in a downward correction phase, with the next target zone lying between 3,235 – 3,260 USD. The inability to hold above 3,300 confirms that sellers remain in control. The most favorable approach this week is to sell on rallies, especially near former support-turned-resistance zones.
Stay vigilant, follow updated price action closely, and strictly manage risk to protect your capital.
Follow for more high-probability strategies throughout the week – and save this idea if you find it valuable to your trading journey.
Analysis by @Henrybillion

Next Week Aims for 3300 Break💎 Last week, gold opened gap-up on Monday 🔼 but then trended lower 🔽. However, the 3290-3300 support zone remained robust from Mon-Thu ⚡. It plunged to ~3255 on Fri before rebounding 🌱. Next week's open may surge to 3290-3300 🔥!
🚀 Sell@3260 - 3270
🚀 TP 3280 - 3290 -3300
Accurate signals are updated every day 📈 If you encounter any problems during trading, these signals can serve as your reliable guide 🧭 Feel free to refer to them! I sincerely hope they'll be of great help to you 🌟 👇

XAUUSD: We must adapt to the market conditions! Bears in ChargeGold prices dropped as Trump announced a ceasefire between Iran and Israel, causing a significant decline. We anticipate this trend to persist, as recent price data, including volume and price momentum, indicates a strong seller’s control in the current market conditions. We have two targets for you to set your own based on your analysis, along with a stop-loss based on your strategy.
We appreciate your unwavering support throughout the years. Please like and comment.
Team Setupsfx_
❤️🚀

Gold Rebounds After Filling Gap >> Bullish Continuation in SightHello guys!
Gold (XAU/USD) is showing signs of strength on the 4H chart after filling a key gap around the $3,290 level and bouncing off it with bullish intent.
🔹 What I see:
– Price previously broke out of a broad descending channel, flipping the structure bullish
– After forming a rising wedge, Gold corrected lower and filled the gap
– The zone around $3,290 acted as solid support, and the current bounce suggests bulls are regaining control
📈 Outlook:
If this bounce holds and momentum builds, the next area of interest is clearly marked:
🎯 First Target: $3,466 – an area of prior structure and possible supply
📍 Current Price: $3,329
🟢 Bias: Bullish (above $3,290)
🔴 Invalidated below: $3,244
This setup offers a favorable risk-to-reward opportunity if the structure continues holding. Keep an eye on price action near the recent local highs for confirmation.

XAUUSD ( Gold) ( RFI Level entry) We need to wait for a test of this RFI level, as well as a confirmed break inside it on the lower timeframes. Otherwise, let the price go without us.

Gold Trade Setup - 27/Jun/2025Hi Traders,
I expect this pair to go Up after finishing the correction.
1) Need to wait for market to show changing of the direction.
2) The current move can be just a part of a correction or an impulse in itself. Going to follow the market behavior at my zones.
How to Enter : Look for engulfing with in the SL zone.