"Gold Vault Breach! XAU/USD Heist Plan in Motion"🏴☠️💰 XAU/USD Gold Heist Blueprint 💰🏴☠️
“The Vault’s Open… Time to Load Up!”
🌟Hi! Hola! Ola! Bonjour! Hallo! Marhaba!🌟
Dear Money Makers & Market Robbers 🤑💰💸✈️
Get ready to execute the Golden Robbery with style and precision! Based on our 🔥Thief Trading Style🔥 using both technical & fundamental weapons, we’ve decoded the latest gold vault password: XAU/USD (Gold vs USD) is showing bullish bias!
🎯 Heist Instructions:
📈 Entry Point –
“The vault is wide open!”
Enter long anytime — but for the sharp shooters, place buy limits on the most recent 15/30min swing lows or pullback zones for a stealthier entry. Let the retracement pull the guards away 😏🔐
🛑 Stop Loss –
🔒 Set your Thief SL just below recent swing lows on the 4H timeframe (around 3310.0).
🔧 Adjust based on risk tolerance, lot size, and number of open trades — every heist has its escape plan!
🏁 Target Zone –
🎯 Aim for 3395.0 — or vanish before the cops show up!
Trail the stop as you go and don’t get greedy — wealth is preserved when exits are clean! 🏃♂️💨
🧲 Scalper's Advisory:
Only steal on the Long Side! Bulls are funding this operation.
💼 Big pockets? Dive in.
💳 Small stack? Swing with the pros & follow the plan.
🎯 Use Trailing SL to keep the loot safe.
📊 Market Insight – Why We Rob Gold Now?
XAU/USD shows bullish momentum 🐂 backed by:
Macro & Fundamental Data 🧠
Geopolitical & Intermarket Trends 🌍
COT Reports & Sentimental Outlook 💼
Dollar Weakness + Safe Haven Flow 💸
📚 Always cross-check the news wires & reports to validate the path! Fundamentals are the lockpick tools behind every breakout! 🔓📈
⚠️ Stealth Warnings:
📆 News Events = Increased Surveillance!
🚫 No new entries during high-volatility news drops.
🛡 Use Trailing SL on live trades to secure the bag.
💖 Wanna Support Our Heist Style?
Smash that 🚀 BOOST BUTTON 🚀
It fuels our Thief Army and helps you & your crew loot the market with confidence and flair!
Every day’s a new caper — follow the plan, manage your risk, and stay outta jail! 🏆💪🤝🎉
🔐 See you in the next Robbery Blueprint — Stay Locked & Loaded!
🐱👤💼📈💣💸
Xauusdlong

XAUUSD:Go long
Short - term first do a rebound.
Trading Strategy:
BUY@3283-86
TP:3297-3304
More detailed strategies and trading will be notified here ↗↗↗
Keep updated, come to "get" ↗↗↗

Analysis and layout of the latest gold trends during the day📰 Impact of news:
1. PCE and Consumer Index
📈 Market analysis:
Judging from the 4H chart, the Bollinger Bands are closing and the MACD is showing a trend of forming a death cross, indicating that the short-selling momentum is still relatively strong in the short term. However, as the overall upward structure has not been destroyed, there is still a possibility of a rebound and repair in the future. During the day, we need to pay special attention to the support strength of the MA5 and MA10 moving averages. It is recommended to adopt the idea of shorting at high levels and going long at low levels. The key support below is the 3305-3295 area, and the upper resistance is the 3340-3350 range. However, judging from the chart, in the short term, there may be a rebound near 3313. At present, it has indeed rebounded to around 3319 as expected. If it falls weakly to this week's low of 3295, you can buy if it does not break. On the whole, if it rebounds to 3335-3345, you can consider shorting, and if the support below 3305-3295 is not broken, go long. Today is Friday, and as it is near the end of the month, market liquidity is strong. Please be cautious in your operations today and be sure to set stop losses strictly.
🏅 Trading strategies:
SELL 3335-3345-3350
TP 3320-3315-3300
BUY 3305-3295
TP 3310-3320-3330
If you agree with this view, or have a better idea, please leave a message in the comment area. I look forward to hearing different voices.

XAUUSD: Bearish Trend, Key Support at $3,295Market Overview
In today’s trading session (26/06/2025), XAUUSD shows continued downward momentum. Gold prices are currently hovering around $3,302.05, with a slight drop of 0.01%. The intraday price range has been tight, between $3,330.00 and $3,350.00, indicating a battle between the buyers and sellers around the short-term equilibrium zone.
Recent price action suggests that after a brief recovery, gold is once again encountering resistance at the $3,350.00 level. In the coming hours, a decisive breakout either above this resistance or below current support will dictate the market’s next move.
Key Technical Levels to Watch:
Support Levels: The first significant support is at the $3,295.37 level (50% Fibonacci retracement), with the next support at $3,296.60 (61.8% Fibonacci retracement), followed by a crucial level at $3,300.56.
Resistance Levels: The primary resistance area lies around $3,350.00, with the second resistance at $3,327.72, which coincides with the 3.618 extension of the previous price swing.
Price Action Analysis
As seen in the chart, XAUUSD is currently trading below both the 50-period (blue) and 200-period (yellow) moving averages, indicating a strong bearish trend. The price action is forming a series of lower lows and lower highs, reinforcing the downtrend.
Bearish Trend Continuation: A break below the support at $3,295.37 could signal further downside towards $3,290.00 or even $3,275.00. The yellow trendline indicates the overall bearish direction, and any failure to hold above $3,300.00 could trigger additional selling pressure.
Fibonacci Retracement Levels: Price is testing the 50% and 61.8% Fibonacci levels. A rejection at these levels could cause a pullback towards lower support zones, confirming the bearish outlook for the short term.
Volume Analysis
The volume chart shows relatively low volatility, with decreasing volume during the price pullbacks. This suggests that there is not enough buying interest to push the price higher, and the market may be more inclined towards bearish continuation in the near term.
Market Sentiment
Currently, the market is undecided. The recent price action suggests that traders are waiting for a confirmation of direction. The next few hours are critical in determining if the downtrend will continue or if we will see a short-term bounce at one of the key support levels.
Trading Strategy
Short Position: A break below $3,295.37 would be an excellent opportunity to short XAUUSD with a target at $3,290.00, and further down to $3,275.00.
Long Position: Only consider long positions if XAUUSD manages to break above $3,350.00 decisively, with the next target near $3,375.00.
Conclusion
XAUUSD remains under pressure, and unless there’s a strong reversal at support levels, the bearish momentum could continue in the short term. Traders should monitor the key levels mentioned above closely to adjust positions accordingly.

Bulls and bears are anxious? Rebound continues to empty📰 Impact of news:
1. Initial unemployment claims data
📈 Market analysis:
Gold is in a sideways consolidation near 3320 in the short term. The market has no clear direction for the time being, and the long and short positions are in a tug-of-war. The hourly line rebounded to 3328 and then fell back again, suggesting that there is still room for short-term retracement. The current operation needs to focus on key points: if it rebounds to the 3320-3330 resistance area, you can consider entering short positions again. If the market continues to decline, focus on the 3300-3290 support range. If it stabilizes, long orders can be arranged. The overall idea is to maintain a volatile market. Before effectively breaking through 3350 or falling below 3290, high-altitude and low-multiple is still the main strategy.
🏅 Trading strategies:
SELL 3320-3330
TP 3310-3300-3290
BUY 3310-3300
TP 3320-3330-3340
If you agree with this view, or have a better idea, please leave a message in the comment area. I look forward to hearing different voices.
OANDA:XAUUSD FX:XAUUSD FOREXCOM:XAUUSD FXOPEN:XAUUSD TVC:GOLD

6/25 Gold Analysis and Trading ViewGood morning, everyone!
Gold experienced a sharp decline yesterday. Technically, the conditions for a rebound are in place, but since a solid bottom structure has yet to form, a retest to the downside is likely during today’s session.
Key levels to watch:
Resistance zone: 3336–3348
Support zones: Primary support at 3313–3303, with additional support around 3296–3282
Today’s overall strategy remains buying on dips as the primary approach, with short opportunities near resistance as a secondary option.
Key scenario to monitor:
If the price drops to around 3280 but fails to rebound toward 3336, and the daily close ends below 3300, then the buy-on-dip strategy will likely continue into tomorrow.

Gold Short Term OutlookYesterday’s chart analysis played out well.
Price broke above the MA50 and tested the $3,346 resistance zone. However, this zone failed to hold, and gold dropped aggressively toward the $3,306 support.
Once again, price is trending below both the 50 and 200 moving averages, indicating continued bearish pressure.
For now, the $3,306 support is holding. Bulls need to break above $3,330-$3,346 for higher levels to open up.
🔑 Key Levels:
Resistance:
$3,346 • $3,361 • $3,375
Support:
$3,306 • $3,287 • $3,271 • $3,242

Gold: Resistance Validated, Short at 3340-3350 Tomorrow📈 Gold Trading Recap & Tomorrow's Strategy: Resistance Holds, Short Opportunities Persist
💎 Today's newly updated live short strategy hit the TP target successfully! As mentioned earlier, when gold failed to break the support level, we anticipated it to range around 3330—today's trades were precisely centered on this logic. The 3350 resistance was also validated firmly during the session.
💎 Expect further upside in tomorrow's Asian session—recommend continuing short positions within the 3340-3350 range 🚀
🚀 Sell@3350 - 3345
🚀 TP 3335 - 3325 - 3315
Accurate signals are updated every day 📈 If you encounter any problems during trading, these signals can serve as your reliable guide 🧭 Feel free to refer to them! I sincerely hope they'll be of great help to you 🌟 👇

XAUUSD/GOLDThe bullish trend has opened. After the retracement is confirmed, continue to buy and wait for the market to rise and fill the gap.

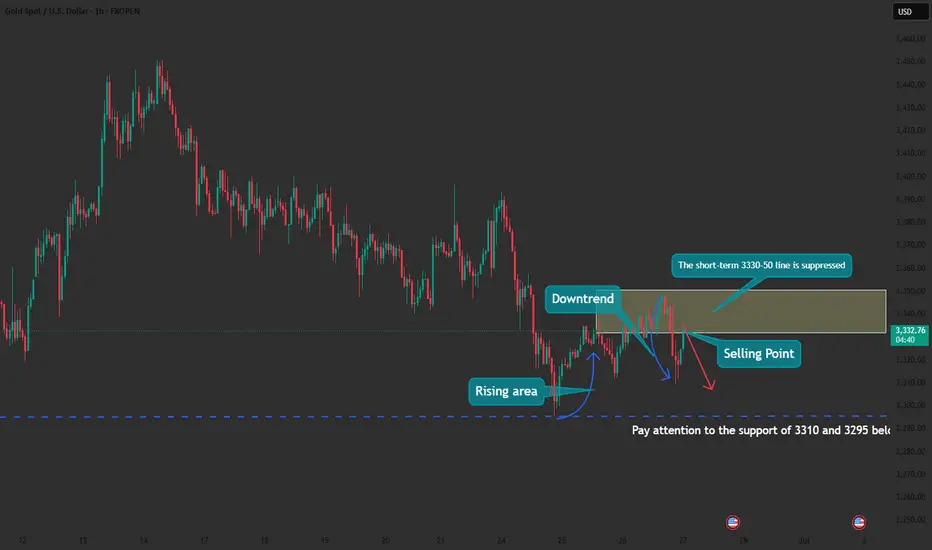
Gold reaches the lower support and makes a bold attemptWith the official ceasefire in the Middle East, risk aversion has returned to normal. Russia and Ukraine are now expected to return to the negotiation table. The situation that was in full swing last week has suddenly become calm. Then the focus of market attention has shifted again to the Federal Reserve's monetary policy. Federal Reserve Powell reiterated in his testimony to the Senate Committee on the semi-annual monetary policy report that there is no rush to act. The tariffs are unprecedented and it is difficult to predict the impact on inflation. Consumers may have to bear part of the tariffs. The trade agreement may make the Federal Reserve consider cutting interest rates, continuing its previous hawkish tone and suppressing the rebound in gold prices.
Gold hourly chart;
Short-term analysis of gold; The recent fluctuations of 1-200 US dollars have greatly increased the difficulty of trading for retail investors. It seems that there are many opportunities in a day, but in fact, the big market mainly appears in a few times. If you can't keep up in time, you can only watch the price jump up and down. The most feared thing is not to keep up with the market, but the price returns to the same point, but the principal is gradually reduced.
From the 4-hour analysis of gold, there are repeated resistances from the bulls before the downward break; once the downward break, the market will go further short, and pay attention to 3280 below. The upper short-term 3330-50 line is the key to suppression. Only by breaking the bulls can the rebound continue. In terms of operation, sell high and buy low, and pay attention to the breakthrough!
There are too many long orders at high levels of gold at present, and the market will not rise easily. The current international situation is so tense, and gold is still slowly declining. It is difficult to rebound sharply in this situation.
XAUUSD:Today's trading strategy
On Tuesday, the news that Trump announced a ceasefire between Iran and Israel dampened the risk aversion sentiment. Subsequently, the news that expectations of interest rate cuts had slowed down led to a further decline in gold prices. During the trading session, it once fell below the 3,300 mark. After the impact of the news weakened, it eventually rebounded to around 3,323, approaching the position where we first entered the market yesterday. Currently, there is no logic in the market. From a technical perspective, The resistance level above is at 3340-45, and the support level below is at 3305-10. We can conduct transactions around this range
Trading strategy:
SELL@3340-45
TP:3310-04
BUY@3305-10
TP:3335-40
More detailed strategies and trading will be notified here ↗↗↗
Keep updated, come to "get" ↗↗↗

Gold fluctuates at high levels, intraday trading points📰 Impact of news:
1. Initial unemployment claims data
📈 Market analysis:
Gold has begun to show signs of bottoming out in the short term in the past two days. Since the daily line bottomed out and pulled up, the daily line closed positive yesterday, and the bulls began to counterattack, and the 1H low was rising. If it doesn't fall further in the short term, it will most likely bottom out and rebound. The upper pressure is at the Bollinger middle track of 3355, which is also the high point of Tuesday's decline. If gold breaks and stabilizes at this price, it will have a larger upward space, and the upper side will look at 3385. In the 4H chart, MACD temporarily forms a golden cross, which is a bullish signal; but the BOLL track pressure is still there, and gold bears still have momentum in the short term. Therefore, on the whole, in the short term, gold should pay attention to the 3350-3360 resistance above. If it encounters resistance under pressure here, it can consider shorting. Pay attention to the 3330-3320 support area below.
🏅 Trading strategies:
SELL 3350-3360
TP 3340-3330-3320
BUY 3330-3320
TP 3340-3350
If you agree with this view, or have a better idea, please leave a message in the comment area. I look forward to hearing different voices.
TVC:GOLD FXOPEN:XAUUSD FOREXCOM:XAUUSD FX:XAUUSD OANDA:XAUUSD

XAUUSD:Short sell at 3340-45
Today's trading needs to narrow down the range. There are signs that the center of gravity below is gradually moving upward. During the Asian session, the highest point reached around 3343. Friends who have already bought short positions here can wait for 3320-25 to take profits and exit. Those who haven't bought can wait for 3340-45 to short, with the target also being 3320-25
Trading strategy:
SELL@3340-45
TP:3320-25
It can be considered to go long when it reaches around 3320-25
More detailed strategies and trading will be notified here ↗↗↗
Keep updated, come to "get" ↗↗↗

6/26 Gold Analysis and Trading ViewGood morning, everyone!
Yesterday, gold rose to around 3336 before pulling back, then revisited the same level again. The buy-on-dip strategy performed well, delivering solid profits.
At today’s open, prices have moved slightly higher but remain near resistance. Technically, there’s potential to test the 3350 area, and if the move is strong, a rally toward 3370 is also possible.
If gold reaches this zone, it may present a favorable short-term selling opportunity. Therefore, today's trading strategy should focus on range-based trading between 3326-3368, selling near resistance and buying near support.
Key levels to watch:
Resistance: 3348–3352
Support: 3326–3318
Lastly, be mindful: if a trending move emerges, adjust your strategy accordingly and avoid counter-trend trades. Stay flexible and manage risk wisely.

XAUUSD has been in a strong free fall following the sell strategXAUUSD has dropped sharply in a free fall, perfectly following the sell strategy from 3348–3350.
We have won.
Trading Strategy for XAUUSD OANDA:XAUUSD
Based on the current price structure and short-term bias, here are two tactical trade setups:
Sell Setup – If Price Rejects Resistance
Entry: 3,348 – 3,350 USD
Stop-loss: 3,357 USD
Take-Profit 1: 3,340 USD
Take-Profit 2: 3,335 USD
Take-Profit 3: 3,330 USD
Buy Setup – If Price Holds Support
Entry: 3,328 – 3,330 USD
Stop-loss: 3,320 USD
Take-Profit 1: 3,338 USD
Take-Profit 2: 3,340 USD
Take-Profit 3: 3,348 USD
Important: Always set a stop-loss in every trade to manage risk effectively.

XAUUSD Trading Strategy for June 26–27, 20251. Market Overview
In today’s session (June 26, 2025), XAUUSD OANDA:XAUUSD (gold spot) is trading around 3,339.6 USD, posting a modest +0.22% gain compared to the previous day. The intraday range has been confined between 3,330 – 3,350 USD, reflecting a tug-of-war between buyers and sellers in this short-term equilibrium zone.
Following a recent corrective move, demand has reappeared around the 3,330 USD support. However, the recovery momentum is currently facing resistance near 3,350 USD, and the market will require a clear breakout to establish the next directional move.
2. Technical Analysis
Price Behavior
- Gold is moving sideways within the 3,330 – 3,350 USD range, which has acted as both support and resistance in recent sessions. It is also a high-liquidity zone, indicating indecision among market participants.
- The rebound from the 3,291 – 3,317 USD support zone is still ongoing, but there is no confirmation yet of a completed downtrend or trend reversal.
RSI Indicator
- The RSI (14) is currently fluctuating within the neutral zone (49–54), suggesting a lack of strong momentum in either direction.
- A sustained move above 55 could signal the return of bullish strength.
3. Key Technical Zones
Resistance:
- 3,350 USD: Frequently rejected intraday, immediate resistance to watch
- 3,373 – 3,392 USD: A major confluence of the Fibonacci 0.618 retracement and previous supply zone from last week
Support:
- 3,330 USD: Intraday support and equilibrium zone
- 3,291 – 3,317 USD: Strong structural support in case of further pullback
4. Trading Strategy for XAUUSD OANDA:XAUUSD
Based on the current price structure and short-term bias, here are two tactical trade setups:
Sell Setup – If Price Rejects Resistance
Entry: 3,348 – 3,350 USD
Stop-loss: 3,357 USD
Take-Profit 1: 3,340 USD
Take-Profit 2: 3,335 USD
Take-Profit 3: 3,330 USD
Buy Setup – If Price Holds Support
Entry: 3,328 – 3,330 USD
Stop-loss: 3,320 USD
Take-Profit 1: 3,338 USD
Take-Profit 2: 3,340 USD
Take-Profit 3: 3,348 USD
Important: Always set a stop-loss in every trade to manage risk effectively.
Ps: XAUUSD remains in a short-term consolidation phase, oscillating within a narrow range of 3,330 – 3,350 USD. A breakout beyond this range will likely define the market's direction heading into the New York session. Traders are advised to monitor price action closely within these levels and wait for clear confirmation before executing any positions.
Stay tuned for more daily gold strategies, and don’t forget to save this analysis if it helps refine your trading plan.
Analysis by @Henrybillion

xauusd updateentry price 3288
stop loss update 3289
take profit
3414
3500
3625
hit first target now risk free

It’s the right time to short goldThe daily gold line presents a three-top gathering pattern. The historical trend shows that the 3290-3280 area has triggered technical pullbacks many times, all of which rebounded to around 3350. The current 4-hour chart trend line suppression level coincides with the Fibonacci 0.618 pullback resistance from the previous high of 3450 to 3300 in the 3350-3360 range. This area constitutes the core pressure zone. If the price fails to effectively break through and stand above 3360 when it probes this area again, it is highly likely to replicate the previous two resistance and fall patterns. At that time, short orders will be arranged based on the 3350 first-line resistance area, with the goal of breaking the key support of 3300 and further looking down at the 3280 and 3260 levels. The overall bearish tendency is maintained, and the resistance to rebound is a signal to enter the market and sell short.
Gold recommendation: Gold is short around 3345-3352, target 3330-3320

The Fed's rate cut cannot stop the decline in gold pricesThe 4-hour technical pattern is repaired, the short-term moving average diverges upward, and the K-line stands firm on the moving average support and fluctuates upward. In the short term, pay attention to the breakthrough of the 3350 pressure level and the confirmation of the European and American market retracement. The daily price stabilizes at the 3300 support level, and the downward momentum is weakened. The overall pattern of fluctuations is maintained. Be vigilant about the short-term adjustment risk after continuous highs. In terms of operation, it is recommended to arrange short orders in batches in the 3347-3352 area, and strictly stop loss and take profit.

XAUUSD Possible Move 26.05.2025Gold is currently respecting an ascending channel, showing consistent higher highs and higher lows. Price is now testing the upper boundary of this channel and approaching a key supply zone (3353–3357), which previously triggered a strong sell-off.
Key Zones:
🔼 Sell Zone: 3353–3357 (confluence of supply + channel resistance)
🔽 Buy Zone: 3325–3329 (demand zone + channel support)
✅ Trade Ideas:
📍Buy Setup
Entry: 3325–3329
SL: Below 3310
TP: 3350–3355
📍Sell Setup
Entry: 3353–3357
SL: Above 3367
TP: 3330–3325
🔔 Important Note:
⚠️ Today's U.S. Jobless Claims data is critical. Expect volatility and possible breakout/fakeout scenarios around the time of release. Trade only on confirmation.

The Direction After Sideways Fluctuation at 3330Trump's announcement of an Israel-Iran ceasefire dented safe-haven sentiment, curbing safe-haven buying 🛑. Gold opened with a sharp plunge, then extended losses as Powell later stated that more time is needed before considering rate cuts—dovish expectations eased, sending gold further lower ⬇️. The price briefly fell below the 3,300 level, nearing 3,295 at its lowest, but failed to breach the 3,290-3,300 support zone 📊. As I indicated yesterday, traders could test rebound strength near support; once news impacts faded, gold rebounded to close at 3,323 🔄.
Currently trading sideways around 3,330, gold faces resistance at 3,350 while downside support remains at 3,290-3,300 📈📉. We therefore maintain a bearish stance
⚡️⚡️⚡️ XAUUSD ⚡️⚡️⚡️
🚀 Sell@3345 - 3335
🚀 TP 3325 - 3315 - 3305
Accurate signals are updated every day 📈 If you encounter any problems during trading, these signals can serve as your reliable guide 🧭 Feel free to refer to them! I sincerely hope they'll be of great help to you 🌟 👇

XAUUSD and GBPJPY Analysis todayHello traders, this is a complete multiple timeframe analysis of this pair. We see could find significant trading opportunities as per analysis upon price action confirmation we may take this trade. Smash the like button if you find value in this analysis and drop a comment if you have any questions or let me know which pair to cover in my next analysis.

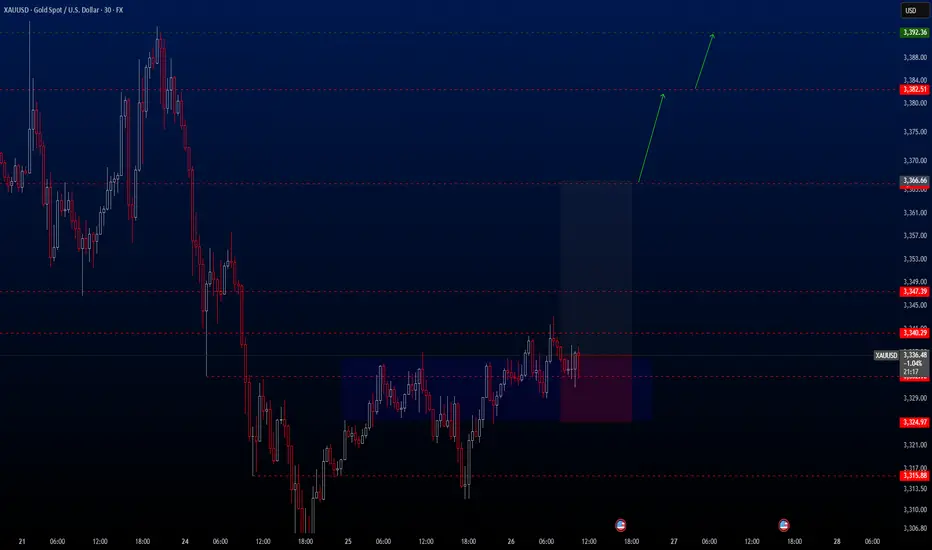
XAUUSD Hello traders.
Today’s first trade setup comes from the XAUUSD pair. The pair is currently positioned in an ideal buy zone, and I’ve spotted a potential long opportunity. There are three different take profit levels, all of which are listed below. Personally, I’ll be closing my position at the first TP level: 3366.66.
However, keep in mind that two major economic events will be released today:
📌 Gross Domestic Product (GDP) (QoQ) – Q1
📌 Initial Jobless Claims
These are highly impactful events, so please manage your risk accordingly.
🔍 Trade Details
✔️ Timeframe: 30-Minute
✔️ Risk-to-Reward Ratio: 1:2.5
✔️ Trade Direction: Buy
✔️ Entry Price: 3336.62
✔️ Take Profit: 3366.67 / 3382.51 / 3392.36
✔️ Stop Loss: 3324.97
🕒 If momentum fades or the price consolidates within a tight range, I’ll keep this trade open only until 23:00 (UTC+4). After that, I’ll close it manually—whether in profit or loss—depending on how the price action evolves.
🔔 Disclaimer: This is not financial advice. I’m simply sharing a trade I’ve taken based on my personal trading system, strictly for educational and illustrative purposes.
📌 Interested in a systematic, data-driven trading approach?
💡 Follow the page and turn on notifications to stay updated on future trade setups and advanced market insights.