Gold is about to break through 3400! On June 21, 2025 local time, U.S. President Trump announced that the U.S. had launched strikes against three Iranian nuclear facilities—Fordo, Natanz, and Isfahan—using six B-2 stealth bombers 😲. This move marked the formal intervention of the U.S. in the Middle East conflict, prompting the UN Security Council to convene an emergency meeting immediately. This underlies the core logic of our sustained "long gold" strategy last week: the geopolitical situation in the Middle East harbors the risk of escalating at any moment 🤯. If the Security Council fails to roll out direct solutions, gold, as a safe-haven asset, may continue its upward trajectory driven by market panic 📈.
The UN Security Council meeting on June 23, 2025 failed to break the deadlock, and the Middle East situation remains highly fluid. Given that the U.S. is highly unlikely to implement any solutions proposed by the Security Council, the regional crisis may deteriorate further 🚨
Gold is about to break through 3,400! 🌟
Accurate signals are updated every day 📈 If you encounter any problems during trading, these signals can serve as your reliable guide 🧭 Feel free to refer to them! I sincerely hope they'll be of great help to you 🌟 👇
Xauusdlong

6/24 Gold Analysis and Trading OutlookGood morning, everyone!
Gold closed yesterday with a T-shaped candlestick. Although there was an intraday recovery after briefly breaching the MA20, the closing price remained below the MA5, indicating continued pressure on the upside.
Today’s opening saw a direct drop in price, suggesting a potential break below key support. Two important levels to monitor today:
Whether the closing price stays above 3355
Whether the intraday support at 3328 holds
If 3328 breaks down, the 3300 level may become the next major battleground between bulls and bears.
Driven by geopolitical news, gold has shown sharp volatility over the past two days. While this increases trading risk, it also presents more opportunities. From a technical perspective, today’s strategy should prioritize selling on rebounds, with buying at lower levels as a secondary approach. As always, stay disciplined and manage risk effectively.

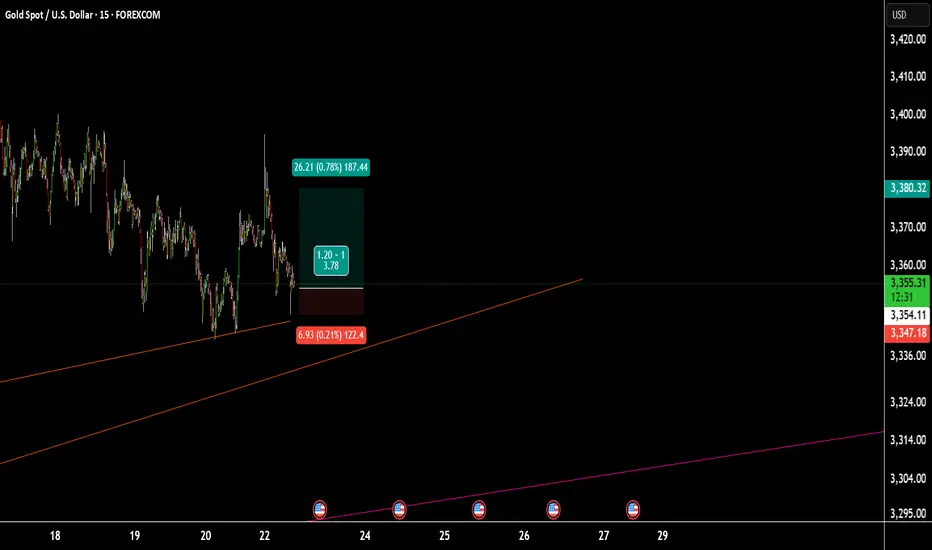
Gold updateAfter the previous level was broken and structure shifted, we’re now entering a new phase of analysis.
In this fresh setup, we’re looking for buy opportunities — but not blindly!
As always, waiting for a clean pullback to the new zone and a solid entry signal.
Experience teaches us: real profits come from patience and planning.
Here’s my new gold analysis — high probability, low risk.
For detailed entry points, trade management, and high-probability setups, follow the channel:
ForexCSP

Weakness continues, continue to short the bear market📰 Impact of news:
1. Pay attention to Powell's speech in New York
2. Pay attention to geopolitical influence
📈 Market analysis:
Gold opened lower and showed a weak situation. The 1H moving average was arranged downward. In the short term, bears still occupied the main trend. From the 4-hour analysis of gold, the bulls still had repeated resistance before breaking down. Once it breaks down, the market will go further bearish. Pay attention to 3330 below. 3400 is still the key above in the short term. Only by breaking through the bulls can the rebound continue. In terms of operation, high-altitude and low-long are temporarily maintained. Pay attention to the short-term resistance of 3355-3365 above, and the support of 3340-3330 below. Pay attention to the breakthrough! Pay attention to Powell's speech in the New York session.
🏅 Trading strategies:
SELL 3370-3365-3355
TP 3340-3330
BUY 3340-3335-3320
TP 3345-3355-3365
If you agree with this view, or have a better idea, please leave a message in the comment area. I look forward to hearing different voices.
TVC:GOLD FXOPEN:XAUUSD FOREXCOM:XAUUSD FX:XAUUSD OANDA:XAUUSD

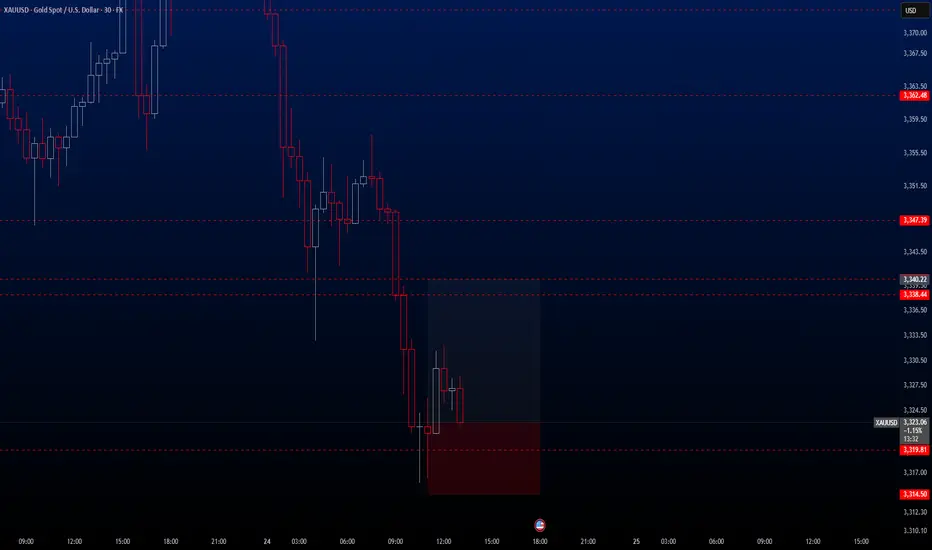
XAUUSD Hello traders. Today's second and also final trade opportunity comes from the XAUUSD pair. I consider this setup to be somewhat risky, so I recommend keeping your risk exposure at a minimum.
Earlier today, I shared a trade on GBPJPY, which has since experienced a strong upward move. As a result, I’ve updated the TP level for that trade. You can find the updated information noted under that specific post.
🔍 Trade Details
✔️ Timeframe: 30-Minute
✔️ Risk-to-Reward Ratio: 1:2
✔️ Trade Direction: Buy
✔️ Entry Price: 3323.09
✔️ Take Profit: 3340.22
✔️ Stop Loss: 3314.50
🕒 If momentum fades or the price consolidates in a tight range, I will keep this trade open only until 23:00 (UTC+4). After that, I’ll close it manually—whether in profit or loss—depending on how price action evolves.
🔔 Disclaimer: This is not financial advice. I’m simply sharing a trade I’ve taken based on my personal trading system, strictly for educational and illustrative purposes.
📌 Interested in a systematic, data-driven trading approach?
💡 Follow the page and turn on notifications to stay updated on future trade setups and advanced market insights.
GOLD continue sideway , SELL 3393⭐️GOLDEN INFORMATION:
Gold prices remain well-supported during the North American session following breaking news that Iran has launched retaliatory strikes on US military bases in Qatar. The escalation comes in response to Washington’s weekend assault on Iranian nuclear facilities. As geopolitical tensions in the Middle East dominate headlines, investors have largely sidelined US economic data. At the time of writing, XAU/USD is trading at $3,385, up 0.39%.
Macroeconomic indicators have taken a backseat as heightened conflict drives market sentiment. Citing Israeli media, Al Arabiya reported that Iran targeted US bases in Qatar, Kuwait, and Iraq with missile strikes. In a further escalation, Tehran approved the closure of the strategic Strait of Hormuz and launched additional missiles at Israeli targets—amplifying safe-haven demand for gold.
⭐️Personal comments NOVA:
Gold prices reacted to a decrease in positive news about peace in the Middle East, continuing to accumulate.
⭐️SET UP GOLD PRICE:
🔥SELL GOLD zone: 3392- 3394 SL 3399
TP1: $3382
TP2: $3370
TP3: $3360
🔥BUY GOLD zone: $3319-$3317 SL $3312
TP1: $3327
TP2: $3338
TP3: $3349
⭐️Technical analysis:
Based on technical indicators EMA 34, EMA89 and support resistance areas to set up a reasonable BUY order.
⭐️NOTE:
Note: Nova wishes traders to manage their capital well
- take the number of lots that match your capital
- Takeprofit equal to 4-6% of capital account
- Stoplose equal to 2-3% of capital account

XAUUSD:Go long
The uncertainties in multiple dimensions such as geopolitics, US monetary policy and tariffs have significantly increased, which will bring more volatility to the gold price.
Today's market trend is still mainly volatile. During the Asian session, there has been a deep pullback. 3316 is the short-term support. It is expected that there will be a rebound in the future.
Trading strategy:
BUY@3325-30
TP:3345-50
More detailed strategies and trading will be notified here ↗↗↗
Keep updated, come to "get" ↗↗↗

XAUUSD Breaks Trend – Deeper Correction Ahead?Gold (XAUUSD) has just broken below its rising H4 trendline and the key support zone around 3,340 – a strong signal for a potential short-term downtrend. A sharp bearish candle with high volume confirms sellers are now in control.
The 3,360–3,365 zone has flipped into resistance and may act as a retest area before further declines.
If price fails to hold 3,320,
the next targets are 3,300–3,280,
possibly down to 3,260.
Volume Profile indicates money is leaving the upper range, reducing the chance of a strong rebound.
Preferred strategy: wait for a pullback to 3,355–3,365,
set SL above 3,370,
and aim for TP at 3,300–3,280.
Caution: the Fed’s “higher for longer” stance and USD strength are applying pressure on gold. Long positions are risky at this stage. Monitor the 3,300 level closely for potential buyer reaction.

GOLD Intraday Chart Update For 24 June 2025Hello Traders, As you can see that GOLD fell sharply this morning due to Israel- Iran Cease fire scenario
Further more FED Chair POWELL Testifies Starts from Today and end on Tomorrow make sure to manage you trading accordingly
Right now GOLD is in Strong Bearish Trend only clear Breakout of 3368 level for the day below this market remains Bearish
All eyes on 3300 Psychological Digit for now if market breaks 3300 Successfully then it will move towards 3250 soon
Disclaimer: Forex is Risky

Gold, Will USA-Iran-Israel conflict affect it? The USA-Iran-Israel conflict can significantly impact gold prices. Gold is a safe-haven asset, so demand often rises during geopolitical tensions, pushing prices up
3406 gonna be first target for me, if it breaks this lvl with huge volume and FVG on 1h+ then most likely we will see ATH in near future
bearish scenario(lest likely) - price breaks down 3340 and close with nice volume and fvg on 1h+ which will open move all the way down to MO

XAUUSD Sideways – Breakout Setup FormingGold is currently in a clear consolidation phase on the 4-hour chart, moving within the range of 3,320 to 3,393. After a pullback from the 3,460 peak, the price has repeatedly formed ParSE and ParLE patterns, indicating a strong tug-of-war between buyers and sellers. This suggests that the market is building pressure for a potential breakout in the coming sessions.
Technically, the 3,393 – 3,400 zone remains a key resistance as price has been rejected multiple times there.
Meanwhile, the 3,320 – 3,330 area is holding as solid support, showing strong bullish reactions in previous touches.
The 3,342 – 3,350 range is acting as a neutral zone where price is accumulating before making its next move.
There are two optimal trading strategies at this stage.
The first is range trading: look to buy near 3,320 – 3,330 and target profits at 3,350 – 3,370; conversely, consider selling around 3,390 – 3,393 with take-profit targets back at 3,350 – 3,365. The second is breakout trading: if the price closes a 4H candle above 3,393 with strong volume, it opens up long opportunities targeting 3,420 – 3,445.
On the flip side, a clear break below 3,320 may lead to further downside toward 3,285 – 3,260.
From a macroeconomic perspective, traders should closely monitor US inflation data and upcoming Fed policy signals. Any hints of easing from the Fed could act as a strong bullish catalyst for gold. Additionally, geopolitical developments and USD trends remain crucial as they directly influence safe-haven flows into gold.
In summary, this is a key phase to observe and prepare for decisive action when the market breaks out of consolidation. Patience, disciplined entries, and strict risk management are essential in the current environment.
Follow for daily updates and actionable strategies as the setup unfolds.

Gold bottoms out and tests resistance, long positions at night📰 Impact of news:
1. Bowman hinted at a July rate cut
2. Fed Governor Kugler and FOMC permanent voting member and New York Fed President Williams hosted the "Fed Listening" event.
📈 Market analysis:
Gold will maintain a short-term volatile trend. Although the United States intervenes in the conflict between Iran and Israel, the geopolitical situation will affect the market trend to a certain extent. However, the remarks of Federal Reserve Board member Bowman hinting at a rate cut in July have eased market volatility to a certain extent. Gold maintains a narrow range of fluctuations at the 4H level, and the technical pattern is gradually adjusted. The K-line stands firmly on the short-term moving average. The short-term trend shows that it is necessary to observe the second opportunity for pull-up after the confirmation of the retracement. At the hourly level, the short-term moving average diverges upward, and the short-term volatile and strong pattern is maintained. In the evening, pay attention to the upper resistance area of 3395-3405, focus on the suppression of the 3405 line, pay attention to 3375-3365 below, and further pay attention to the 3345 support line if it breaks through.
🏅 Trading strategies:
SELL 3385-3395-3405
TP 3370-3365-3345
BUY 3375-3365-3355
TP 3390-3400-3405
If you agree with this view, or have a better idea, please leave a message in the comment area. I look forward to hearing different voices.
TVC:GOLD FXOPEN:XAUUSD FOREXCOM:XAUUSD FX:XAUUSD OANDA:XAUUSD

XAUUSD Hey traders
I can see BUY setup XAUUSD Pair in 4hr time frame
wait for market to come entry point
Also use proper money management
Always wait for confirmation/strong setup for open a trade.
Thank you and Good Luck!
Happy trading.

Conflict breaks out, risk aversion rises, can 3400 be broken?Bowman's dovish comments in the afternoon eased the market, by which time risk aversion was deepening as sudden geopolitical conflicts continued to deepen. Will the USA make a corresponding response to this matter? This series of events has once again put gold into a complicated situation. Can gold hit the 3,400 mark today?
Free trading strategies are updated daily🌐. All trading strategies released since this month have been verified and can serve as a good reference📈.👇 I sincerely hope that these strategies can be helpful to you👇.
OANDA:XAUUSD FX:XAUUSD FOREXCOM:XAUUSD FXOPEN:XAUUSD TVC:GOLD

Gold Strongly Builds a Bottom to Test ResistanceDespite the U.S. air strikes on three Iranian nuclear facilities intensifying geopolitical tensions on Monday, the U.S. dollar stabilized at high levels supported by hawkish expectations of the Federal Reserve, restricting gold bulls. Although geopolitical risks should theoretically boost gold's safe-haven demand, the market showed relative caution, partly due to recent hawkish remarks from Fed officials. While the dot plot implies two possible rate cuts this year, only one rate cut is expected for 2026 and 2027 respectively, a prospect that limits gold's upside potential.
The market is currently focused on the upcoming release of U.S. June PMI data, which will serve as a key barometer for the economic outlook. If the data comes in strong, it will further strengthen the long-dollar stance, and gold may continue to be under pressure. Conversely, if the PMI falls short of expectations, gold is expected to gain short-term support. Gold opened gap-up today but then trended lower, stabilizing and rebounding after touching $3,346, and once again hovering around the high of $3,388. The market outlook still focuses on high-level adjustments.
you are currently struggling with losses,or are unsure which of the numerous trading strategies to follow,You have the option to join our VIP program. I will assist you and provide you with accurate trading signals, enabling you to navigate the financial markets with greater confidence and potentially achieve optimal trading results.
Trading Strategy:
buy@3350-3360
TP:3380-3390

Gold price PMI positive, slight increase⭐️GOLDEN INFORMATION:
Gold prices (XAU/USD) edge higher toward $3,375 in early Asian trading on Monday, driven by heightened geopolitical tensions following US President Donald Trump’s decision to intervene militarily in the Israel-Iran conflict. The move significantly escalates the situation in the Middle East, fueling demand for safe-haven assets like gold.
The US launched airstrikes on three Iranian nuclear facilities early Sunday, marking a direct entry into the conflict despite Trump’s prior pledges to avoid new overseas wars. The intensifying turmoil has sparked a wave of risk aversion, supporting bullion prices amid rising uncertainty. Meanwhile, investors will closely monitor the preliminary S&P Global US Purchasing Managers’ Index (PMI) for June, due later in the day, for further market direction.
⭐️Personal comments NOVA:
Gold prices continue to be supported around the 3340 mark, positive with today's US PMI news data
⭐️SET UP GOLD PRICE:
🔥SELL GOLD zone: 3380- 3382 SL 3387
TP1: $3370
TP2: $3360
TP3: $3350
🔥BUY GOLD zone: $3318-$3316 SL $3311
TP1: $3326
TP2: $3338
TP3: $3349
⭐️Technical analysis:
Based on technical indicators EMA 34, EMA89 and support resistance areas to set up a reasonable BUY order.
⭐️NOTE:
Note: Nova wishes traders to manage their capital well
- take the number of lots that match your capital
- Takeprofit equal to 4-6% of capital account
- Stoplose equal to 2-3% of capital account

Gold opens high and moves lower, focus on 3340 support📰 Impact of news:
1. Federal Reserve Board member Bowman speaks on monetary policy and the banking industry
2. The United States intervenes in the Iran-Israel conflict and pays attention to the geopolitical situation
📈 Market analysis:
In the early Asian session, gold prices surged but failed to break through the key watershed of 3405. The current risk aversion conflict failed to break through the key resistance level, so the short-term trend is still weak and bearish. On the hourly chart, gold continues to retreat. As the current short-selling momentum continues to gain momentum, we will first look at whether the double bottom support of 3340 is effective. If it fails to break through while retreating, we can consider a short-term upward rebound in the support and consider going long. Looking at the second decline point at 3370-3375, unless the news stimulates the gold trend, you can still consider placing short orders if it touches the 3370-3380 line! On the whole, pay attention to the resistance line of 3370-3380 above and the support line of 3345-3335 below.
🏅 Trading strategies:
BUY 3350-3345-3335
TP 3360-3370-3380
SELL 3370-3380
TP 3360-3350-3345
If you agree with this view, or have a better idea, please leave a message in the comment area. I look forward to hearing different voices.
OANDA:XAUUSD FX:XAUUSD FOREXCOM:XAUUSD FXOPEN:XAUUSD TVC:GOLD

Gold Market Analysis and Trading Recommendations for TodayLast Friday, the overall gold price on the technical side continued to be under pressure, retracing and oscillating in adjustment. Eventually, it stabilized at the 3340 level before the close, rebounding and oscillating to close. The daily K-line reported an oscillating digital K. The overall gold price continued the recent suppressed oscillating consolidation.
However, over the weekend, the US military attacked Iranian nuclear facilities, intensifying geopolitical tensions in the Middle East, and market risk-aversion sentiment heated up. This morning, the gold price gapped up, piercing the 3390 level, reaching a high of around 3398 before retracing and falling into oscillation.
In the short term, it is highly probable that the gold price will continue to operate in a wide-ranging oscillating interval between long and short positions, continuing to trade time for space. Although the gold price opened high and moved low, it still has not broken the long-term trend channel. Looking for opportunities to go long on retracement is also the current trend.
From the current market trend, today's technical support on the downside focuses on around 3350 - 3345, and the short-term resistance on the upside is around 3380 - 3385, with a key focus on the 3395 - 3405 level. For the day, first, rely on this interval to maintain the main tone of participating in the long - short cycle. For positions in the middle range, always observe more and trade less, and be cautious about chasing trades. Patiently wait for key points to enter the market.
XAUUSD
buy@3345-3355
tp:3370-3390-3410
Investment itself is not the source of risk; it is only when investment behavior escapes rational control that risks lie in wait. In the trading process, always bear in mind that restraining impulsiveness is the primary criterion for success. I share trading signals daily, and all signals have been accurate without error for a full month. Regardless of your past profits or losses, with my assistance, you have the hope to achieve a breakthrough in your investment.

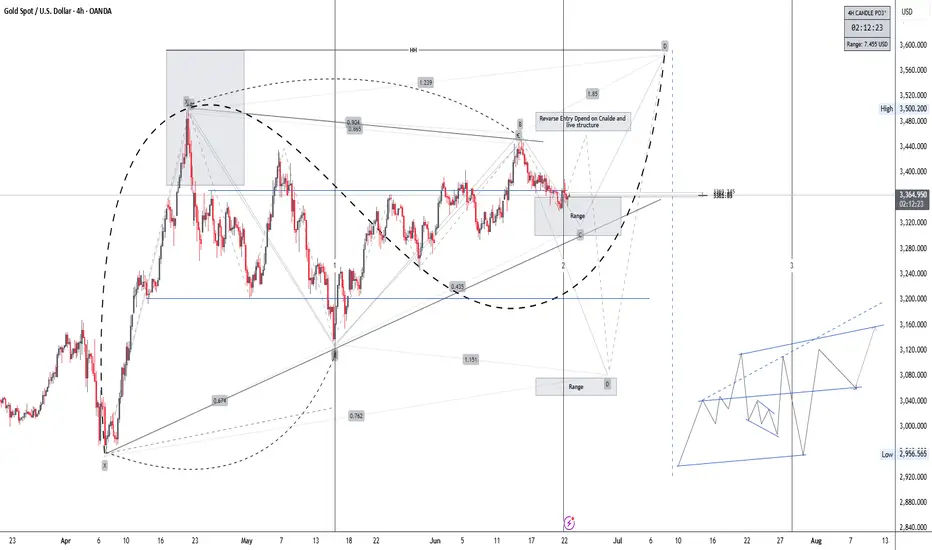
XAUUSD H4Gold is forming a bullish structure on the 4H chart. Price is consolidating at a key reversal zone (Point C). If we get bullish confirmation, I’m targeting:
$3,400 short-term
$3,500 next
$3,560+ final leg (Point P)
Support at $3,300 must hold—below that, I’ll re-evaluate.
Watching closely for a breakout and retest above the trendline before entering.
Not financial advice – just my view.
XAUUSD and USOILHesitation Geopolitical factors have led to the escalation of relations between several countries. The Middle East is in chaos. Although this is a trading market, the relationship between the two is too close. This is why the Asian market XAUUSD reached a high of 3400.
But it is not stable. Because after the news that stimulated the rise in gold prices over the weekend, there were some negative news. For example, peace talks, time differences, negotiations and other factors have eased the tense atmosphere. Then the gold price fell with the trend, reaching a low of 3347.
From the overall situation, the market still has the momentum to rise in the short term. But this depends on Iran's response. Including the impact of the Strait of Hormuz. This is the key factor in the rise or fall of oil prices. Investors with larger funds can arrange long orders in advance.
The view on XAUUSD is to buy at low levels. The impact of geopolitics is too huge. On the basis of interest rate cuts, buying is the key to profit. But everyone's financial situation is different, so when trading, remember to control the position ratio. Prevent trading errors from leading to account liquidation.

Next Week Gold Trend Forecast & Trading TipsDuring this round, the price was sold off sharply from the historical high of 3,500 to 3,120 before rebounding. After consecutive rallies, it faced pressure and fell back to 3,452 due to the fading of market risk aversion. On Friday, it rebounded from a low of 3,340. The daily chart recorded a consolidative bearish candle, with the K-line combination leaning bearish, while the 4H chart showed signs of stopping the decline.
In the short term, it is expected to consolidate below 3,400 next week. For the medium term, attention should be paid to the geopolitical crisis and the Federal Reserve's July interest rate decision. A breakthrough node will be ushered in after confirming the resistance above 3,400.
On the short-term 4-hour chart, the support below is focused around 3,340-45, and the short-term resistance above is around 3,380-85. The key focus is on the suppression at the 3,400-05 level. The overall strategy of going long on pullbacks within this range remains unchanged. For medium-term positions, it is advisable to stay on the sidelines, avoid chasing orders, and patiently wait for entry at key levels.
Investment itself is not the source of risk; it is only when investment behavior escapes rational control that risks lie in wait. In the trading process, always bear in mind that restraining impulsiveness is the primary criterion for success. I share trading signals daily, and all signals have been accurate without error for a full month. Regardless of your past profits or losses, with my assistance, you have the hope to achieve a breakthrough in your investment.

XAUUSD – Is Gold About to Break Out of Balance? Market Overview As the U.S. dollar maintains its upward momentum fueled by expectations that the Federal Reserve will keep interest rates elevated for an extended period, gold (XAUUSD) is currently trading near the key Point of Control (POC) for June. The consolidation around the $3,350–$3,360 zone indicates a temporary balance of supply and demand, and the market appears to be gearing up for a strong directional breakout in the upcoming sessions.
Detailed Technical Analysis ✅ Volume Profile & Price Structure
POC (highest volume level): $3,360 – the central volume area for the week/month
Current price: $3,353 – just below the POC, reflecting selling pressure dominance
Price is reacting to the demand zone at $3,343–$3,345, with significant volume support below
Short-term reversal signals from ParLE and ParSE indicators suggest a potential market shift
🔍 Key Resistance Levels:
$3,360 – POC and immediate resistance zone
$3,398 – previous supply zone with strong rejection history
$3,451 – Fibonacci extension high and the strongest resistance for the month
🔍 Key Support Levels:
$3,345 – high-volume support cluster
$3,343 – Fibonacci and dynamic support zone
$3,276 – final support before mid-term structure breakdown
🎯 XAUUSD Trading Strategy for Today (June 23, 2025) 🔻 Primary Scenario: SHORT based on short-term bearish structure
Entry: $3,358–$3,360 (on POC retest + bearish rejection candle)
Stop Loss: $3,370
Take Profits:
TP1: $3,345
TP2: $3,343
TP3: $3,327
Probability: High, if price remains below POC
🔺 Alternative Scenario: LONG if price holds $3,343 support
Entry: $3,343–$3,345 (strong bullish candlestick setup in demand zone)
Stop Loss: $3,330
Take Profits:
TP1: $3,360 (POC)
TP2: $3,383
TP3: $3,398
⚠️ Risk Warning & Macro Factors to Watch
The USD Index is surging – applying downward pressure on gold
Fed's short-term rate projections (FedWatch Tool) reflect “no cut” expectations through Q3
Traders should maintain tight risk management within high-volume zones to avoid false breakouts
Follow @Henrybillion ” to stay updated with the most accurate and actionable XAUUSD trading ideas every day!

XAUUSD Long a bittake a bit buy on XAUUSD
long with RR 1:3
I just check the trend line and the FVG that filled at bottom.