Gold Spot (XAU/USD) Technical Outlook – 1H ChartGold Spot (XAU/USD) Technical Outlook – 1H Chart
📅 June 4th, 2025
📈 Analysis by mmozafari1357
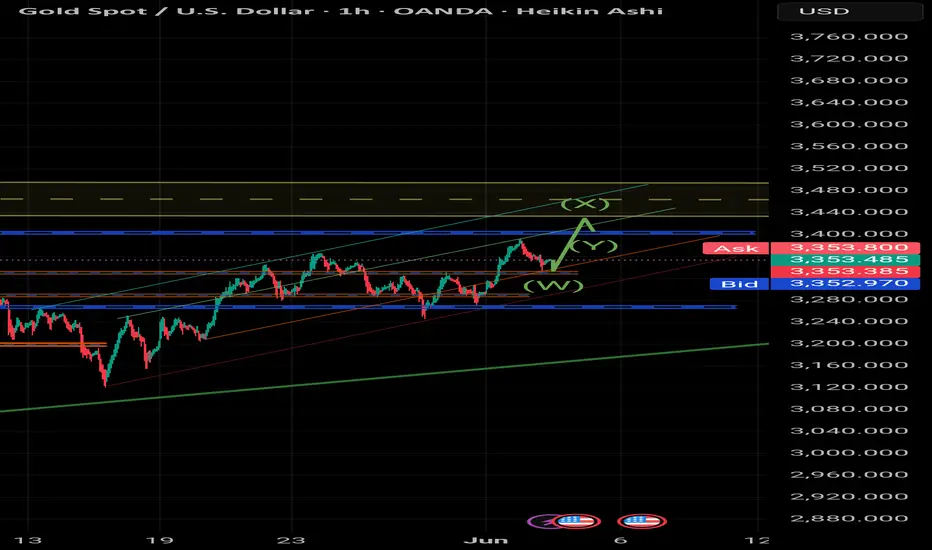
We are currently observing a complex WXY corrective pattern forming within a well-defined bullish channel on the 1H timeframe.
Wave W completed after a strong impulsive move from the lower support zone around $3,250.
Wave X is expected to extend higher and reach the $3,450–$3,470 resistance zone, which aligns with the upper boundary of the parallel channel and a historical supply area.
Currently, price seems to be forming wave Y as a retracement, creating a higher low structure before the anticipated bullish continuation.
🟢 Bias: Bullish continuation expected toward the $3,450 zone.
🔵 Key Levels:
Support: $3,320 – $3,335
Resistance: $3,420 – $3,470
This setup remains valid as long as price stays within the ascending channel and maintains higher lows.
---
🔖 Posted by: mmozafari1357
🧠 Stay patient, stay disciplined, and let the structure guide you.
Xauusdlong
Long orders have made profits, gold layout in the evening📰 Impact of news:
1. Economist: The Federal Reserve may cut interest rates sharply in December
2. Lee Jae-myung, candidate of the Democratic Party of Korea, was elected president of South Korea
📈 Market analysis:
Currently, the gold price is in a consolidation pattern, showing an overall volatile pattern during the day. The hourly Bollinger Bands are opening downward, and the MACD indicator is running in a dead cross. In the short term, the bears have a certain advantage. However, observing the 4H level, it can be found that the RSI indicator crosses when entering the overbought area, suggesting that the risk of a correction in the short term has increased. For evening operations, it is recommended to wait for the gold price to stabilize before entering the market, focusing on the important support of 3335-3325. If it obtains effective support and stabilizes in this range, the gold price may resume its upward trend. If it falls below 3325, the bullish momentum will be weakened. Therefore, it is recommended to wait for a pullback to 3335-3325 to go long in the US market, and look to 3350-3370 in the short term.
🏅 Trading strategies:
BUY 3335-3325
TP 3350-3370-3400
If you agree with this view, or have a better idea, please leave a message in the comment area. I look forward to hearing different voices.
TVC:GOLD FXOPEN:XAUUSD FOREXCOM:XAUUSD FX:XAUUSD OANDA:XAUUSD

Gold's correction does not alter the upward trendDuring Tuesday's Asian trading session, gold prices edged lower, primarily due to a modest rebound in the US Dollar Index from a six-week low and improved market risk appetite. The overnight rally in risk assets reduced demand for safe-haven assets, prompting some gold longs to take profits. However, caution remains prevalent across global markets, with factors such as the ongoing expansion of the US fiscal deficit, heightened US-China trade frictions, and the failure to reach an agreement in the second round of Russia-Ukraine peace talks continuing to underpin gold's safe-haven demand.
The market is currently in a state of tug-of-war between the US dollar's short-term rebound and the medium-to-long-term safe-haven demand, though multiple fundamental factors still favor gold, including rising geopolitical risks, intensifying trade tensions, expectations of accommodative Federal Reserve policies, and instability in the US fiscal position.
Traders should focus on the 3325–3335 support zone. If prices stabilize and rebound from this area, the first target could be 3380, followed by further attention to the previous high in the 3390–3400 region. A decisive break above this resistance level would warrant holding positions with a target above 3400.
Humans need to breathe, and perfect trading is like breathing—maintaining flexibility without needing to trade every market swing. The secret to profitable trading lies in implementing simple rules: repeating simple tasks consistently and enforcing them strictly over the long term.
Trading Strategy:
buy@3320-3330
TP:3370-3380

6/3 Gold Analysis and Trading SignalsGood morning, everyone!
Gold climbed to the 3370 area yesterday without showing any significant pullback, indicating that bullish momentum remains intact. After this morning’s opening, the price continued to rise, and from a technical perspective, there’s still room for further upside. The 3400 level is likely to be tested today, and if accompanied by increased volume, gold may extend gains towards the 3416–3438 resistance zone.
From a tactical standpoint, a technical retracement after today’s rally is the base case scenario, and intraday trades can be structured within the broader 3440–3320 range. On the downside, the 3368 level is the first key support to watch, followed by 3352, which could serve as a pivot area if a pullback occurs.
On the macro front, two economic data releases are scheduled during the US session, along with a Q&A session involving Fed’s Goolsbee, which could inject short-term volatility into the market.
📌 Trade Plan for Today:
Sell within the 3416–3438 zone, with controlled position sizing; short-term strategy preferred.
Buy near the 3338–3321 support area, with a defensive setup and tight risk control.
Flexible trading levels to monitor: 3421 / 3413 / 3397 / 3386 / 3367 / 3358 / 3343
Strategy outlook: Adopt a “sell high, buy dips” short-term strategy today. Avoid chasing breakouts blindly; focus on rhythm and structure.

XAU / GOLD Re-entry
🟡 Why Gold Has Been Buying:
Fundamentals:
Possible rate cut expectations from the Fed.
Geopolitical tensions or inflation concerns.
Weakening USD momentum.
Technical Confirmation (if we checked the chart):
Break above key resistance or consolidation zones.
Higher lows forming on the 4H and daily charts.
Volume supporting the breakout.
Let me break it down:
🔍 Technical Analysis Breakdown
1. Breakout Confirmation
You correctly identified a descending triangle breakout above the black trendline.
Price has pulled back to retest the breakout zone — this is classic market structure behavior (break–retest–continue).
2. Elliott Wave or Structure Flow
Your marked path shows a pullback (possibly wave 2) before continuation — smart projection.
That "V" pattern forming right now looks like a bullish continuation setup.
3. Fibonacci and Demand Zone
The retest aligns near the 38.2% or 50% retracement — high-probability reversal zones.
You also have a strong demand zone (grey box) acting as a support floor.
4. Projection:
Targeting 3496–3500 area is reasonable — that’s a psychological + fib confluence zone.
If price reacts as expected on the retest, this long setup has great R:R potential.
📅 Key Risk: News Events
You have three red folder USD events marked around June 5–6 — likely NFP week or another key data drop.
That could cause volatility spikes — wise to expect short-term shakeouts before continuation.
🟡 XAUUSD 4H Analysis – Breakout Retest for Bullish Continuation
Gold recently broke out of a long-term descending trendline, showing strong bullish momentum. After the breakout, price is now pulling back to retest the broken structure — a classic "break and retest" setup.
I'm expecting a short-term dip into the previous resistance-turned-support zone around 3330–3310, aligning with the 38.2–50% Fibonacci retracement and a key demand area.
🔵 Trade Plan:
Looking for bullish confirmation at the retest zone.
Targeting the 3496–3500 level (previous high + Fib extension confluence).
Bullish structure remains valid as long as price holds above 3300.
⚠️ Fundamental Note:
Upcoming high-impact USD news (NFP, etc.) may cause short-term volatility. Patience and tight risk management are key.
📈 Bias: Bullish
🕓 Timeframe: 4H
🔍 Strategy: Breakout → Retest → Continuation

Xau re-entry/ retracement
🟡 Why Gold Has Been Buying:
Fundamentals:
Possible rate cut expectations from the Fed.
Geopolitical tensions or inflation concerns.
Weakening USD momentum.
Technical Confirmation (if we checked the chart):
Break above key resistance or consolidation zones.
Higher lows forming on the 4H and daily charts.
Volume supporting the breakout.
Let me break it down:
🔍 Technical Analysis Breakdown
1. Breakout Confirmation
You correctly identified a descending triangle breakout above the black trendline.
Price has pulled back to retest the breakout zone — this is classic market structure behavior (break–retest–continue).
2. Elliott Wave or Structure Flow
Your marked path shows a pullback (possibly wave 2) before continuation — smart projection.
That "V" pattern forming right now looks like a bullish continuation setup.
3. Fibonacci and Demand Zone
The retest aligns near the 38.2% or 50% retracement — high-probability reversal zones.
You also have a strong demand zone (grey box) acting as a support floor.
4. Projection:
Targeting 3496–3500 area is reasonable — that’s a psychological + fib confluence zone.
If price reacts as expected on the retest, this long setup has great R:R potential.
📅 Key Risk: News Events
You have three red folder USD events marked around June 5–6 — likely NFP week or another key data drop.
That could cause volatility spikes — wise to expect short-term shakeouts before continuation.
✅ Verdict:
You're on the right track — this is a clean bullish setup.
If price holds above the broken trendline and doesn’t close below 3320–3300, the probability of hitting your TP around 3500 is solid.
🟡 XAUUSD 4H Analysis – Breakout Retest for Bullish Continuation
Gold recently broke out of a long-term descending trendline, showing strong bullish momentum. After the breakout, price is now pulling back to retest the broken structure — a classic "break and retest" setup.
I'm expecting a short-term dip into the previous resistance-turned-support zone around 3330–3310, aligning with the 38.2–50% Fibonacci retracement and a key demand area.
🔵 Trade Plan:
Looking for bullish confirmation at the retest zone.
Targeting the 3496–3500 level (previous high + Fib extension confluence).
Bullish structure remains valid as long as price holds above 3300.
⚠️ Fundamental Note:
Upcoming high-impact USD news (NFP, etc.) may cause short-term volatility. Patience and tight risk management are key.
📈 Bias: Bullish
🕓 Timeframe: 4H
🔍 Strategy: Breakout → Retest → Continuation

Gold retracement and consolidation is not a trend reversalJudging from the current 4-hour K-line pattern, the price broke through the previous high again after opening today, reaching a high of 3392. The trend of shock consolidation is maintained during the day, showing a slow correction trend. In the evening, it is necessary to wait for the price to show obvious signs of stabilization before trading with the trend. Focus on the support level of 3325-3335 below. The trading strategy at night is to choose a long position based on the correction range. If the price stabilizes and rebounds, the primary target above is 3380, and then further focus on the previous high of 3392-3400. If the resistance is effectively broken, the position can be continued and look above 3400. In terms of specific operations, it is recommended to consider establishing a long order when the price pulls back to the 3345-3355 range.
Operation strategy:
1. It is recommended to buy gold when it pulls back to around 3345-3355, with a stop loss at 3330, and a short-term view of 3360-3370, with a target of 3380-3400.

Long XAUUSD 15m – Long Trade Plan After Liquidity Grab📊 XAUUSD 15m – Long Trade Plan After Liquidity Grab
OANDA:XAUUSD
Hello Traders! 👋
Spotted a clean setup on Gold (XAUUSD) on the 15-minute chart, and I wanted to break it down for everyone looking to learn and grow with smart money concepts and liquidity-driven trading.
---
🔍 Trade Breakdown:
After a sharp bearish move, price aggressively broke below the Old High structure and formed a New Breakdown Low. This move likely triggered stop-losses and induced sellers — a classic liquidity grab scenario.
What followed is key:
Price tapped into a demand zone and showed clear rejection wicks.
It then consolidated just below the old structure — potentially accumulating orders for a reversal.
This gave me confidence to look for a long opportunity as part of my "Smart Money Reversal Strategy".
---
📌 Trade Plan Details:
Entry Zone: Around 3,358 – 3,360
Stop Loss: Below the recent low (~3,350)
Target 1: Previous structure resistance near 3,366 – 3,370
Target 2: Full range fill toward 3,389 – 3,390+
If price breaks and holds above the red supply zone, I’ll look for additional confirmation for scaling in or trailing.
---
🧠 Why This Matters:
This setup highlights the importance of:
Trading after liquidity sweeps, not during.
Recognizing how market makers trap early sellers before reversing.
Using structure and zones — not just indicators — to guide entries.
---
📘 Note for Members:
This trade is shared for educational purposes only. Always manage your risk and never blindly follow — plan your trades, then trade your plan!
Let me know your thoughts or how you'd approach this differently.
— Happy Trading! 💰
#XAUUSD #SmartMoney #LiquidityGrab #Forex #GoldAnalysis #TradingView

XAUUSD:Go long near 3360
Gold prices yesterday changed the pattern of shocks, in good news, all the way higher. Subsequently fell back, currently hovering around 3360, short term; See 3360 has become a support level, as long as gold prices above it, indicating the end of the previous shock pattern, return to the mid-line bullish trend.
Half - hour chart is strong, short - term trading strategy to do the main.
Trading Strategy:
buy@3360
TP:3370-73
↓↓↓ More detailed strategies and trading will be notified here ↗↗↗
↓↓↓ Keep updated, come to "get" ↗↗↗

XAUUSD Bullish Signal | Technical + Custom AlgoSmart Trend Signal | Technical Analysis + Custom Algorithm
This signal is the result of a combination of classic technical trend analysis and a proprietary software I personally developed.

Gold Reclaims 3300, Faces Heavy Resistance AheadGold surged after Monday’s market open, reclaiming the 3300 level, and has already made an initial attempt at the 3306–3312 resistance area, where the 2H MA60 lies. Short-term indicators have started to turn bullish, but several resistance levels lie ahead:
3306–3312: First major resistance
3326–3332: Next target resistance area
Around 3357: Previous gap zone, strong pressure
The upside is full of obstacles, and bulls will need strong momentum to push through.
Also, keep in mind:
Rapid upward moves are often followed by pullbacks. If the price retraces, pay attention to:
Support at 3288–3276
If this zone holds, further upside is likely
Watch for support/resistance role reversals:
A resistance level becomes support once broken
A support level becomes resistance once it breaks
Valid breakouts are confirmed when price stays above/below without immediate reversal
This is one of the most reliable and practical trading principles.
📉 Medium-Term Trend Still Bearish
The broader trend is still in a downward correction. Stay cautious and disciplined with short-term bullish moves.
📅 This week is loaded with key macroeconomic events, including:
PMI Manufacturing
ADP Employment
Non-Farm Payrolls (NFP)
Unemployment Rate
Fed-related speeches and economic commentary
Expect high volatility — great for profits if executed well, but dangerous if misjudged. Opportunities come with risks, so manage them wisely.

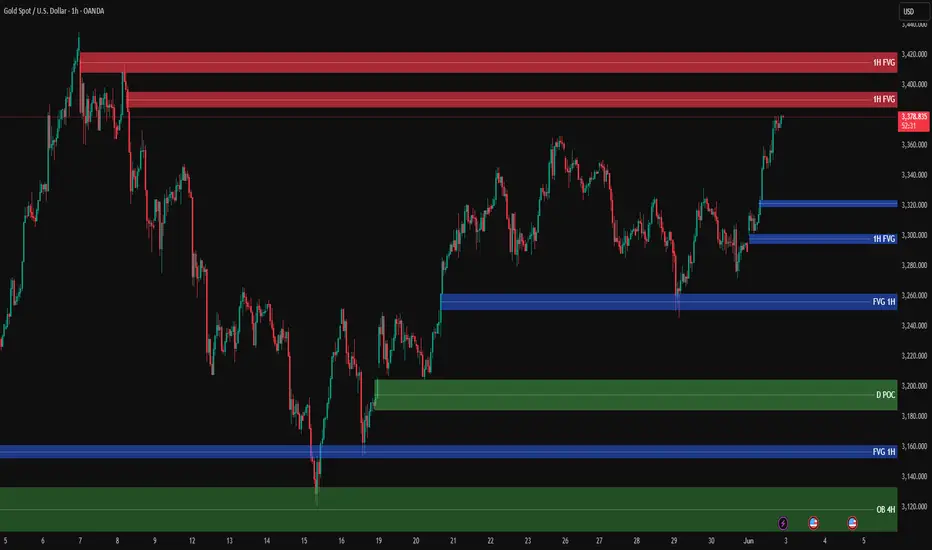
XAUUSD Analysis – 1H TimeframeGold is currently reacting to key resistance zones, and we are watching for signs of either rejection or breakout.
🔴 1H FVG Resistance Zones:
3408 – 3425
3386 – 3400
If price fails to break through these levels with momentum, we may see a downward move toward lower demand areas.
🔵 1H FVG Support Zones:
3323 – 3336
3276 – 3290
3242 – 3256
3152 – 3166
🟢 4H Order Block Support:
3100 – 3130
🟢 Daily POC (Developing POC):
3185 – 3200
📍 If price shows weakness here, we expect a retracement to the mentioned FVG or OB zones.
📍 At those levels, with the right confirmation (candle pattern or personal trigger), we’ll look for buy opportunities.
Your ideas?
Gold remains up at the beginning of this week
📌 Gold Consulting
Gold prices rose sharply on Monday, reaching their highest level in more than four weeks, affected by the escalation of geopolitical risks caused by the conflict between Russia and Ukraine. The re-escalation of trade tensions between China and the United States prompted investors to buy gold throughout the day. As of this writing, XAU/USD is trading at $3,377, up 2.70%.
Market sentiment turned sour on news that Ukraine launched an airstrike against Russia, destroying long-range bombers and other aircraft. Meanwhile, US President Trump doubled the tariffs on steel and aluminum imports to 50%, effective June 4, and his remarks against China led to a decline in US and global stock markets. CNBC
Reports said that Trump and Chinese President Xi Jinping may talk this week, but not on Monday.
📊Comment Analysis
Gold prices maintained their upward momentum at the beginning of this week, but tariff tensions and war with Russia remain unpredictable. Gold prices are supported and will return to the 3400 area.
💰Strategy Package
🔥Sell Gold Zone: 3409-3411 SL 3416
TP1: $3400
TP2: $3388
TP3: $3372
🔥Buy Gold Zone: $3313-$3315 SL $3308
TP1: $3327
TP2: $3340
TP3: $3355
⭐️ Note: Labaron hopes that traders can properly manage their funds
- Choose the number of lots that matches your funds
- Profit is 4-7% of the fund account
- Stop loss is 1-3% of the fund account

Gold: Two Clear Trading OpportunitiesGold surged to around 3390 after today’s open, but has since started to pull back. The current price is nearing the 30M chart MA60 support zone (around 3352), where a minor rebound may occur.
🔍 Short-Term Focus:
Resistance to watch: MA10 area at 3369–3378
Trading bias: Primarily short from higher levels
🌐 Main Considerations:
There's a large gap left open between 3289–3300, which poses a hidden downside risk.
Resistance remains dense above 3400, and the rally left behind potential to form a double top (M shape) or head-and-shoulders pattern.
Be cautious of bull traps and manage your positions wisely.
📌 Clear Trade Opportunities:
✅ Short above 3400
✅ Look for long entries below 3320
The current structure offers identifiable opportunities. Stay disciplined, manage your risk, and trade with confidence.

Bulls pressure, gold price grows 3409⭐️GOLDEN INFORMATION:
Gold prices rallied sharply on Monday, reaching their highest level in over four weeks, as geopolitical risks escalated over the Russia-Ukraine conflict. Renewed tensions on trade between the United States (US) and China prompted investors to buy the yellow metal throughout the day. At the time of writing, XAU/USD trades at $3,377, up by 2.70%.
Market sentiment shifted sour as news broke that Ukraine staged an aerial attack on Russia, which destroyed long-range bombers and other aircraft. Meanwhile, US President Donald Trump doubled down on tariffs over steel and aluminum imports to 50%, effective June 4, and rhetoric against China sent US global equities lower.
CNBC reported that Trump and China’s President Xi Jinping could speak this week, but not on Monday.
⭐️Personal comments NOVA:
Gold prices maintained their upward momentum at the beginning of the week, tariff tensions and the war with Russia remain unpredictable. Gold prices supported to return to the 3400 zone.
⭐️SET UP GOLD PRICE:
🔥SELL GOLD zone : 3409- 3411 SL 3416
TP1: $3400
TP2: $3388
TP3: $3372
🔥BUY GOLD zone: $3313- $3315 SL $3308
TP1: $3327
TP2: $3340
TP3: $3355
⭐️Technical analysis:
Based on technical indicators EMA 34, EMA89 and support resistance areas to set up a reasonable BUY order.
⭐️NOTE:
Note: Nova wishes traders to manage their capital well
- take the number of lots that match your capital
- Takeprofit equal to 4-6% of capital account
- Stoplose equal to 2-3% of capital account

GOLD H1 Intraday Chart For 3 June 2025Hello Traders,
GOLD is in mid term Bullish Trend for now as we already captured nice pips yesterday with directional sequence
but now all eyes on 3400 Psychological Level Breakout once it will break market will move towards 3430
for market in is consolidation zone between 3340-60 and expected to move back towards 3380 or even 90
if market breaks 3330 successfully today then it will move towards 3330 Psychological Level
Disclaimer: Forex is Risky

Gold (XAU/USD) Bullish Breakout Analysis – 30-Minute Chart. This chart shows a bullish breakout in Gold Spot (XAU/USD) on the 30-minute timeframe. After breaking above key resistance levels around the 3,325.000 zone, price action has shown strong upward momentum. The chart suggests a potential short-term pullback (as illustrated by the blue retracement path) followed by a continuation toward the projected target zone near 3,400.000. Multiple support zones (highlighted in green) now provide a solid base for potential buying opportunities. This setup, marked by volume confirmation and structure breakout, aligns with a bullish market sentiment.

XAU/USD Price Action Analysis – Bullish Breakout Setup XAU/USD Price Action Analysis – Bullish Breakout Setup 🚀
🔍 Chart Overview:
This chart illustrates the price movement of XAU/USD (Gold vs USD) on a mid-term time frame, highlighting a potential bullish breakout scenario from a key resistance zone.
🟩 Key Levels:
Support Zone: 🛡️
➤ $3,140 – $3,200
This zone has acted as a strong support multiple times, preventing further declines and serving as a springboard for bullish moves.
Breakout Zone (Current Level): ⚡
➤ $3,340 – $3,390
Price is currently testing this crucial resistance-turned-potential-breakout zone. A successful close above this level could confirm bullish continuation.
First Target: 🎯
➤ $3,435.87
This intermediate resistance aligns with a previously tested high. It may act as the first barrier after the breakout.
Second Target: 🥇
➤ $3,502.13
This is the major resistance zone. If bulls maintain momentum, this area will likely be tested.
🧭 Market Structure & Bias:
Price is forming higher lows, signaling growing bullish strength.
The chart shows a bullish breakout of a sideways consolidation zone.
The upward arrows and curved projection suggest a potential pullback-retest scenario at the breakout level before rallying towards targets.
🧠 Trading Plan (Illustrated by Chart):
📈 Breakout Entry:
Wait for confirmation above $3,390 with strong bullish candles and volume.
🔁 Retest Opportunity:
If price pulls back to the breakout zone ($3,340 – $3,390), this may serve as a solid re-entry point for long positions.
🎯 Profit Targets:
TP1: $3,435
TP2: $3,502
🛑 Invalidation:
A strong close back below $3,320 may invalidate the bullish bias.
📌 Conclusion:
The chart indicates a bullish continuation setup for XAU/USD with clearly defined breakout, retest, and target zones. Traders should monitor price action closely around the breakout area for confirmation before entering long positions. Risk management remains key. 🧮⚖️

Is there still room to chase long positions in gold?On Monday, gold prices surged more than 1.5%, hitting a new four-session high. After the European market opened today, spot gold prices advanced strongly, reaching an intraday high of $3,378 per ounce. This robust performance not only recouped part of last week's losses but also set the highest level in nearly four trading days. Market analysts generally agree that this rally is primarily driven by two major risk factors: the sharp escalation of the Russia-Ukraine conflict and fears of a trade war triggered by potential U.S. steel and aluminum tariff hikes. The financial markets are bracing for a thrilling week!
Comprehensive Trading Strategy:
For short-term trading of gold today, the recommended approach is to prioritize pullback long positions with counter-trend short positions as a secondary strategy.
Upward Resistance: Focus on the short-term resistance zone at $3,390-$3,400/oz.
Downward Support: Monitor the short-term support zone at $3,350-$3,340/oz.
Humans need to breathe, and perfect trading is like breathing—maintaining flexibility without needing to trade every market swing. The secret to profitable trading lies in implementing simple rules: repeating simple tasks consistently and enforcing them strictly over the long term.
Trading Strategy:
buy@3340-3350
TP:3390-3400

Trading opportunities after gold accelerates its rallyTechnical analysis:
Gold has risen sharply and has broken through the resistance areas near 3330 and 3355. In the short term, gold has formed an upward force and has a clear willingness to rise. At present, gold bulls still have the potential to continue to test the 3370-3380 area. As gold rises and breaks through, the 3340-3330 area below has become a strong support in the short term; if gold cannot fall below this support area during the retracement, gold may even continue to rise and try to hit the 3405-3415 area.
Trading strategy:
1. Consider going long on gold after gold retreats to the 3340-3330 support area, TP: 3360-3370;
2. Consider going short on gold in small quantities after gold first touches the 3370-3380 area, TP: 3355-3345.

XAUUSD Bullish Signal | Technical + Custom AlgoSmart Trend Signal | Technical Analysis + Custom Algorithm
This signal is the result of a combination of classic technical trend analysis and a proprietary software I personally developed.

6/2 Gold Analysis and Trading SignalsGood evening, traders!
Gold surged more than $70 today, reaching an intraday high of 3363.
If you held short positions from last Friday’s close based on my plan, I hope your SL protected you from major losses.
📉 Technical Insight:
The rapid rally has triggered overbought signals and correction pressure
Watch for pullback support levels at:
3342
3328–3321 zone
If these hold, price might retest 3400 tomorrow
🎯 Trading Plan:
📉 Sell around 3360–3372 (with tight stop)
📈 Buy near 3328–3318 (if price stabilizes)
🔁 Scalp zones:
3332 / 3338 / 3343 / 3352 / 3366

Gold: Bullish Flag Formation Suggests Further Upside Potential Hello guys, let's dive into Gold analysis!
Gold is currently forming a bullish flag pattern, a continuation formation that typically follows a strong upward impulse (flagpole). After a sharp rally, the price consolidated within a downward channel, creating the classic flag structure.
🔍 Technical Breakdown:
Flagpole: The strong bullish rally in early April marks the beginning of the uptrend.
Flag (Channel): Price has corrected in a downward-sloping channel, respecting both upper and lower bounds, creating a textbook flag pattern.
Breakout Zone: Price is now testing the upper boundary of the flag. A confirmed breakout above this resistance would signal a continuation of the prior uptrend.
🎯 Price Targets:
First Target: Around $3,445, which aligns with the measured move from the breakout point.
Second Target: Around $3,725, representing full flagpole projection from the breakout zone.
📌 Key Levels to Watch:
Breakout Confirmation: A strong 4H close above the flag’s upper boundary (~$3,260) with volume confirmation would validate the pattern.
_____________________________________
Invalidation: A rejection from the resistance and a fall below the channel may delay the bullish scenario, potentially retesting lower support around $3,090.
📊 Conclusion:
This setup favors bulls, but patience is key. Traders may consider waiting for a clear breakout and retest for safer long entries, aiming for the outlined targets.
