Gold 1D timeframe. What Next Moment?Hello everyone, I am back after 3 years. Finally I have decided to continue my trade journey in forex and crypto professionally.
Here is the analysis of XAUUSD/Gold.
Gold has taken a big bold moment of Uptrend since strong resistance breakout on march of 1st, 2024. Since that time Gold didn't looked back & continued it's rally in uptrend. So our major trend is Uptrend in 1D and 4H timeframe. Gold did some downtrend and sideway rally and again took another uptrend rally on Dec of 18th, 2024. Gold break all top high and made new high 3500.
If I talk in 1D timeframe gold is trading in bullish flag, and I am not wishing it right now to break upward. But has you know it is gold anything can happen. While today is Monday and market opening was in gap. So it needs to fill the gap after that we can execute a trade. Still now needs some confirmation that it will come down. So have patience and watch the market carefully.
Key point.
Resistance - 3356, 3369, 3396
Support - 3343, 3323, 3304
Any Query Reach Us or comment down
Rudra Vasaikar Wishes You A Great And Very Amazing Trading Life. Trade Safe, Trade Right.
RISK WARNING 🔴 🔴 🔴
There is high risk of loss in Trading Forex, Crypto, Indices, CFDs, Features and Stocks. Choose your trade wisely and confidently, please see if such trading is appropriate for you or not. Past performance is not indicative of future results. Highly recommended - Information provided by Pro Trading Point are for Educational purpose only. Do your investment according to your own risk. Any type of loss is not our responsibility.
HAPPY TRADING.
#gold #xauusd #xauusdtrading #goldtrading #goldanalysis #forextrading #forex #trendline #goldsignals #goldnews goldlatestanalysis #xauusdtradesetup #forextradingguide #fxgold
Xauusdlong

XAUUSD:BUYAfter the good news came out. XAUUSD followed my expectations. Continued to rise above 3300. The current quotation is 3317.
The tariff issue was released again over the weekend. Inflation fermented again, and the Russian-Ukrainian negotiations reached a tense and uncertain stage again.
Traders who followed me to buy near 3290 successfully made good profits.
Trading reference
XAUUSD:
Pressure position: 3360-3350
Support position: 3305-3295
BTCUSD:
Pressure position: 107000-106000
Support position: 103000-102000
This week, there is the impact of the release of non-agricultural data.
Usually divided into the front, middle, and back end of the triple impact. For traders, every time is a good trading opportunity. The impact is also very large.
This week, we will focus on the impact of news and the stimulation of news to layout the wonderful transactions of XAUUSD and BTCUSD. Remember not to trade independently to avoid losses. If you have any ideas, remember to leave a message to me and my assistant.

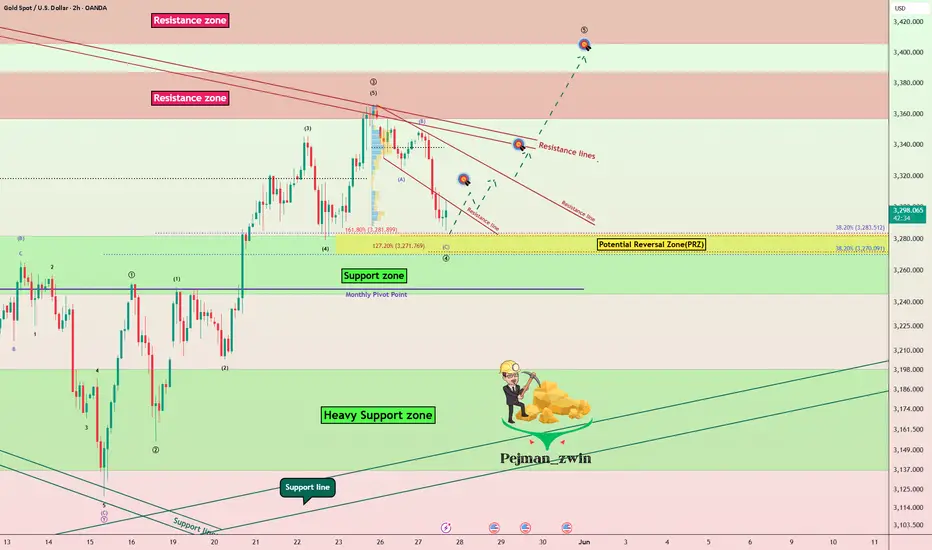
Gold Finds Support in PRZ – $3,337 in Sight? As I expected in my previous idea , Gold ( OANDA:XAUUSD ) moved towards the Support zone($3,280-$3,245) after breaking the lower line of the ascending channel.
Gold is moving near the Support zone($3,280-$3,245) , Potential Reversal Zone(PRZ) and Monthly Pivot Point .
In terms of Elliott Wave theory , Gold appears to be completing a main wave 4 . The structure of the main wave 4 can be complex . Confirmation of the end of the main wave 4 requires a break of the Resistance lines and Resistance zone($3,387-$3,357) .
I expect Gold to move up after entering the Potential Reversal Zone(PRZ) and the first target could be $3,314 and the second target could be $3,337 . If the momentum is high for Gold, you can consider higher targets for Gold to increase .
Note: If Gold touches $3,245 , we should expect further declines.
Gold Analyze ( XAUUSD ), 2-hour time frame.
Be sure to follow the updated ideas.
Do not forget to put a Stop loss for your positions (For every position you want to open).
Please follow your strategy; this is just my idea, and I will gladly see your ideas in this post.
Please do not forget the ✅' like '✅ button 🙏😊 & Share it with your friends; thanks, and Trade safe.
Gold hourly chart bears dominateFrom the gold 1-hour K-line chart, the current price continues to be suppressed by the key resistance level of 3325. This Friday, the Asian and European trading sessions showed a clear downward trend, reaching a low of 3271. The rapid rebound on Thursday easily induces investors to chase the rise, but the decline on Friday once again shows that there is a major market wash-out behavior. Given that the overall weak consolidation pattern on Friday is expected to face new downward pressure at the beginning of next week. At present, the gold 1-hour moving average system has turned to a short arrangement, and a golden cross signal has not yet been formed, indicating that the short momentum is continuing to accumulate. Therefore, I suggest adopting a rebound short trading strategy. If the price fails to break through the 3310 resistance level after the rebound, you can consider establishing a short position near this position next week to seize the opportunity to continue the short trend. Operational suggestions: Consider the layout of short orders after the price rebounds to the 3308-3312 range. This key area needs to be paid special attention.

Gold price recovers above 3300, tariff impact⭐️GOLDEN INFORMATION:
Gold prices (XAU/USD) edged higher to around $3,310 during early Asian trading on Monday, buoyed by renewed demand for safe-haven assets amid lingering tariff uncertainty and heightened geopolitical risks.
Investors remain cautious following fresh tensions between the United States and China, after President Donald Trump accused Beijing of breaching the terms of their trade agreement. This has rattled global markets and lent support to the precious metal. Market participants now turn their attention to the upcoming US ISM Manufacturing PMI report for May, scheduled for release later in the day, which could offer further direction for gold.
⭐️Personal comments NOVA:
US raises tariffs on EU steel, a reminder of quickly negotiated deals, gold prices positive above 3300
⭐️SET UP GOLD PRICE:
🔥SELL GOLD zone : 3335- 3337 SL 3342
TP1: $3328
TP2: $3315
TP3: $3300
🔥BUY GOLD zone: $3289- $3287 SL $3282
TP1: $3297
TP2: $3308
TP3: $3318
⭐️Technical analysis:
Based on technical indicators EMA 34, EMA89 and support resistance areas to set up a reasonable BUY order.
⭐️NOTE:
Note: Nova wishes traders to manage their capital well
- take the number of lots that match your capital
- Takeprofit equal to 4-6% of capital account
- Stoplose equal to 2-3% of capital account

Unmasking the "Intrinsic Value" Debate Between Gold vs BTCFool's Gold? Unmasking the "Intrinsic Value" Debate Between Gold and Bitcoin
The assertion is a familiar one, a well-worn cudgel in the ongoing debate between traditional assets and their digital counterparts: "Gold has intrinsic value that Bitcoin doesn't." This statement often serves as the bedrock for arguments championing the yellow metal's timeless appeal while dismissing cryptocurrency as mere speculative froth. But what if this foundational claim, this appeal to gold's inherent, undeniable worth, is built on shakier ground than its proponents believe? What if the very notion of "intrinsic value" as applied to these assets is a misunderstanding, a convenient narrative rather than an objective truth?
This exploration will journey into the heart of this debate, dissecting the concept of intrinsic value and examining how it truly applies – or doesn't – to both gold and Bitcoin. We will scrutinize gold's much-vaunted industrial utility against the backdrop of its vast above-ground stocks and its overwhelming monetary premium. We will consider whether value is indeed an inherent property of an object or a subjective judgment made by individuals. Ultimately, by challenging long-held assumptions, we aim to illuminate the real sources of value for both the ancient metal and the modern digital asset, moving beyond simplistic labels to a more nuanced understanding.
1. The Elusive Nature of "Intrinsic Value"
Before we can meaningfully discuss whether gold or Bitcoin possesses intrinsic value, we must grapple with the term itself. In the realm of corporate finance, "intrinsic value" refers to the fundamental worth of a company, derived from an analysis of its assets, earnings potential, cash flows, and overall financial health. It's an attempt to ascertain what a stock should be worth, independent of its fluctuating market price. This is the world of discounted cash flow models and balance sheet scrutiny.
However, this definition struggles when applied to commodities or currencies. Gold, like Bitcoin, does not generate cash flows. It doesn't pay dividends or have earnings reports. As one observer noted, gold and Bitcoin are commodities that have a spot price; their "value" is essentially what someone is willing to pay for them at a given moment. Companies, by contrast, can have an intrinsic value tied to the future economic benefits they are expected to produce for their owners.
So, when advocates claim gold has intrinsic value, they are often pointing to something else entirely. Usually, this encompasses its tangible, physical nature – you can hold it, feel its weight. It also refers to its historical use as money and a store of value over millennia. And crucially, it implies a baseline worth derived from its utility in practical applications, particularly in industry. One might even argue, as some have, that there is simply "no such thing as intrinsic value" in an absolute sense; value is not a property embedded within an object but is assigned to it by human beings.
2. Gold's Industrial Utility: A Gilded Facade?
The argument that gold's industrial use underpins its intrinsic value is perhaps the most frequently cited. "But it's used in microchips!" is a common, almost reflexive, defense. And it's true: gold's excellent conductivity, resistance to corrosion, and malleability make it a valuable component in high-end electronics, dentistry, aerospace, and certain medical applications. But the critical question is not whether gold has industrial uses, but how much these uses contribute to its overall market price.
Consider the data for a recent year, say 2024. Global industrial gold consumption was approximately 330 tonnes. However, a staggering 90% of this demand, around 297 tonnes, was met by recycling existing gold scrap, a process that can cost as little as tens of dollars per ounce. This leaves a mere 33 tonnes of new gold required from mining to satisfy the entirety of industrial needs not covered by recycling.
Now, compare this to the annual mine production. In that same year, about 3,700 tonnes of gold were newly extracted from the earth. This means that less than 1% (33 tonnes out of 3,700 tonnes) of all newly mined gold was actually needed for industrial purposes. The vast majority, over 99%, went elsewhere – primarily into jewelry, bars, and coins, all forms of value storage.
The disparity becomes even more dramatic when we consider the total above-ground stock of gold held for these value-storage purposes. This figure stands at roughly 184,000 tonnes. If, hypothetically, gold were to suddenly lose its allure as jewelry and its status as a monetary asset, and this colossal hoard were redirected to meet industrial needs (the 33 tonnes per year not covered by recycling), we would have enough gold to last for approximately 5,600 years at current industrial consumption rates. And this is without digging a single new ounce out of the ground. Much of this 184,000-tonne supply could potentially be acquired at prices far closer to the low cost of recycling than the current market price of newly mined gold.
As one commenter aptly put it, if gold's value was solely based on industrial demand, it "would be nearly worthless" compared to its current valuation. While gold does possess certain unique properties that make it useful, these applications are a drop in the ocean when explaining its price. The idea that its utility in microchips or dental fillings provides a significant "floor" for its value is, upon closer inspection, largely a myth.
3. The Towering Monetary Premium: Where Gold's Value Truly Lies
If industrial use accounts for such a tiny fraction of gold's demand and price, what explains the rest? The answer is its "monetary premium." This is the portion of an asset's price that exceeds its direct use-value as a commodity. For gold, this premium is immense, built over centuries of human history and cultural adoption.
Gold's journey as money began thousands of years ago. Its inherent characteristics – it doesn't rust or tarnish (durability), it's relatively rare (scarcity), it's easily recognizable and has a pleasing aesthetic (acceptability), it can be melted and reformed (divisibility and fungibility), and it's dense (portability of value) – made it a superior choice for a medium of exchange and store of value in pre-industrial societies. This long history has ingrained gold into the collective human consciousness as something inherently valuable. There's a certain "magical power," as one person described it, to the shiny yellow metal, a testament to its enduring legacy.
This historical precedent and the deep-seated belief in its enduring worth are what sustain gold's monetary premium. Central banks hold it in their reserves. Individuals purchase it in the form of jewelry (which, in many cultures, serves as a primary store of family wealth) and invest in bars and coins, not primarily for its practical applications, but because they trust it will preserve purchasing power or be desired by others in the future. This shared belief, this social consensus, is the bedrock of gold's value far more than its limited industrial applications. Some estimate this monetary premium to be as high as 90% of its total price, with the remaining 10% attributable to its use in jewelry and industry.
4. The Shifting Sands of Perceived Value
The notion that value is intrinsic and immutable is challenged by history itself. Value, as many economists and observers contend, is not an inherent property of an object but is determined by human perception and utility, which can and do change over time.
Consider aluminum. There was a time when aluminum was exceedingly rare and difficult to extract, making it more precious than gold. The capstone of the Washington Monument, completed in the late 19th century, was made of aluminum to signify its value and the technological prowess of the era. Today, thanks to advancements in refining processes, aluminum is abundant and inexpensive. We use it to wrap sandwiches, a far cry from its days as a "precious" metal adorning national monuments.
Similarly, Tyrian purple dye, derived from sea snails, was once so costly and labor-intensive to produce that its use was reserved for royalty and the highest echelons of society. It symbolized power and status. The invention of synthetic dyes in the 19th century made purple accessible to everyone, and the immense value once attached to the natural version evaporated.
These examples powerfully illustrate that what society deems valuable is not fixed. It is contingent on factors like scarcity (natural or artificial), the current state of technology, cultural significance, and collective human agreement. If gold's value is predominantly a monetary premium built on historical consensus and aesthetic appeal, then it too is subject to these shifting sands of human perception. The humorous desire to one day wrap sandwiches in gold foil, should it lose its monetary status, underscores this potential for radical revaluation.
5. Bitcoin's Utility: Solving Problems of the Digital Age
If gold's claim to "intrinsic value" through industrial use is tenuous, and its primary value stems from a historically constructed monetary premium, how does Bitcoin compare? Critics often dismiss Bitcoin as having no utility beyond speculation, a digital tulip mania. However, this perspective often overlooks the specific problems Bitcoin was designed to address and the unique properties it offers in the 21st century.
Bitcoin emerged in the wake of the 2008 financial crisis as a "peer-to-peer electronic cash system," aiming to provide an alternative to the traditional financial system. Its utility lies in its ability to offer:
• Decentralization: No single entity, corporation, or government controls the Bitcoin network. It operates on a distributed ledger (the blockchain) maintained by thousands of computers worldwide. This makes it resistant to control or shutdown by any central authority.
• Permissionless Access: Anyone with an internet connection can participate in the Bitcoin network – send, receive, and store value – without needing permission from a bank or government.
• Censorship Resistance: Once transactions are confirmed and added to the blockchain, they are extremely difficult to alter or reverse. This makes it a powerful tool for individuals in environments where financial censorship is a concern.
• Provable Scarcity: The Bitcoin protocol dictates that there will only ever be a maximum of 21 million bitcoins. This hard cap on supply is a fundamental aspect of its design, making it a verifiably scarce digital asset. This contrasts with gold, where new supply is continuously mined each year, estimated by some to be around 1.5-2% of the existing above-ground stock, arguably diluting its value over time.
• Portability and Divisibility: Bitcoin is incredibly portable. Vast sums can be "carried" on a tiny device or even memorized as a seed phrase, and transferred across the globe in minutes for relatively low fees. It is also highly divisible, down to one hundred millionth of a bitcoin (a "satoshi"), facilitating transactions of various sizes.
• Verifiability: The authenticity and transaction history of every bitcoin can be publicly verified on the blockchain, eliminating the need for trust in intermediaries for this purpose.
• Durability: As a digital asset secured by a vast, decentralized network, Bitcoin is highly durable as long as the network itself remains operational and secure.
A crucial real-world utility, highlighted by observers, is Bitcoin's ability to bypass capital controls. For individuals in countries with restrictive financial regimes, Bitcoin offers a means to transact and move value across borders with a degree of freedom not possible through traditional channels. This is not a speculative feature; it is a tangible benefit solving a real problem for many.
While the number of people using Bitcoin worldwide is still relatively small compared to users of traditional financial systems, its adoption is growing. Like any transformative technology, its utility is being discovered and leveraged by an expanding user base. Its "intrinsic value," if we are to use that term, lies in its capacity to fulfill these unique functions.
6. Gold vs. Bitcoin: A Clash of Properties
When we compare gold and Bitcoin based on properties often associated with a store of value or monetary good, distinct profiles emerge:
• Tangibility: Gold is physical; you can touch it. This offers a psychological comfort that some find reassuring. Bitcoin is digital; its existence is as code and ledger entries. Its "possession" is through control of cryptographic private keys.
• Industrial Utility: Gold has limited industrial uses that account for a tiny fraction of its price. Bitcoin's "industrial utility" is the operation of its network as a global system for value transfer and verification.
• Scarcity: Gold is naturally scarce, but its total earthly and cosmic abundance is unknown, and new supply is constantly mined. Bitcoin has absolute, programmable scarcity with a fixed supply cap.
• Portability: Moving large amounts of gold is cumbersome, expensive, and risky. Bitcoin is exceptionally portable.
• Divisibility: Gold can be physically divided, but it's not a seamless process. Bitcoin is easily and precisely divisible.
• Verifiability: Authenticating gold requires specialized knowledge and tools; it can be faked. Bitcoin transactions and holdings are verifiable with mathematical certainty on its public ledger.
• Durability: Gold is physically very durable. Bitcoin, as a digital protocol, is durable as long as its decentralized network is maintained and secured.
• Historical Precedent: Gold boasts millennia of use. Bitcoin is a little over a decade old, a mere infant by comparison.
• Censorship/Seizure Resistance: Physical gold can be, and has been, confiscated. Self-custodied Bitcoin, with properly secured private keys, is highly resistant to censorship and seizure.
This comparison reveals that while gold's strengths lie in its long history and physical presence, Bitcoin excels in areas like absolute scarcity, portability, divisibility, verifiability, and censorship resistance – attributes that are arguably increasingly valuable in an increasingly digital and interconnected global landscape.
7. The "Next Person" Fallacy and the Foundation of Value
A common critique leveled at both gold (for its monetary premium) and Bitcoin is that their value depends solely on "the next person being willing to buy it." In a sense, this is true for any asset that isn't consumed directly or doesn't produce cash flows. The value of a collectible, a piece of art, or indeed a monetary good, is ultimately what someone else is prepared to exchange for it.
However, this doesn't mean their value is arbitrary or baseless. The willingness of the "next person" to buy is predicated on a shared understanding or belief in the asset's desirable properties and its potential to retain or increase its value. For gold, this belief is built on thousands of years of tradition and its perceived enduring qualities. For Bitcoin, this belief is growing based on its unique technological attributes, its potential to solve modern financial problems, and its emerging network effects. The more people who recognize and utilize these properties, the stronger the shared belief, and thus the more robust its value becomes.
8. The Cost of Production and the Illusion of a Price Floor
Some argue that gold's price cannot fall below its cost of extraction, suggesting this provides a natural price floor. While it's true that miners would cease operations if the price fell below their production costs for a sustained period, this argument largely ignores the colossal 184,000 tonnes of gold already above ground and held primarily for monetary or aesthetic purposes. If this massive hoard were to lose its monetary premium and be dumped onto the market, the price could plummet dramatically, far below current mining costs, until it reached a level where industrial demand (or perhaps a new, much lower equilibrium for aesthetic use) could absorb it. Much of this existing stock could be made available at recycling costs, which are significantly lower than mining costs. The "cost of production" floor applies primarily to newly added supply, not to the revaluation of existing, hoarded stock.
Conclusion: Beyond Intrinsic – Value in Utility and Belief
The debate over whether gold has "intrinsic value" that Bitcoin lacks often misses the mark by clinging to a nebulous and misapplied concept. If "intrinsic value" refers to a baseline worth derived from non-monetary, practical utility, then gold's claim is surprisingly weak. Its industrial applications are minimal compared to its price, which is overwhelmingly a monetary premium built on centuries of human belief, cultural acceptance, and its historical role as money.
Value, ultimately, is not an inherent property magically residing within an object. It is a subjective judgment made by individuals, a reflection of an asset's perceived utility and the collective belief in its future desirability. Gold has served humanity well as a store of value due to a set of physical properties that were optimal for pre-digital eras. Bitcoin, a product of the digital age, offers a different set of properties – provable scarcity, decentralization, censorship resistance, and unparalleled portability – that address the challenges and opportunities of our modern world.
Neither gold's sheen nor Bitcoin's bits possess a mystical "intrinsic value" independent of human perception and use. Gold's value is rooted in its long history and the enduring human affinity for its beauty and permanence. Bitcoin's burgeoning value is rooted in its innovative technology and its potential to offer a new paradigm for money and value transfer. Both are valuable because, and only because, people believe them to be. The critical difference lies in the reasons for that belief and the problems each asset is perceived to solve. As the world continues to evolve, so too will our understanding and assignment of value.

Bearish Trend Likely on MondayLast week, the U.S. once again carried out a wave of long-short double killing on the issue of tariff suspension 📉. Capitalists successfully carried out capital plundering before the end of last Friday, leading to insufficient bullish momentum at the opening of next week and a possible continued downward trend ⬇️. At the opening on Monday, our primary view is bearish
⚡️⚡️⚡️ XAUUSD ⚡️⚡️⚡️
🚀 Sell@ 3290
🚀 TP 3270 - 3260
🚀 Buy@ 3250 - 3260
🚀 TP 3290 - 3310

XAU/USD Gold short to long ideaIn this week’s analysis, price is currently positioned between a few key zones where we could expect reactions. Given the overall bullish trend, we’ll be using the broader bias to guide our setups, but there’s also opportunity for tactical short-term plays.
Recently, price has shown strong bearish structure, forming new supply zones such as the 6H supply, which is now close by. If price reacts from this level, there’s potential for short-term sells targeting the clean 9H demand zone below — a solid area where I’ll be looking for a possible Wyckoff accumulation and bullish continuation with the trend.
Confluences for GOLD Shorts:
- Recent strong bearish structure and downside moves
- Significant liquidity and imbalance to the downside
- Well-defined 6H supply zone has formed nearby
- Market appears overbought, and bearish pressure is becoming more visible
- For long-term bullish continuation, price may need to revisit the demand zone below
P.S. If gold pushes higher first and sweeps the liquidity above, I’ll be watching closely for signs of Wyckoff distribution before considering any short-term sell setups. Patience is key — let the market show its hand before reacting.

GOLD H4 Weekly Chart Update For 2-6 June 25Good day Traders,
as you can see that there are important zones mentioned
right now market is in sideways, key resistance zone for the upcoming week is 3350-70, market breaks resistance zone then it will move towards 3430
key support zone is 3240-50 for now, if market breaks support zone then it will move towards 3200 or even 3150
always Trade with SL
Disclaimer: Forex is Risky

5/30 Gold Analysis and Trading SignalsGood morning everyone!
Yesterday, we successfully executed short at 3290 and long at 3250, and also entered the 3316–3328 short zone near the close. All signals were hit, and profits were solid ✅.
📉 Technical Outlook:
The 1-hour chart remains in a clear bearish trend, indicating that this pullback is not yet complete.
Initial support at 3296 is very likely to break
Focus shifts to 3278 support, though it appears technically weak
If price hits 3278, a minor bounce is expected, but it's likely just a retracement, not a reversal
🗞 Fundamental Watch:
The U.S. Consumer Confidence Index will be released during the U.S. session today.
Market reaction is expected to be similar to yesterday’s initial jobless claims — possibly triggering short-term moves, but not changing the broader trend.
📈 Trade Plan for Today:
📉 Sell in the 3316–3328 zone (key resistance)
📈 Buy in the 3238–3221 zone (key support area)
🔁 Scalp/flexible trading zones:
3303 / 3288 / 3276 / 3265 / 3252 / 3238
Stick to proper risk management, and stay alert during U.S. data releases.
Trade with the trend and close the week strong!
Additionally, on the 30-minute chart, gold appears to be forming a potential inverse head and shoulders pattern. If this pattern completes and breaks the neckline successfully, the price may surge toward the 3336–3352 area, or even up to 3360.
For those considering short positions, it’s crucial to control position size and avoid entering too early. Try to wait for price action to reach higher resistance levels before making a move. Don’t worry about missing a perfect entry — even if one trade is missed, it won’t affect your overall profitability for the week.
The market always offers opportunities. Stay calm, stick to your strategy, and remember: consistency and patience lead to long-term success.

It seems calm, but there are actually undercurrents!Today, the monthly, weekly and daily lines closed simultaneously. At the same time, the PCE data will be released during the US trading session, and the market volatility may intensify.
From a technical point of view, 3285 is also the key to long and short today. If gold does not break 3285 today, the strength of gold bulls is expected to continue, and there is still room for gold to move upward. If gold continues to fall and falls below 3285, then gold may begin to fluctuate in a large range. The upper resistance is in the 3320-3330 area, and the focus is on the 3335-3340 line of suppression. Pay attention to the 3290-3285 line of support below, and the key position below is in the 3280 area. If it breaks below the 3280 area during the day, the market is expected to fall again to the 3265-3250-3240 area.

Gold price recovers with PCE news?⭐️GOLDEN INFORMATION:
Gold prices rebounded from weekly lows near $3,245 and surged past the $3,300 mark on Thursday, buoyed by a weaker-than-expected U.S. jobs report and optimism following a U.S. court ruling that halted President Donald Trump’s proposed tariffs. At the time of writing, XAU/USD is trading at $3,318, up 0.94% on the day.
The rally was fueled by data from the U.S. Department of Labor showing that jobless claims rose more than forecast, surpassing both market expectations and the previous week’s figures—an indication of potential softening in the labor market that weighed on the U.S. Dollar and boosted demand for safe-haven assets like gold.
⭐️Personal comments NOVA:
Price zone 3300, gold price accumulated in the past 2 weeks. waiting for fluctuations from tariffs
⭐️SET UP GOLD PRICE:
🔥SELL GOLD zone : 3363- 3365 SL 3370
TP1: $3352
TP2: $3340
TP3: $3328
🔥BUY GOLD zone: $3280- $3282 SL $3275
TP1: $3290
TP2: $3300
TP3: $3310
⭐️Technical analysis:
Based on technical indicators EMA 34, EMA89 and support resistance areas to set up a reasonable BUY order.
⭐️NOTE:
Note: Nova wishes traders to manage their capital well
- take the number of lots that match your capital
- Takeprofit equal to 4-6% of capital account
- Stoplose equal to 2-3% of capital account

Gold Poised for a Breakout After Sideways ConsolidationGold has retraced to the 3300 level and remained range-bound for an extended period. This prolonged consolidation suggests that a sharp breakout may be imminent, with the next move — whether up or down — likely to be swift and volatile.
Looking at the 2-hour chart, the current price structure is complex. It could be interpreted as a potential double top, but it also resembles the early formation of an inverse head and shoulders, which makes trading decisions more challenging.
From a technical standpoint:
Moving averages are aligned in a bearish setup, and the area above remains densely packed with resistance.
MACD on the 2H chart shows a bearish crossover, signaling a potential continuation of the downtrend.
However, on the 30-minute chart, MACD shows some short-term bullish momentum, with the next resistance near 3306.
For bulls, if the price attempts to rise toward the 3306–3312 zone but then quickly pulls back, this would indicate weak buying pressure, and caution is advised.
In summary, short-term signals are bullish, but the medium-term trend remains bearish. With the market in a sideways range, it's best to remain patient and watch for breakout signals. The two trading opportunities shared yesterday remain valid and worth monitoring closely.

Smart Trade Insight – XAU/USD Technical BreakdownKey Levels & Technical Zones:
🔹 Resistance Zone (🔼 SELL Area):
📌 3,315 – 3,340
This area has been tested and rejected multiple times, as highlighted by the strong bearish wicks. The recent price action failed to break above it, triggering short interest.
🔹 Minor Support Zone:
📌 Around 3,243
Acted as intraday bounce area previously, now likely to offer weak support in the coming move down.
🔹 Major Demand Zone (💚 BUY Interest Zone):
📌 3,120 – 3,140
Labelled as "BEST SUPPORT DEMANDING ZONE" – historical demand visible with strong bounce history. Ideal for monitoring bullish reversal opportunities.
📈 EMA Levels:
🔴 50 EMA: 3,299
🔵 200 EMA: 3,254
Current price action is hovering near the EMAs. The rejection at the resistance while below the 50 EMA indicates weakening bullish momentum.
🔍 Market Structure Overview:
The double-top formation near the resistance shows exhaustion in buying.
Lower highs forming → structure turning bearish short-term.
Solid rejection confirms that this is a valid zone to initiate short positions 🛑📉.
📉 Forecast Path:
🔮 Projected Move:
Price is expected to break below minor support at 3,243.
Intermediate target: 3,206, then 3,167 🟠.
Final destination: Demand Zone at 3,120 – 3,140 🟩 for potential bounce 📈.
💬 "Market not break the resistance level and rejected solid — this is a good entry for short-term sell trades." ✅
✅ Trade Idea Summary:
🟥 Bias: Short
🎯 TP Targets: 3,206 → 3,167 → 3,122
📉 SL Suggestion: Above 3,340 resistance zone
🧭 Risk-Reward Setup: Favorable for short-term traders

XAUUSD Bullish Signal | Technical + Custom AlgoSmart Trend Signal | Technical Analysis + Custom Algorithm
This signal is the result of a combination of classic technical trend analysis and a proprietary software I personally developed.

Gold Price Action Update – Smart Dip Buy Pays Off!Yesterday, gold dipped to around 3290, followed by a minor rebound.
Today, as expected, it broke down through the 3280 level decisively—just as we discussed:
🔻 A break below 3280 likely means a gap fill toward 3259.
✅ For those who followed the plan and went long below 3266, the trade worked beautifully—
Gold dropped to a low of 3245, effectively filling the gap, and has since rebounded back to the 3280 area.
📈 What’s next?
Now that the gap is filled, gold is likely to retest the $3300 zone in the short term.
With price currently around 3280, there is still room to the upside.
➡️ If you're holding long positions, you can consider holding a bit longer for potential further gains.
🚨 BUT—this was only a single bottom test.
That means there's still a chance of a second dip before the trend fully reverses. So:
🛡 Risk management remains crucial.
If you're okay with some profit pullback, it's fine to stay in.
If not, consider securing partial profits and setting trailing stops.
🎯 Key levels to watch:
🔼 3300 – Main resistance zone; focus on whether it breaks or rejects;
🔽 3276–3263 – Support range on any pullback; good zones to watch for fresh entries if support holds.
📌 Trading Strategy Outlook:
For now, continue to buy on dips as long as support holds, and monitor 3300 resistance closely.
If price fails to break above, we may see a pullback—but as always, with proper planning, we stay profitable.

XAUUSD trading plan for the London market.After buying at a low level yesterday, the market rebounded and continued to fall. Today, the Asian market hit a low of 3208.
At present, geopolitical uncertainties are increasing. I think buying is still a reasonable choice. Buy near 3210-3200. The target is 3235-3248. It is necessary to observe whether the target is stabilized.
Remember to control trading risks when trading independently.

XAUUSD buying opportunitiesToday, I am adapting to low buy operation again. Yesterday, the lowest price in New York market reached 3278, and today the lowest price in Asian market hit the low near 3245. But with the addition of buy orders, the profit has expanded a lot again.
XAUUSD market quotation is 3298. This position can still be arranged for buying. Do not trade independently. Remember to leave me a message. Pay attention to the subsequent precise trading opportunities.

XAUUSD Bearish Signal | Technical + Custom AlgoSmart Trend Signal | Technical Analysis + Custom Algorithm
This signal is the result of a combination of classic technical trend analysis and a proprietary software I personally developed.

Gold Strategy Update — Professional Trading InsightGold dipped to around 3290, then rebounded to 3310, followed by another pullback toward the 3290–3280 region and bounced again. This price action perfectly aligned with our forecast and trading plan.
👉 If you followed today's strategy, you should be in solid profit once again!
📍 Current Market Structure Analysis:
🔹 Gold is now hovering near 3300, which is a key resistance zone.
Our previously identified support area at 3306–3318–3324 has been broken and is now acting as resistance.
🔹 Among these levels:
3306 is a weaker resistance,
While the 3316–3323 zone is the main barrier to watch.
📊 Based on the 30-minute chart, bullish momentum appears limited:
If the price rebounds in a single leg, it is likely capped around 3318–3324,
→ With an 80%+ probability of a pullback from that zone. A reasonable short-term target would be 3312;
However, if gold builds a double bottom or multiple bottom structure, it may gather more strength,
→ And a broader rebound could reach 3332–3338.
📉 Bearish Structure Repair (2H Chart):
On the 2-hour chart, the previous bearish structure has been mostly corrected by the recent drop;
The next key factor is whether bulls can break above 3320 to confirm a reversal.
🟥 If bulls fail to break 3320 and price drops below 3280, it may open the door for bears to close the gap around 3259.
→ In that case, levels below 3266 will present excellent buy opportunities.
📊 Trading Summary:
Although market volatility has slightly decreased in recent days, there are still plenty of solid trading opportunities, and we continue to profit steadily.
✅ As long as you stick to a proven strategy, strong discipline, and flexible execution, you’ll find that no matter how the market moves, our profit curve will keep climbing.

The golden range strategy continues to workGold bottomed out and rebounded as expected today. Friends who follow me should be able to clearly feel that I have been insisting on analyzing the trend of "bottoming out and rebounding" recently. Today, gold opened at 3300, and rebounded after the lowest price fell to around 3291. So far, the highest price has reached 3325. Overall, the support below gold is still strong, but the suppression above cannot be ignored. Therefore, the market performance yesterday and today was relatively stable, with small fluctuations as the main trend.
In terms of operation ideas, continue to pay attention to the support level of 3290-3295. If it falls back and does not break, maintain a bullish mindset. At present, the long orders in the 3290-3295 range have been notified to enter the market as planned, and are currently in the profit stage. If you encounter difficulties in the current gold market operation, I hope my analysis can help you. Welcome to communicate at any time.
From the 4-hour cycle chart, the support below gold is around 3290-3295, and the pressure above is concentrated in the 3330-3340 range. In the short term, the watershed between long and short is around 3275-3283. Before the daily level effectively falls below the watershed, it is still in a long-short shock pattern, maintaining the main theme of "high-altitude and low-multiple" cycle participation.
Gold operation strategy: If gold falls back to the 3290-3295 line, you can try to go long. If it further falls back to the 3280-3285 line, you can consider covering long orders, and the target is around 3316-3320.

5/29 Gold Analysis and Trading SignalsGood morning everyone!
Yesterday, gold rose first and then declined. Our long positions targeting 3318–3326 were completed successfully, and we timely shifted to short positions, resulting in another round of solid profits.
📉 Technical Outlook:
Gold remains in a bearish trend, and is now very close to the 3275 support level. Based on the current price structure, a break below this level is highly probable.
If $3275 is breached, focus on key support at 3258–3238
Resistance levels to watch: 3298–3318
The daily (1D) chart is currently in an indicator correction phase, so today's trading bias is selling from higher levels
🗞 News Focus:
Watch for U.S. initial jobless claims data today. It may offer short-term support for gold, but is unlikely to reverse the broader bearish trend.
📈 Today’s Trade Plan:
📉 Sell in the 3316–3328 zone (resistance zone)
📈 Buy in the 3245–3232 zone (key support area)
🔁 Scalp/flexible trading levels:
3303 / 3288 / 3276 / 3258 / 3247
Stay adaptive and combine news with price action at key levels for best results.
Wishing everyone a successful and profitable trading day!

Gold shocks extreme pull, US market layout🗞News side:
1. Musk issued the "strongest" condemnation of Trump
2. Trump and Netanyahu failed to reach an agreement, and the US-Iran negotiations may be "disrupted" by Israel
📈Technical aspects:
The trading strategy we have given is still valid. The current gold price trend on the hourly chart shows a standard descending flag pattern. If this pattern continues to be effective, there is a high possibility that the gold price will fall below 3285-3280. Once it falls below this range, as we gave in the strategy this morning, it may fall to the 3260-3250 line. However, the premise for this expectation to be established is that the gold price cannot break through and stabilize on the upper track of the consolidation channel, otherwise the descending flag pattern will be invalid. Therefore, for US market operations, short positions can be arranged around the upper rail of 3325, paying attention to the suppression effect; for the lower rail, first pay attention to the support effect of 3300.
sell 3325-3330
TP 3310-3300
buy 3290-3280
TP 3310-3320
If you agree with this view, or have a better idea, please leave a message in the comment area. I look forward to hearing different voices.
FOREXCOM:XAUUSD FXOPEN:XAUUSD TVC:GOLD FX:XAUUSD OANDA:XAUUSD
