Rebound after hitting bottomToday, gold opened at a low of 3331 and rebounded, and reached a high of 3356 and then stepped back to adjust. The overall trend is the same as our weekend analysis. Last week, the overall technical side of gold continued to fluctuate upward with bullish momentum. The daily level repeatedly tested and stabilized at the 3200 mark at the beginning of the week, ushering in a bullish upward momentum. On Friday, it continued to fluctuate upward with bullish momentum relying on the 3280 mark throughout the day, forming a reverse medium-sized positive. The daily K-line closed with a shock upward breakout of the medium-sized positive. The overall gold price continued to fluctuate upward with bullish momentum in the short term, and it is still bullish.
From the 4-hour market analysis, pay attention to the 3378-80 line of suppression on the top, pay attention to the 3320-25 line of short-term support on the bottom, and focus on the 3300-3306 line of support. Rely on this range to maintain the main tone of low-multiple participation temporarily. In the middle position, watch more and do less, be cautious in chasing orders, and wait patiently for key points to enter the market.
Gold operation strategy:
1. Go long on gold when it falls back to 3320-3325, stop loss 3307, target 3366-3370, break to see 3378-85
Xauusdlong

Gold bulls advance as expected Mainly go long on pullback.Today, gold opened lower and fell, reaching the lowest level of 3331. Then the bulls exerted their strength, reaching the highest level of 3356 and then adjusted back. The overall trend was highly consistent with the expected judgment. Looking back at the market last week, the technical side of gold continued the bullish pattern, and the oscillating upward trend was significant. From the daily level, the price repeatedly tested around the 3200 mark at the beginning of the week, and finally stabilized successfully, laying a solid foundation for the bull market. On Friday, it was supported by the 3280 mark, continuing the strong oscillating upward trend, forming a reverse middle Yang pattern, and the daily K line closed with an oscillating upward break of the middle Yang, fully demonstrating the short-term bullish pattern of gold prices, and bullish expectations continued to heat up.
Based on the current gold trend analysis, the focus below is on the 3330-3320 range support, and the focus above is on the 3380-3400 resistance. In terms of overall strategy, the bullish thinking is maintained before breaking 3320 to avoid blindly guessing the top.

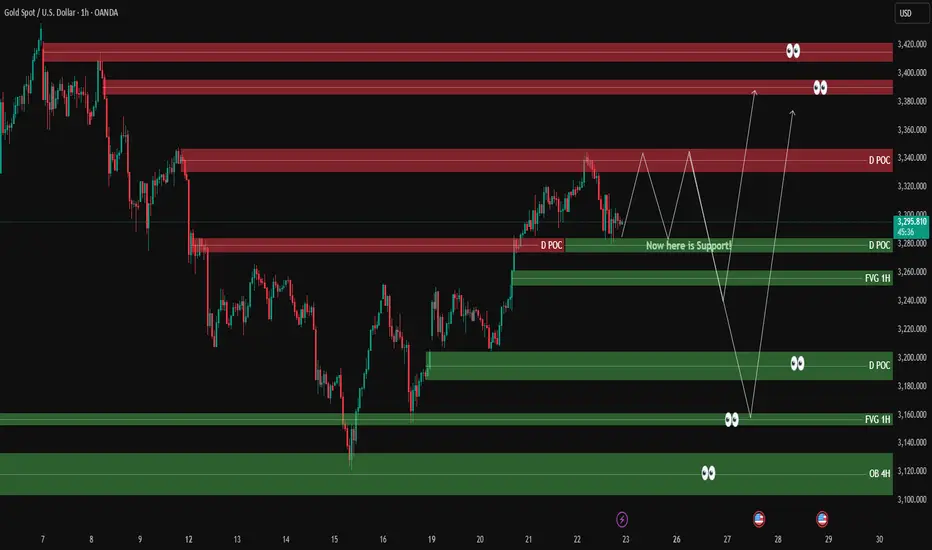
XAUUSD - Price in Range – Possible Sweep Down Before Going UpGold is currently in a range-bound phase between well-defined supply and demand zones.
🔰 Current Support:
The previous resistance around the developing POC (D POC) has now turned into support and price is reacting to it.
📍 Main Scenario:
🔻 A liquidity grab to the downside is expected first — targeting the FVG 1H and OB 4H demand zones.
📈 If we get bullish confirmation and lower-timeframe triggers, long entries will be valid from those zones, aiming for upside levels like 3300+ and 3400.
👀 Key Levels to Watch:
Demand at 3160 (FVG)
Demand at 3120 (OB 4H)
These are potential springboards for the next impulsive move up.
🔍 Insight by ProfitaminFX
If this outlook aligns with your bias, or if you see it differently, feel free to share your perspective in the comments. Let’s grow together 📈
gold on buy#XAUUSD base on price movement both past and current, we wait to see if price will break below 3330 to sell short.
Below 3330 have short sell till 3324. Buy limit 3324, target 3370, SL 3312
Above the 3344 if current h1 closes there will continue bullish move till same target.

Will Trump's Tariffs Propel Gold Past 3,500 ? Again ? On May 23rd's U.S. trading session, Trump's tariff announcements on the EU and Apple roiled markets like a tempest 🌪️. He proposed a staggering 50% tariff on EU products starting from June 1st, citing unfair trade practices. Meanwhile, he threatened Apple with a 25% tariff if iPhones sold in the U.S. weren't manufactured domestically.
This sent gold prices soaring sky - high 🚀. As a reliable safe - haven, gold spiked as investors, deeply worried about the potential global economic impacts, rushed to safeguard their wealth. The 3280 support level for gold, which had been holding firm in the preceding days, became even more crucial as the upward momentum strengthened, like a sturdy anchor in stormy waters ⚓.
If the tariff issue remains unresolved and tensions continue to simmer between the U.S., the EU, and major corporations like Apple, the upward trajectory of gold prices is likely to persist. Analysts predict a good chance it could break the 3,500 mark, as if a new peak is waiting to be conquered 🏔️. Tariffs disrupt global supply chains and raise U.S. inflation fears, driving investors to gold for protection against economic and currency risks, much like sailors seeking a safe port in a typhoon 🌊.
⚡️⚡️⚡️ XAUUSD ⚡️⚡️⚡️
🚀 Buy@ 3340 - 3360
🚀 TP 3400 - 3450
Accurate signals are updated every day 📈 If you encounter any problems during trading, these signals can serve as your reliable guide 🧭 Feel free to refer to them! I sincerely hope they'll be of great help to you 🌟 👇

GOLDHello friends
Given the sharp upward movement we had, the price is now forming a flag pattern, and if this pattern is completed, we can wait for a new high.
*Trade safely with us*

Trump's tariffs roiled markets; gold roseOn the U.S. trading session of May 23, Trump's tariff remarks on the EU and Apple hit the market like a storm 🌪️. He announced that a staggering 50% tariff would be imposed on EU goods starting from June 1, citing "unfair trade practices." Meanwhile, he threatened Apple with a 25% tariff if iPhones sold in the U.S. were not manufactured domestically.
This news sent gold prices soaring 🚀. As a safe-haven asset, gold surged amid investors' concerns about global economic impacts. The previously firm 3280 support level became increasingly critical in the upward trend.
If the tariff dispute remains unresolved and tensions continue between the U.S., the EU, and enterprises like Apple, the upward momentum of gold prices may persist. Analysts note that gold is likely to break through the 3500 mark 🏔️—tariffs disrupt global supply chains and raise inflation fears in the U.S., driving investors to flock to gold to hedge against economic and currency risks.
⚡️⚡️⚡️ XAUUSD ⚡️⚡️⚡️
🚀 Buy@ 3340 - 3360
🚀 TP 3400 - 3450
Accurate signals are updated every day 📈 If you encounter any problems during trading, these signals can serve as your reliable guide 🧭 Feel free to refer to them! I sincerely hope they'll be of great help to you 🌟 👇

Going long on pullbacks remains the mainstream.Fundamentals: Risk aversion is still the mainstream in the current market; risk aversion funds and risk aversion sentiment are still dominant in the gold market; although risk aversion and bullish sentiment have weakened at the war and trade war levels; the overall global fundamentals have not returned to their original state; behind various small fundamentals, there is still the possibility of triggering various risk events
Gold continued to rise on Friday due to the rise in risk aversion caused by tariffs, and the price of gold continued to rise to around 3365, and the daily line closed with a full big positive line again. If gold can successfully break through and stabilize in the 3360-3365 range in the future, the bull market is expected to regain its dominant position.
From the perspective of the 4-hour cycle, the price of gold continues to rise based on the unilateral moving average. Although there is a temporary divergence in the current indicators, in terms of form, the price of gold has achieved a short-term break. Next Monday, it is necessary to focus on the support strength of the 3345-3335 position, and the upper pressure range is maintained at 3365-3375. Do not blindly chase the rise before successfully breaking through and stabilizing. In terms of operation strategy, it is recommended to wait for the opportunity to step back, buy on dips, and continue to be bullish on gold prices. If gold can continue its strong performance next week, it is expected to test the previous high of 3430-3440 again.

XAUUSD BULLISH TRADE IDEAChart Patterns Identified:
Cup and Handle Pattern (highlighted in red/pink):
The left half shows a rounding bottom (the “cup”).
The right side forms a descending wedge (the “handle”), typically a bullish continuation pattern.
Falling Wedge (inside the handle):
The price consolidates in a narrowing range, suggesting a potential breakout.
A breakout is projected upward.
Key Levels:
Support: Around $2,955.111
Current Price: $3,327.259
Resistance:
Intermediate: Around $3,500.200
Target (based on breakout projection): $3,733.873
Bullish Scenario:
If the breakout above the falling wedge is confirmed (as suggested by the arrow), the price target is near $3,733, which aligns with the height of the cup projected from the breakout point.
This aligns with classic cup-and-handle theory.
Technical Implication:
The setup is bullish and suggests continuation of the upward trend if volume supports the breakout.
Ideal entry would be on a retest of the breakout above the handle resistance.

Buy on retracements and trade with the trend.Based on Friday's closing price action, gold reached a late-session high of 3,366 before oscillating lower, ultimately closing at 3,356—above the critical 3,345 level. This indicates that the primary strategy for next week remains buying on retracements, with the potential for a breakout above 3,345 not ruled out. Despite signs of a pullback, the dominant trend remains bullish, with key resistance to watch at the 3,378–3,380 zone. Therefore, the plan is to continue initiating long positions on retracements next week.
Technical Analysis
Key Levels
Support: 3,345 (converted resistance-turned-support, critical for bullish continuity).
Resistance: 3,378–3,380 (multi-timeframe supply zone, requiring strong momentum to breach).
Trend Structure
The close above 3,345 reinforces the bullish trend bias, with the intraday pullback viewed as a healthy consolidation rather than a reversal.
A daily close above 3,380 would confirm a breakout, opening the door to extended gains toward 3,400+.
In the market, there are no absolutes, and neither upward nor downward trends are set in stone,Only accurate signals can turn a losing account into a profitable one.

Opening price trend analysis and trading operationsGold technically, gold rose sharply on Friday, closing with a real big positive line on the daily line. The pressure from the 3500 high point still plays a partial role in the short term. The market may still need to focus on the upper limit pressure test of the channel in the future, and beware of the market rising again after experiencing a medium-term adjustment. At the 1-4 hour level, the short-term trend quickly reversed from the low point of 3120 and once challenged the high of 3365 US dollars before correcting. It has repeatedly tested the support of 3320 below but still failed to break, stimulating the market bulls to enter the market again. Finally, gold closed sideways at a high level, and the pressure test of 3370 and 3400 areas continued to be paid attention to above. In terms of operation, in the short term, pay attention to the two supports of 3335 and 3320 below to try to go long, and pay attention to the resistance of 3370-3400 area to go short. There are many uncertainties in the market over the weekend, which will directly lead to a gap or a high opening next week. Therefore, you can follow my real-time sharing for specific operation points!

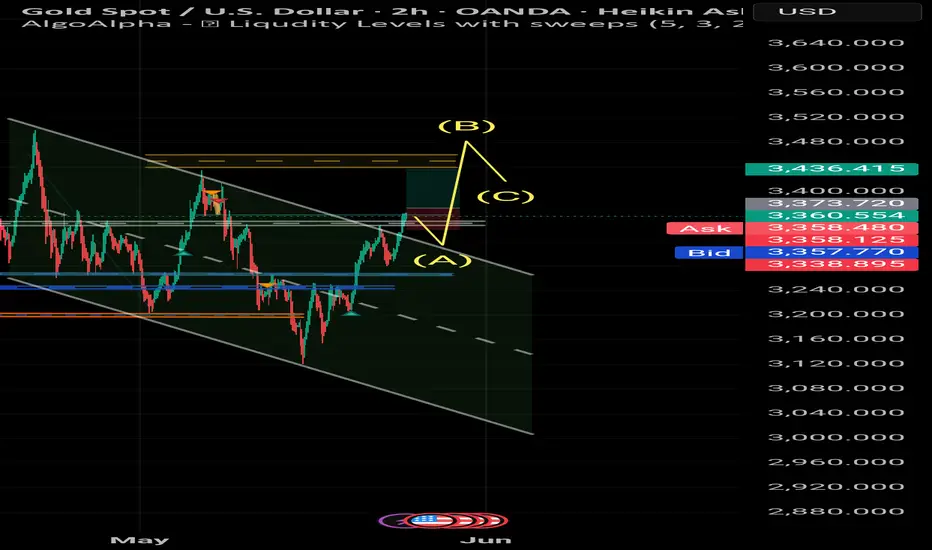
GOLD/USD Analysis – 2H Chart – Potential Bullish BreakoutOn the 2-hour Heikin Ashi chart for Gold (XAU/USD), we’re observing a flag formation after a strong upward movement. Price is currently hovering around 3360, showing consolidation inside a falling channel.
Resistance Zone: 3365–3375
Support Zone: 3345–3335
A bullish breakout is likely if price closes above the resistance area with strong momentum.
Current market volatility suggests potential for a $10–15 move in the next session.
Keep an eye on volume confirmation and possible liquidity sweep traps.
Signals:
Buy Entry: Above 3375 with confirmation
Stop Loss: Below 3335
Target 1: 3395
Target 2: 3410
Risk/Reward Ratio: ~2:1
Analysis by: mohsen mozafari nezhad
GOLD outlook for the weekIn today’s analysis, I’m expecting price to continue its bullish momentum, partially influenced by recent political developments surrounding Donald Trump. This aligns well with the broader higher time frame trend, where we’ve been favouring long setups.
To capitalise, the most immediate and valid point of interest I’ve marked out is the 9H demand zone — the origin of the most recent break of structure. If price retraces, this is where I’ll be watching for bullish confirmation.
However, if price continues to climb without retracing first, we could see a temporary bearish reaction from the nearby 4H supply zone around the 3,400 level. If this happens, I may look for a short-term countertrend sell setup, but only with strong confirmation. Risk will be kept low and I won’t be overly ambitious with targets.
Confluences for GOLD Buys:
Strong bullish momentum following a clear CHoCH on the higher time frame
Recent break of structure left behind a clean 9H demand zone for potential retracement
Trend remains bullish on both the lower and higher time frames
Liquidity resting above still yet to be swept
DXY is currently bearish, supporting a bullish case for gold
P.S. While we could see a minor sell opportunity down to the demand zone, patience is key.
Waiting for a solid pre-trend setup is part of the process — no need to rush entries.
Have a great trading week and stay sharp!

XAUUSD HIT THE TREND PATTERN, PULLBACK BEFORE CONTINUE BULLISH?OANDA:XAUUSD Good afternoon, traders!. Update XAUUSD 2H 24/05/2025
Price has successfully broken the major downtrend line, indicating a possible shift in market sentiment. As long as the price holds above the Buyer Zone (3343–3360), the bullish structure remains intact.
However, if selling pressure increases, the market may revisit the next Demand Zone at 3279–3245.
Key Levels to Watch:
Buyer Zone (Supply Flip): 3343–3360
Demand Support Zone: 3279–3245
Target Zones: 3365 (1.0), 3389 (1.272), 3419 (1.618)
Price remains supported by FVG zones and structural breakout, but confirmation is needed upon retest.
📅 Key Fundamentals Next Week:
U.S.–EU trade tensions could spark increased gold demand.
U.S. ISM Manufacturing & Construction Spending data expected — volatility likely.
Fiscal concerns in the U.S. may further support safe-haven flows to gold.

Buying on pullbacks remains the main theme!Tariff turmoil resurfaces, gold price jumps!
The Trump administration once again wields the tariff stick, threatening to impose a 50% tariff on the EU from June 1, and saying that there has been no progress in the negotiations between the US and the EU. Because the timing of this threat is quite subtle. Just earlier this week, the EU just submitted a new framework proposal to the US to restart bilateral trade negotiations. This directly led to a jump in gold price tonight!
Faced with the tough stance of the US, the EU is not sitting still. It is reported that the EU has formulated a contingency plan. If the negotiations fail, it will impose additional tariffs on US exports worth 95 billion euros in response to Trump's "reciprocal" taxation and 25% tariffs on cars and some parts, which will inevitably cause further impact on the market!
The bulls are in control and are unwilling to give the bears too many opportunities to cover their losses. Therefore, the strategy of following the trend needs to be more active - strong markets usually do not experience a deep retracement, and the correction phase will not break the previous low for the second time. After the current gold price surged to 3365, the intraday bull defense position should be set at 3340. The previous low of 3320 has been effectively supported, and the bulls have taken the absolute initiative, and there will be no short-selling opportunities in the short term. Based on the current strong bullish performance, continuing to maintain a bullish mindset is the core of the transaction.
Operation strategy:
1. Gold recommends going long in the 3340-3330 area, with a target of 3350-3360.
2. Gold recommends going short in the 3365-3375 area, with a target of 3350-3340.

GOLD D1 chart update for the 26-30 May weekkindly read level carefully as market on it's way to ATH but keep in mind downside some major retracements are remains pending
Right all eyes on 3330 level if market successfully sustain below 3330 then it will definitely move towards 3300 or even 3280 and then 3250
Main levels for the week 3400 \ 3250 \ 3308

XAUUSD Intraday Analysis – 23 May 2025Technical Outlook:
Price is currently trading within a well-defined ascending channel, with both the upper and lower trendlines being respected consistently. The recent bullish momentum aligns well with the overall market structure, suggesting continued upward pressure.
Channel Support Zone: The lower bound of the channel has consistently acted as dynamic support, with price bouncing each time.
Fair Value Gaps (FVGs): Two clear FVGs are present, with price reacting to the first one already. The second, slightly higher FVG, aligns with the midline of the channel — a common area of short-term consolidation or continuation.
Key Buy Zones:
Zone 1: 3300–3305 – Ideal first entry zone aligning with minor demand and the lower region of the current consolidation.
Zone 2: 3315–3320 – Second entry zone closer to mid-channel and higher FVG area.
Bullish Confluence:
Channel support (structure).
FVG demand zones.
Higher highs and higher lows (market structure).
No significant resistance until ~3380–3400, providing ample R:R.
📈 Trade Signal (XAUUSD)
Bias: Bullish
Entry Zones:
🔹 Buy Limit @ 3300–3305
🔹 Buy Limit @ 3315–3320
Stop Loss: (just below channel support)
Take Profit 1: 3335
Take Profit 2: 3355
Take Profit 3: 3375
Take Profit 4: 3385
Risk Management: 1–2% per entry zone based on your account size. Adjust position size according to risk tolerance.
Kindly follow, share, support and boost.

Plan ahead Sell high and buy low to take the lead.Yesterday, the technical side of gold rose first and then fell. We directly arranged 3327 long orders to take profit and exit at 3340. After further accelerating to break through the 3345 mark, it fell under pressure and fell rapidly. We also successfully shorted at 3341, and the target successfully reached 3330-20. The European session continued to fall and broke through the 3300 mark and continued to fall to around 3280 to stabilize and rebound. We went long at 3280, and the target was 3300-3306. The daily K-line closed at a high and fell back to oscillate in the middle. The overall gold price was suppressed and oscillated at the 3345 mark in the short term. Yesterday's three orders also reached the take-profit target as expected.
From the 4-hour market analysis, today's upper short-term resistance is around 3315-3320. If the upper pressure 3315-3320 is not broken, shorting can also be done. Focus on yesterday's high pressure of 3345. The support level below is still 3280-3275. If it breaks down, pay attention to 3255-3250. Continue to rely on this range to maintain the main tone of high-altitude low-multiple cycles during the day. Observe more and move less in the middle position, be cautious in chasing orders, and wait patiently for key points to enter the market.
Operation suggestions:
1. Go long when gold falls back to 3285-3275, and look up to 3300 and 3315.
2. Go short when gold rebounds to 3340-3345, and look down to 3325 and 3315.

Gold fell back at night and continued to riseGold rose and fell, and stopped falling at the middle track again, indicating that the middle track can be used as a watershed in this cycle. If it runs above it, the volatility will be strong. In addition, the 618 division position 3317-18 line broke through again and stood above it. The short-term 5-day moving average support is 3315. Therefore, the 3315-3318 range is the first retracement to confirm the support point. If it stabilizes, it will further attack and point to the 786 division resistance 3370 line. Once the previous high of 3345 is broken, the corresponding MACD will enter a top divergence state. If it is further pulled up in the later period, we must be careful to prevent a high and fall. At the hourly gold line level, the US market was under pressure at 3315 overnight, with support at 3280-90, and repeated bottom shocks and consolidation. This morning, it was still running back and forth under the suppression of the middle track 3305, but the lows gradually moved up. Finally, under the continued weakness of the US dollar, the gold price finally stood on the middle track, and the direct positive strong force reached 3330. From overnight to this morning, it has been bullish and finally waited for a big profit. Then after the 3315 resistance is broken and stabilized, it will naturally become the top and bottom support. The 10-day moving average will move up and approach 3320, maintaining resistance to declines and still tending to further rise. Pay attention to the 3320-3315 support to stabilize and continue the bullish trend. The resistance target is 3370-3380; if it is unexpectedly effectively lost, pay attention to 3340.

3330 is in stalemate 3335 is the key to long and short positions🗞News side:
1. PMI and initial jobless claims data
2. Geopolitical situation
3. Progress of the G7 meeting
📈Technical aspects:
Currently, the gold price is caught in a fierce battle between bulls and bears at the 3330 level. From a technical point of view, gold is still in the weekly level adjustment and no clear unilateral trend has emerged. Recently, there has been frequent changes in long and short positions, and the rise and fall of prices depends on the impact of news on the market. Even if gold experiences a correction at present, it is likely to be only a small range. Therefore, in the short term, attention should be paid to the resistance line of 3330-3335. If it breaks through, it is expected to look towards yesterday's high of 3345. If it encounters resistance and pressure at 3330-3335, it may retreat to 3310-3300 in the short term for correction. The upper strong pressure is still at 3350-3360, and the lower support of 3300-3290 is still strong. There is no good entry trading opportunity at present, so brothers should wait patiently.
If you agree with this view, or have a better idea, please leave a message in the comment area. I look forward to hearing different voices.
FOREXCOM:XAUUSD FXOPEN:XAUUSD TVC:GOLD FX:XAUUSD OANDA:XAUUSD

gold on sell#XAUUSD is trying to correct back above week high 3345 but unfortunately it's need a breakout above the today high to continue.
Below the 3322 breakout shows a strong fall on which target till 3286, stop loss 3331.
Above the 3335 shows a bullish range which will reach 3344, around 3344 will either decline and head sell or reach the 3367 limit. Below 3312 shows another bearish continuation but multiple breakout will decide.

Gold top profit signalsThe market fluctuated upward all the way on Friday, opening at 3295, hitting the lowest point of 3287 and bottoming out. So far, it has hit the highest point of 3334 and then fluctuated at 3330. The recent market fluctuations are relatively large, and they are completely within our expectations. Yesterday, on Thursday, we gave a short position at 3340-45, and the actual market was directly short at 3341, long at 3380-85, and long at 3390-93. The long position target is 3300-06. Judging from the current trend, gold may still have high points. It is only a matter of time before the 3334 line breaks through. From the perspective of the operation trend, we continue to focus on buying on pullbacks
From the 4-hour market analysis, the upper focus is on yesterday's high pressure of 3345, and the lower support is 3286-90. For the time being, we will rely on this range to maintain the main tone of low-long participation. In the middle position, we will watch more and do less and be cautious in chasing orders.
Gold rebounds to 3286-3295 line and goes long, stop loss 3277, target 3326-3330 line, break to 3340-45 line;
Gold rebounds to 3340-45 line but does not break, you can go short lightly, stop loss 3353, target 3300-3306 line, continue to hold if break

Gold 100% Profit SignalThe market fluctuated upward all the way on Friday, opening at 3295, hitting the lowest point of 3287 and bottoming out. So far, it has hit the highest point of 3334 and then fluctuated at 3330. The recent market fluctuations are relatively large, and they are completely within our expectations. Yesterday, on Thursday, we gave a short position at 3340-45, and the actual market was directly short at 3341, long at 3380-85, and long at 3390-93. The long position target is 3300-06. Judging from the current trend, gold may still have high points. It is only a matter of time before the 3334 line breaks through. From the perspective of the operation trend, we continue to focus on buying on pullbacks
From the 4-hour market analysis, the upper focus is on yesterday's high pressure of 3345, and the lower support is 3286-90. For the time being, we will rely on this range to maintain the main tone of low-long participation. In the middle position, we will watch more and do less and be cautious in chasing orders.
Gold rebounds to 3286-3295 line and goes long, stop loss 3277, target 3326-3330 line, break to 3340-45 line;
Gold rebounds to 3340-45 line but does not break, you can go short lightly, stop loss 3353, target 3300-3306 line, continue to hold if break
