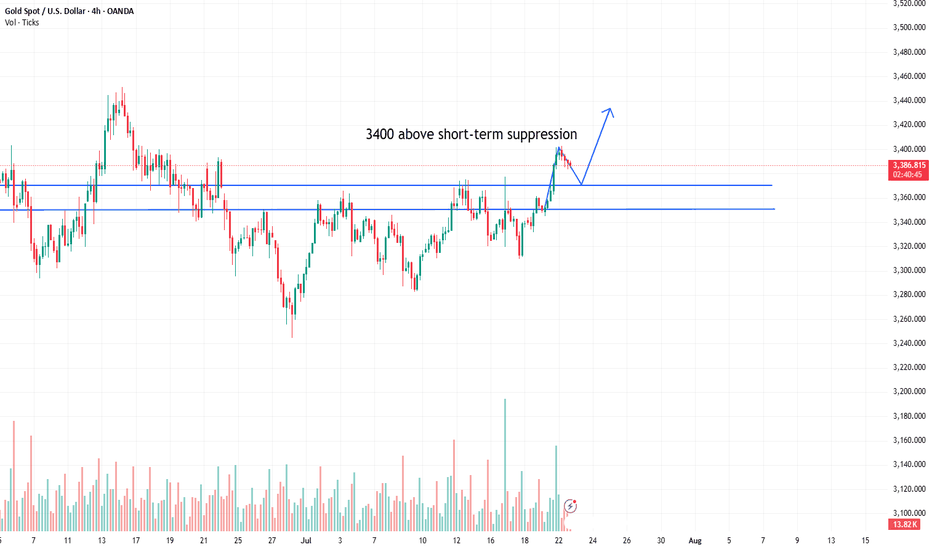
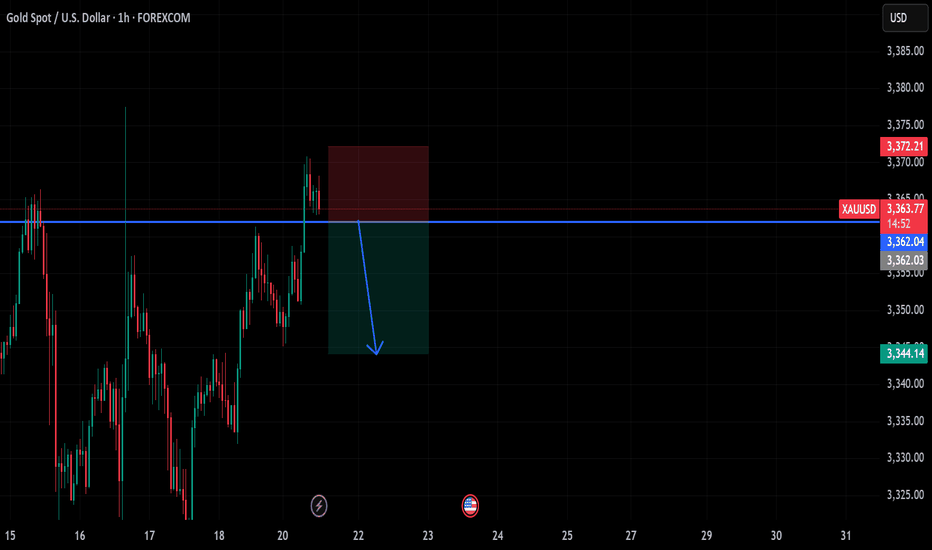
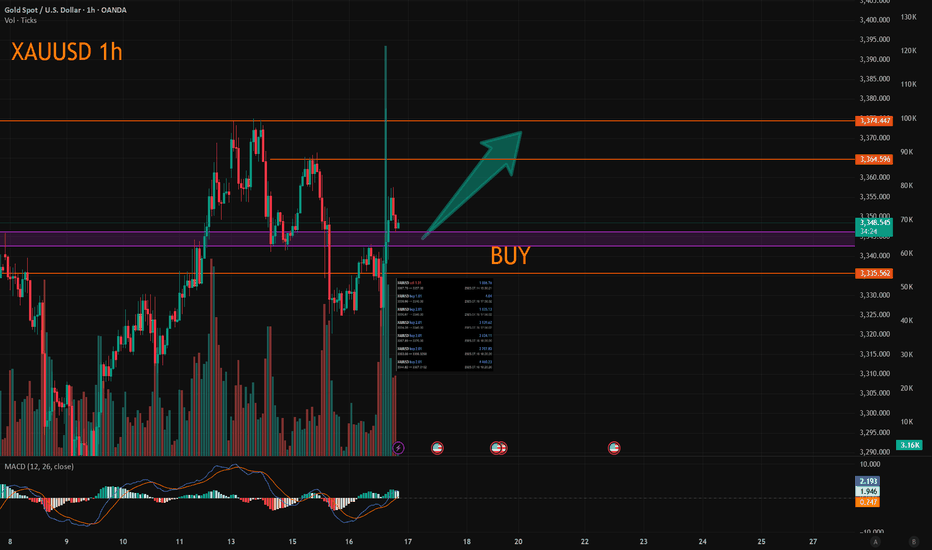
The bulls rise and fall back to continue.Yesterday, gold technically held high and rose strongly in the Asian session relying on the 3350 mark. Both the European and American sessions formed a strong bullish rise and accelerated to break through the 3370 mark before the US session and continued to rise to the vicinity of the 3400 mark and fell back slightly to close strongly. The daily K-line closed with a shock break of the high-middle positive. The overall gold price broke through the recent rebound high of 3377 to form a bullish strong attack pattern. In the short term, 3377-80 became a new key support area.
From the 4-hour analysis, today's retracement relies on this position to continue to follow the trend of the main bullish bullish trend. The short-term bullish strong dividing line focuses on the 3350 mark. The daily level stabilizes above this position and continues to maintain the rhythm of retracement and bullish bullish trend. Short selling can only enter the market at key points, and enter and exit quickly without fighting.
Xauusdlong
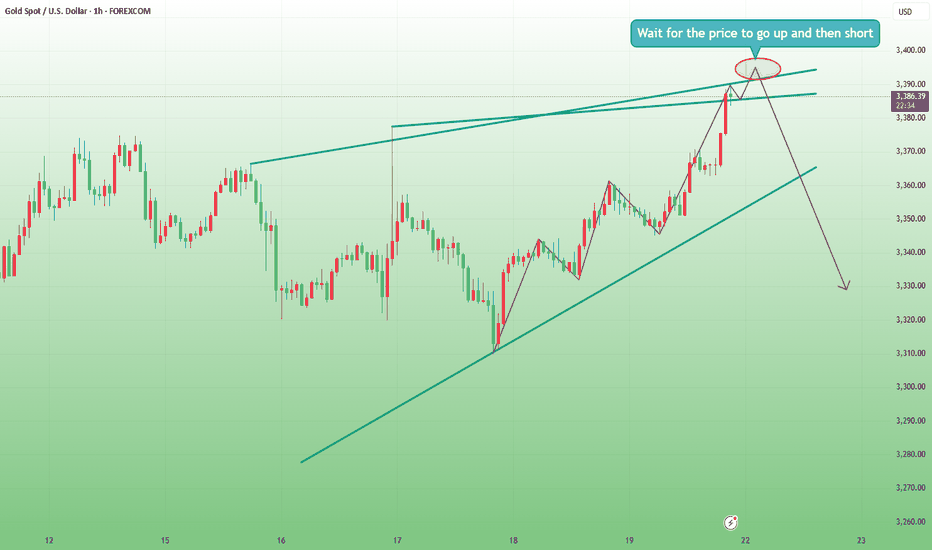
Gold trend analysis: bullish but not chasing the rise.Gold, last Thursday's daily line closed with a long lower shadow, bottomed out and stabilized, and once again stabilized at the lower track support point of the large convergence triangle. Combined with the cyclical movement after the two stabilizations at 3247 and 3282, it was three consecutive positive rises; therefore, last Friday, and at least these two days on Monday this week, there will be consecutive positive rises; today gold rose as expected, the Asian and European sessions continued to be strong, and there was a second rise in the U.S. session. Since the U.S. session went directly higher before and after, the current support below has moved up to the 3377-75 area, where a top and bottom conversion position will be formed. Therefore, if it falls back to 3375-77 in the evening, you can continue to go long and look to above 3400. If it falls below 3370, it will fluctuate. The upper short-term resistance level is 3387-3393, the previous high. If the market touches here for the first time, you can try to see a double top decline.
Gold opening operation strategy.Gold's trend on Friday was mainly volatile upward. It can be said that gold was in a volatile market on Friday night, closing at 3350. If there is no stimulation from international news over the weekend, we will continue to be bullish next week. If your current gold operation is not ideal, I hope Tian Haoyang can help you avoid detours in your investment. You are welcome to communicate with us!
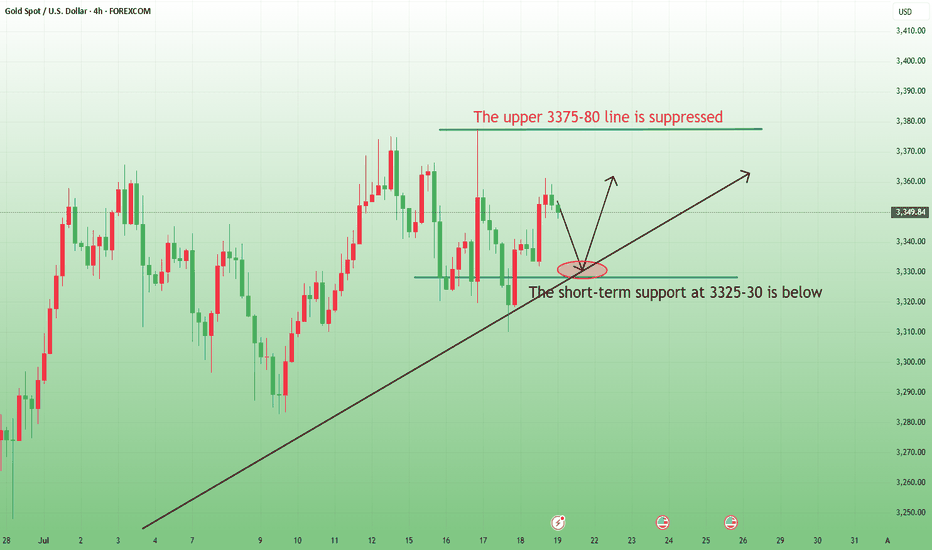
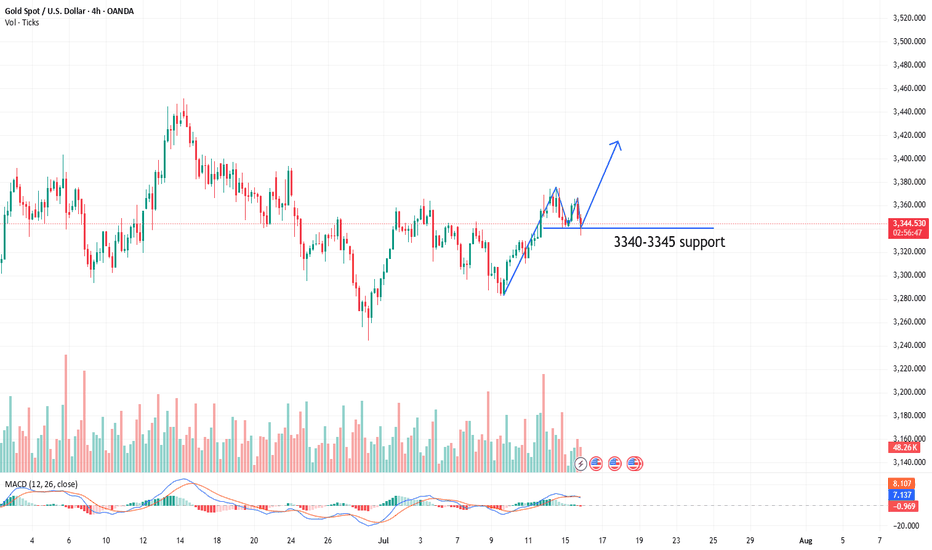
From the 4-hour analysis, the short-term support below continues to focus on around 3340-45, and the strong support is at the 3310 level. The key pressure above is the 3380 line. We will rely on this range to maintain the main tone of high-altitude and low-multiple cycles. For the middle position, we will watch more and do less, and be cautious in chasing orders, and wait patiently for key points to enter the market.
Investment is not a matter of one day or one night. Losses in the early stage do not mean losses in the later stage; profits in the early stage do not mean profits in the later stage. Therefore, friends who lose money should not be discouraged, and friends who make profits should not be complacent. Let yourself invest rationally with a peaceful mind. In this ever-changing market, the rise and fall of the market is not determined by personal subjective will, but is full of more than empty fights. Victory and failure are always around, but one thing is that the trend of the market will determine the future direction. The three steps of setting the trend, selecting the position, and controlling the position are success. Therefore, choice is far greater than hard work. Choosing a good teacher will benefit a lot, and I have always been there.
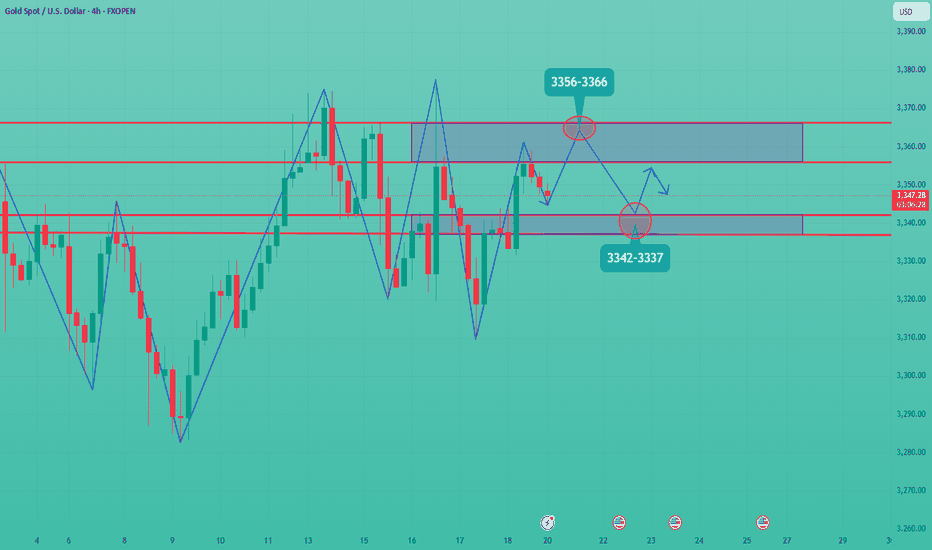
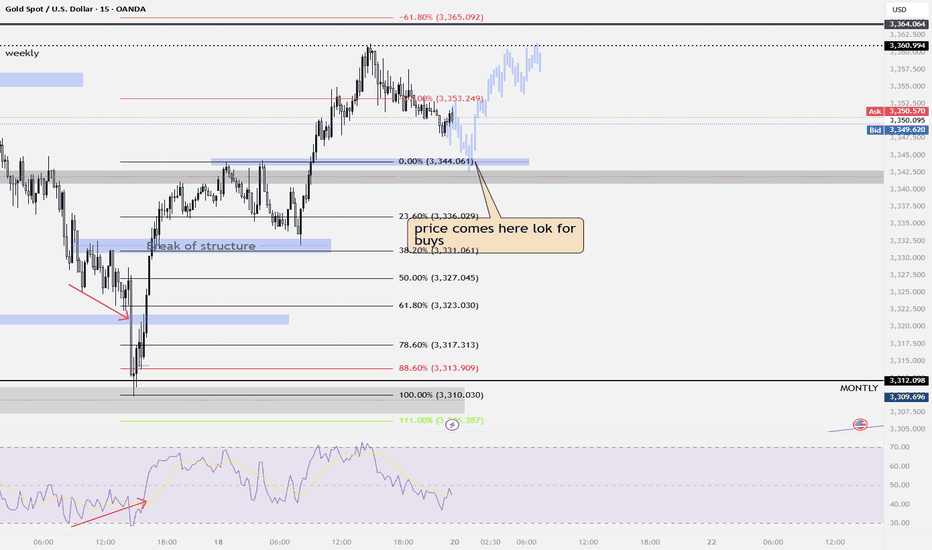
Gold opening market trend analysis.Last week, the gold price rebounded after hitting the low of 3310. The 4-hour chart shows that the Bollinger Bands failed to open downward, and the current market still maintains a volatile trend. Although the short-term price is easy to rise and difficult to fall, it should be noted that the three-month adjustment cycle is coming to an end when the fundamentals of the bull market remain unchanged, and the daily level change window is approaching. It is recommended to focus on preventing risks (especially short-term operation risks) at the opening today and wait patiently for the unilateral market start signal. In terms of short-term operations, the hourly chart price broke through the key level of 3344 after stepping back to the support of 3332. Today's overall trend is volatile and bullish. It is recommended to wait for the price to fall back to the 3337-3342 range to arrange long orders in batches at the opening today. Focus on the 3356-3366 resistance band above. If you encounter resistance, you can try short-term operations. Be sure to strictly stop losses to prevent the risk of false breakthroughs.
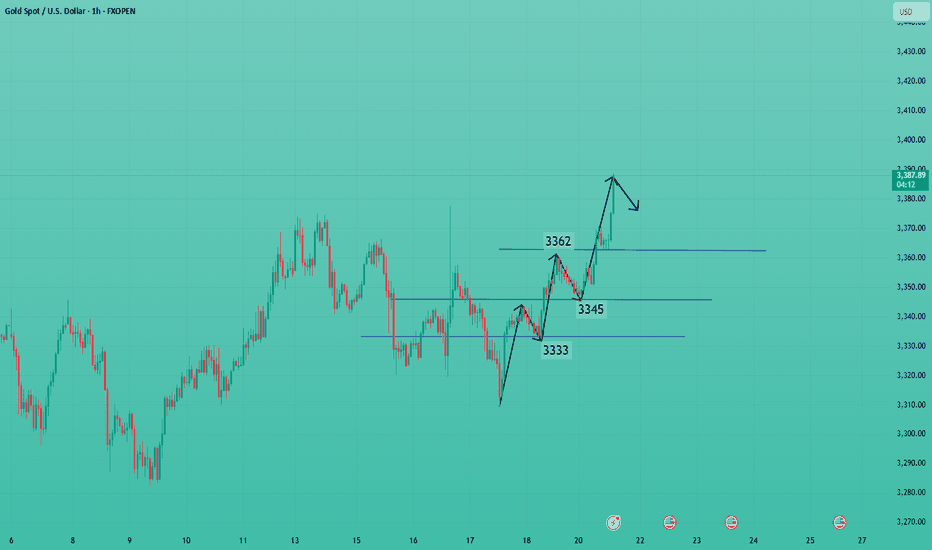
Gold continues to rise.The gold hourly line fell slightly to 3346 this morning and stabilized. It bottomed out and pulled up again to stand on the middle track of the hourly line, which means that the short-term stabilized and the overnight 3361 suppression adjustment ended. Looking at the second pull-up, this should have happened in the US market last Friday, but it was delayed until today. Finally, it successfully reached the 3366 target and hit the 3370 line;So today's Asian market rose, the European market continued to break high, and the US market still had a second pull-up; but because it is in a period of shock, wait patiently for a wave of stabilization before taking action. The reference point to choose is to pay attention to the 3382 split support, that is, 3361-60, which happens to be the top and bottom conversion support point, followed by 3358-56, 50 split support and the middle track, the limit is here, and then the starting point of 3350 cannot and should not break, otherwise it will encounter shocks and washes back and forth; the upper resistance level is concentrated at 3390-3395. It is expected that 3390 will not be able to break through in one breath for the time being. You can try to see a decline when you approach it for the first time;
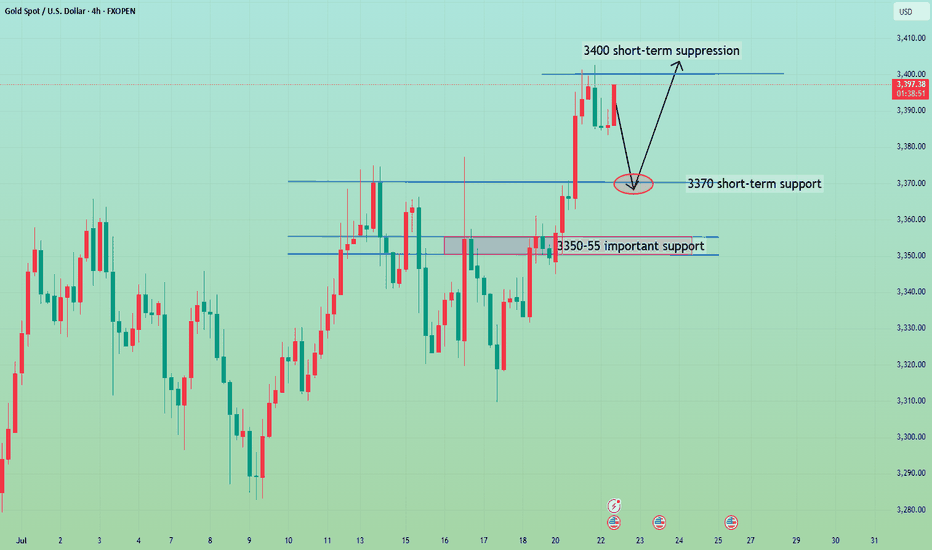
The general trend is to go long after the retracementFrom the 4-hour analysis, the short-term support below is 3370, the important support is 3350-55, and the upper resistance is 3400-05. The overall support range is maintained in this period to maintain the main tone of high-altitude low-multiple cycle participation. In the middle position, watch more and do less, be cautious in chasing orders, and wait patiently for key points to enter the market. I will provide specific operation strategies in the link prompts, please pay attention in time.
Gold operation strategy:
1. Go long on gold when it falls back to 3370, and add more positions when it falls back to 3350-55, stop loss 3344, target 3395-3400, and continue to hold if it breaks;
3380 gold price recovered at the beginning of the week⭐️GOLDEN INFORMATION:
Gold prices (XAU/USD) trade with modest gains around $3,350 in early Asian hours on Monday, supported by persistent uncertainty surrounding global trade negotiations as the US tariff deadline approaches. Lingering concerns over fresh levies are likely to sustain demand for the safe-haven metal. Investors now look ahead to comments from Federal Reserve (Fed) Chair Jerome Powell, scheduled for Tuesday, for clearer policy direction.
On Sunday, US Commerce Secretary Howard Lutnick confirmed that August 1 remains the firm deadline for countries to comply with Washington’s tariff demands. While President Trump’s earlier announcements saw shifting deadlines, the White House now insists this date is final. This cloud of uncertainty continues to bolster gold’s appeal as a hedge in volatile markets.
⭐️Personal comments NOVA:
Gold prices continued to recover last weekend, mainly still accumulating above 3300.
⭐️SET UP GOLD PRICE:
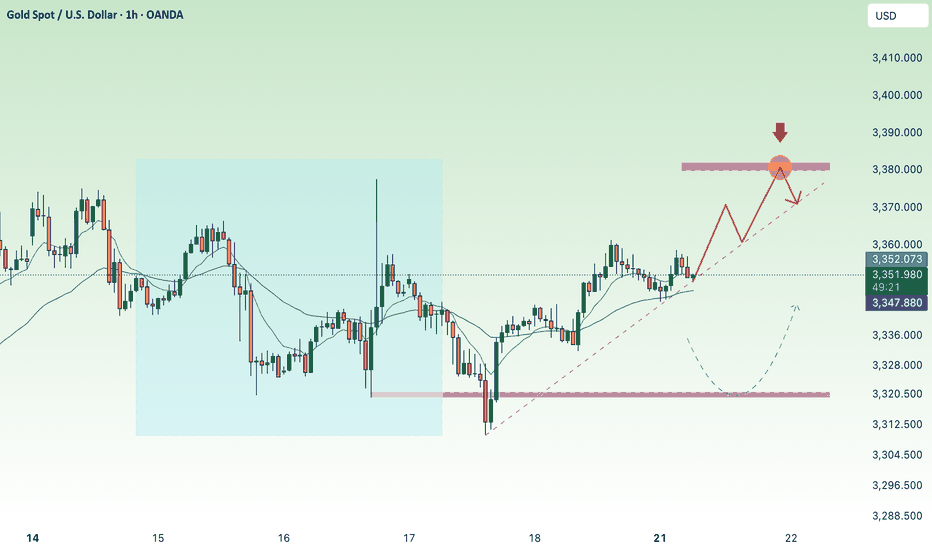
🔥SELL GOLD zone: 3380- 3382 SL 3387
TP1: $3370
TP2: $3360
TP3: $3350
🔥BUY GOLD zone: $3322-$3320 SL $3315
TP1: $3333
TP2: $3345
TP3: $3356
⭐️Technical analysis:
Based on technical indicators EMA 34, EMA89 and support resistance areas to set up a reasonable BUY order.
⭐️NOTE:
Note: Nova wishes traders to manage their capital well
- take the number of lots that match your capital
- Takeprofit equal to 4-6% of capital account
- Stoplose equal to 2-3% of capital account
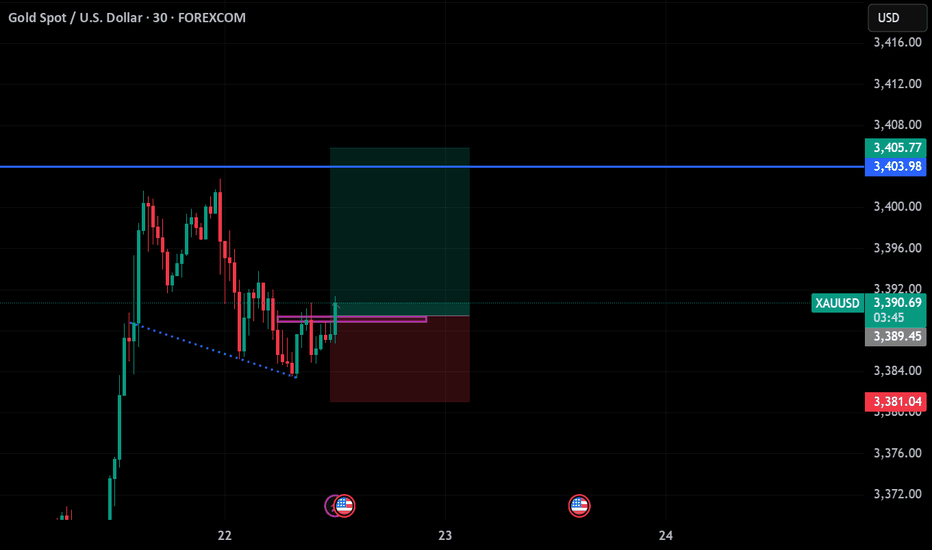
GOLD Breakout Done , Long Setup Valid To Get 200 Pips !Here is My 30 Mins Gold Chart , and here is my opinion , we finally above 3377.00 and we have a 30 Mins Candle closure above this strong res , so i`m waiting the price to go back and retest this res and new support and give me a good bullish price action to can enter a buy trade and we can targeting 200 pips , and if we have a 4H Closure Above This res this will increase the reasons for buyers , just wait the price to back a little to retest it and then we can buy it . if we have a daily closure below it this idea will not be valid anymore .
The range breakthrough is waiting for CPI to take effectIn the early stage, it was mainly volatile, and the lowest level in the morning reached 3334, which was also the position we went long last night. Today, we continue to focus on the 3340-45 line and go long, focusing on the release of CPI data. If CPI rises as expected, it means that inflation is rising, and the Fed's annual interest rate cut expectations will be further reduced, and gold prices may be under pressure to fall again; on the contrary, if CPI is lower than expected or even performs well, it means that Trump's tariff war has not had such a big impact on the market, and the Fed's interest rate cut expectations have increased significantly. After breaking through 3375, gold prices may accelerate to rebound to 3385-90 or even 3400. We focus on the release of data. If your current gold operation is not ideal, I hope I can help you avoid detours in your investment. Welcome to communicate with us!
From the 4-hour analysis, the bullish strong dividing line below is 3325-30. Below, we pay attention to the short-term support of 3340-45. The daily level stabilizes at this position and continues to maintain the bullish rhythm of stepping back and falling. The short-term pressure focuses on the vicinity of 3370-75. The overall high-altitude low-multiple cycle participation in this range remains unchanged. I will prompt the specific operation strategy in the link, so please pay attention to it in time.
Gold operation strategy:
1. Go long when gold falls back to 3340-45, and add more when it falls back to 3325-30. Stop loss 3317, target 3365-70, and continue to hold if it breaks;
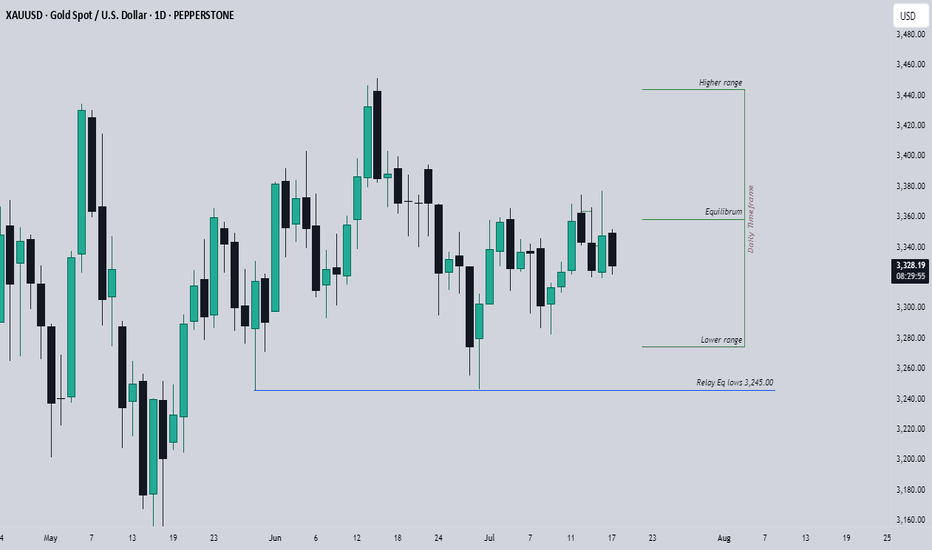
Expectations On GoldPEPPERSTONE:XAUUSD Looking at the daily Range, The market has reached the equilibrium level, is that a sign to go short? no, we could still see a drive to the upper side, but ultimately, the relative equal lows which are close to 3,245.00 big figure should likely be the draw.
I would love to see a drive below the 3,282.00 mark for perfect show to prove the obvious move below the 3,245.00, or seeing a consecutive break below each previous days low would also confirm the directive.
Seeing higher prices would of course negate this analysis, seeing a run into the 3,375.00 big figure yesterday makes me skeptical as this has also left some area of relatively equal highs, so I would give in to the idea of higher prices at least to that level to see what would like occur, but I strongly doubt that this would be the scenerio.
Generally, I am bearish on Gold till I see a run below that 3,245.00 big figure or prices closer to that level.
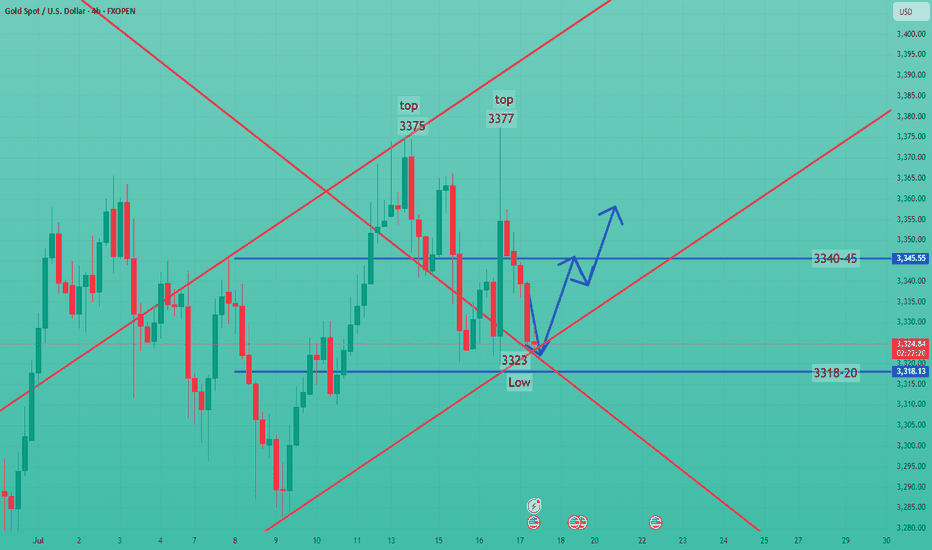
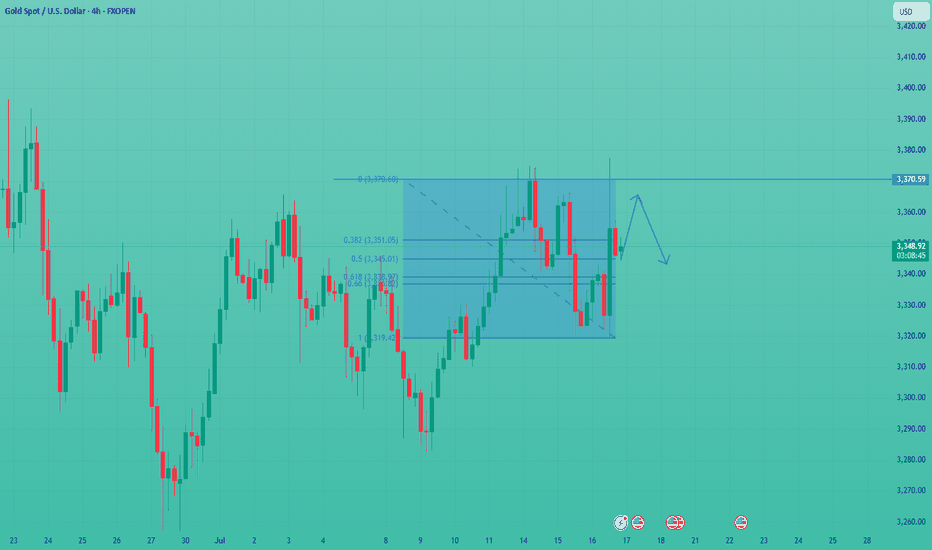
Continue to go long after bottoming outYesterday, the Trump and Powell incident caused gold to rise strongly to around 3377. The rise in gold was only short-lived. In the end, gold closed positively on the daily line, but it closed with a super long upper shadow line. In the end, the gold price quickly rose and broke through the 3377 mark, but fell back under pressure and closed in a volatile market. The daily K-line closed high and fell back in a volatile market. Although the overall gold price repeatedly fluctuated and washed out under the stimulation of news, it ultimately failed to break through the recent large box oscillation range. Today we continue to pay attention to the support line of 3318-25 below, and we will continue to go long if it falls back!
From the 4-hour analysis, the short-term support below continues to focus on around 3318-25, the short-term suppression above focuses on the 3340-45 line, and the key pressure above focuses on the 3380 line. Relying on this range as a whole, the main tone of high-altitude and low-multiple cycles remains unchanged. In the middle position, watch more and do less, be cautious in chasing orders, and wait patiently for key points to enter the market.
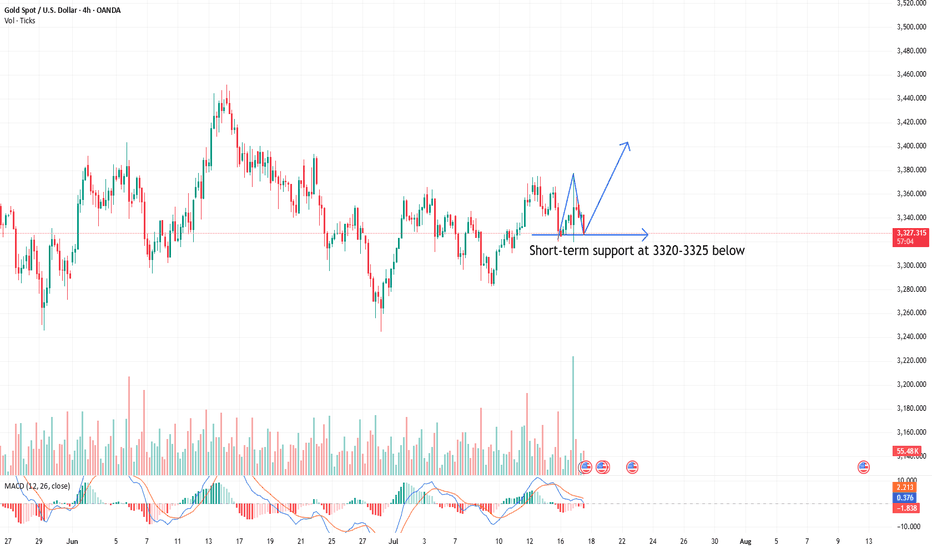
The latest gold trend analysis and strategic suggestionsYesterday, the price of gold showed a range of fluctuations. The long and short sides fought fiercely but failed to break through the existing range. The overall trend direction is still unclear. From a fundamental point of view, the market is still dominated by risk aversion, which makes it difficult for the price of gold to form a clear trend reversal. However, it should be noted that the main funds may take extreme suppression measures in the future to force the price of gold to fall. From the 4-hour chart, gold has been under pressure near the upper track 3377 and continued to fall. Yesterday, it broke through the middle track support and touched the lower track. The current price is temporarily supported near the lower track, but the overall trend still shows a wide range of fluctuations and has not formed an obvious trend. The short-term strength of the US dollar suppresses the upward movement of gold, but the key support and resistance levels have not been effectively broken; in terms of intraday short-term operation suggestions, the current callback near 3320-3325 can try to do ultra-short-term longs. It is recommended to stop profit and exit in the 3340-3345 range. It can be combined with the K-line pattern to short-sell, and the target is the lower track area. If the downward momentum is strong, it may fall below yesterday’s low to form a continuous decline.
Operation suggestions:
1. Go long when gold falls back to around 3320-3325, stop loss at 3312, target at 3340-3345.
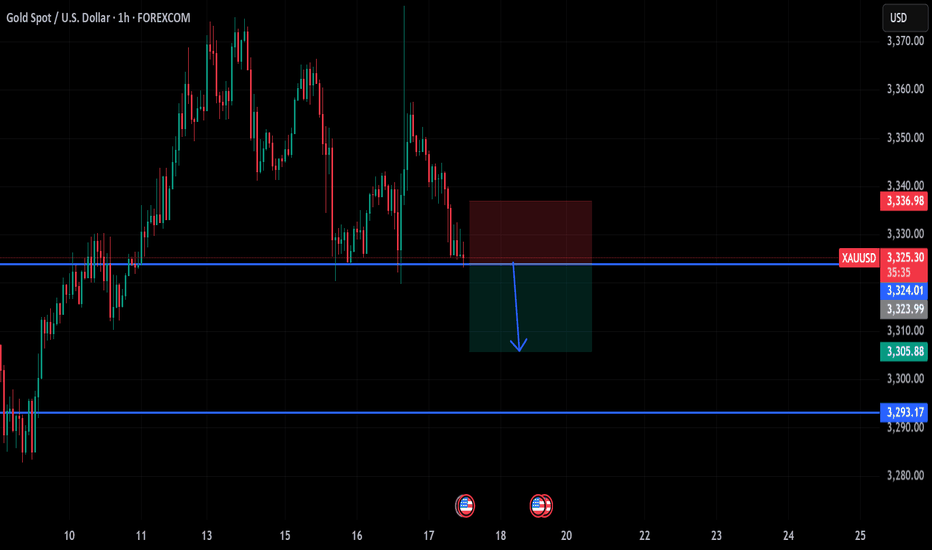
Oolong news stirs up goldDuring the US trading session, the market suddenly had an "oolong" incident. The news that Trump fired Powell caused gold to surge to 3367, but Trump soon denied the plan, the risk aversion sentiment dissipated, and gold fell sharply.
At present, gold has returned to volatility. Given that the risk aversion sentiment failed this time, we need to be vigilant about the subsequent surge and fall.
Given the volatile news, it is better to hold the currency and wait and see, and then look for a good opportunity to operate after the news becomes clear. At present, the upper resistance is 3365-3370, and the lower support is 3326-3317. It is recommended to do more in the future market.
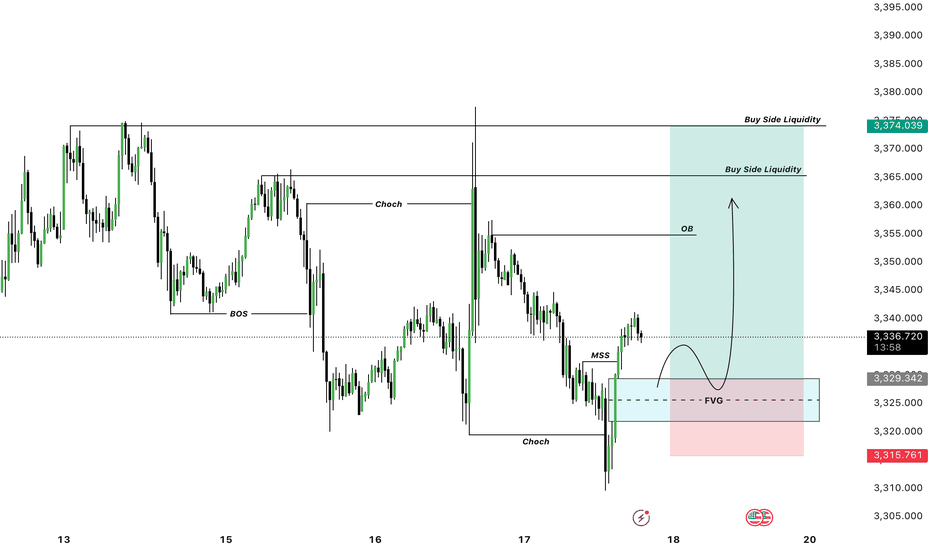
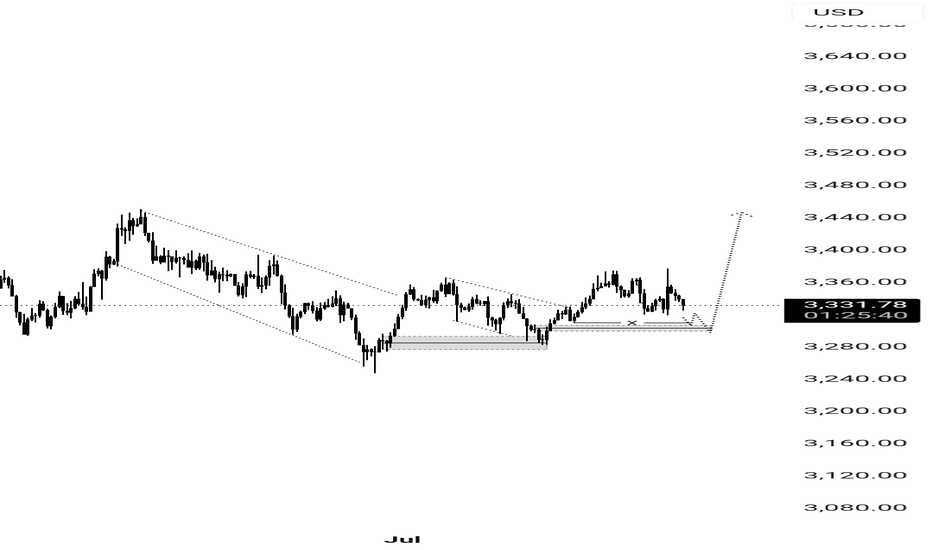
SWING TRADE OPPORTUNITY 〉LONGAs illustrated, I try to visualize what the next bullish impulse could look like if price holds 3300 as a key psychological and algorithmic price level.
Illustrated are the potential buy areas (a current one and an extended one in case a pullback occurs to manipulate lower levels in the next 24-48 hours).
This projection, if valid, could hold from now until next week, so it can be considered a swing trade to hold at least the next week and into the following one).
--
After this post, I will upload another analysis on the Daily timeframe projecting the longer term move, so make sure to go in my profile to check it out.
GOOD LUCK
