3235 line becomes short-term resistance? Golden layout at night!🗞News side:
1. Trump's dialogue with Russia and Ukraine on ceasefire
2. The seriousness of the situation in Israel
📈Technical aspects:
In the short term, the three key factors affecting the gold market are the certainty of tariff policies, geopolitical risks, and the pace of the Fed's interest rate cuts. The Russian-Ukrainian conflict is a tail risk that deserves attention. Its impact on the global order far exceeds other geopolitical conflicts. It is expected that the conflict may see a key turning point in May and June, and the Fed's interest rate cut is likely to be implemented in the third quarter. At that time, the gold and silver markets may face greater negative pressure, and prices may fall back to 3000-2800 or even lower. Technically, the double top pattern at the daily level has been established. Although there is a certain resistance at the 3235 line of gold in the short term, considering the tail risk, the possibility of evolving into a triple top cannot be ruled out, and we need to be vigilant against the inducement of multi-money rises and washes.
🎁BUY 3220-3215
🎁TP 3230-3240
🎁SELL 3250-3255
🎁TP 3235-3225
If you agree with this view, or have a better idea, please leave a message in the comment area. I look forward to hearing different voices.
OANDA:XAUUSD FX:XAUUSD TVC:GOLD FXOPEN:XAUUSD FOREXCOM:XAUUSD
Xauusdlong

Geopolitical risks ease, trade progresses: Gold short-term volatIndia and Pakistan have declared a full ceasefire😮, while news has emerged that Russia and Ukraine will observe a 30-day ceasefire. With the cooling of geopolitical risks, gold’s appeal as a safe-haven asset has diminished. Additionally, high-level economic and trade talks between China and the U.S. in Geneva, Switzerland, have made substantive progress, with most market participants believing the tariff war is nearing an end—further dampening gold’s safe-haven demand.
The market has seen two consecutive days of massive volatility: a surge of $100 on Thursday, followed by a plunge of $100 on Friday, creating a "double kill" for both bulls and bears, which is clearly a capital-driven washout. Currently, the 3120 level still shows a relatively obvious supporting effect. Due to ongoing international relations issues, gold remains in a long-term bullish trend. Traders can continue to take small long positions near 3120😎.
⚡️⚡️⚡️ XAUUSD ⚡️⚡️⚡️
🚀 Buy@3120 -3130
🚀 TP 3230 - 3260
Accurate signals are updated every day 📈 If you encounter any problems during trading, these signals can serve as your reliable guide 🧭 Feel free to refer to them! I sincerely hope they'll be of great help to you 🌟 👇

Beware of a sharp surge at the beginning of the week!🗞News side:
1. The India-Pakistan conflict has been eased, but India has increased its troops in Kashmir
2. The situation between Russia and Ukraine has escalated again
3. Trump has asked Walmart to absorb the impact of tariffs on its own
📈Technical aspects:
Gold jumped higher in the Asian session in the morning and once tested the 3250 resistance line. In the short term, the upward space is limited and there is a certain suppression. At present, gold is testing the 3210-3200 support level again. Judging from the 4H chart, if the gold price breaks through this short-term support level, it is likely to go to the 3170 level next, or even test the strong support level of 3150. If it gets effective support at 3210-3200, gold may test the resistance area again. Therefore, in the short-term trading in the Asia and Europe sessions, maintain the high-level short-selling and low-level long-selling cycle to participate. On the upside, focus on the 3250-3260 resistance area. If it breaks through, it is expected to look towards the 3300 line. On the downside, focus on the 3210-3200 support line. If it breaks through this support, look to the 3170-3150 important support.
If you agree with this view, or have a better idea, please leave a message in the comment area. I look forward to hearing different voices.
FOREXCOM:XAUUSD FXOPEN:XAUUSD TVC:GOLD FX:XAUUSD OANDA:XAUUSD

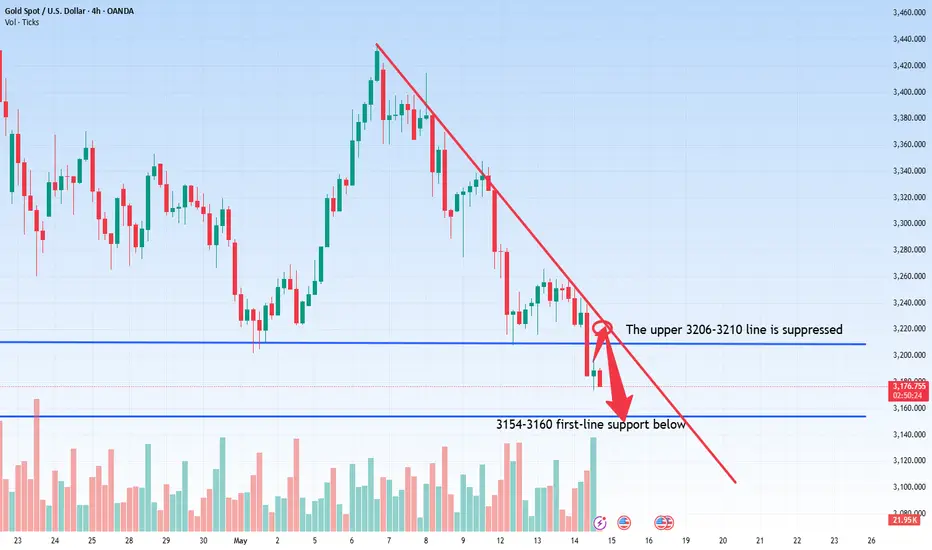
The recent gold short position has a perfect harvestIt can be said that the market of gold on Wednesday was mainly range-bound. After the US market, gold began to follow a unilateral decline pattern, with the lowest reaching the 3173 line. The current rebound of gold is not strong. On the rebound, we will focus on the 3206-3210 line for suppression at the top and 3154-3154 at the bottom. 3160 is a first-line support. The general trend is still mainly rebounding and shorting. We continue to rebound and take advantage of the trend to intervene in short orders and be a stable trader. I have always been here. If your current gold operation is not ideal, I hope that your investment can avoid detours. Welcome to communicate!
Judging from the 4-hour analysis, the upper side is currently focusing on the short-term suppression of the 3206-3210 first line. The counter-draw relies on this position to continue to go short first and then fall back. Before breaking through and standing at this position, the counter-draw main short-term rhythm will remain unchanged. The short-term support below is around 3154-3160, with interval operations as the main focus.
Gold operation strategy:
Gold rebounds and goes short at 3206-3210 line, stop loss at 3219, target 3160-3165 line, continue to hold if the position is broken;
Gold's V-shaped reversal restarts its upward trend!Technical analysis of gold: Gold has a perfect V-shaped reversal today. It opened at 3177 and fell unilaterally in the Asian session. After touching 3120, it rose slowly. As of the time of writing, it has completely recovered its decline and is currently trading around 3220. I have analyzed the European session. After the gold price broke through the extreme drop of 3200, it needs to be repaired, but it has taken another rebound correction. The analysis also gave attention to 3198 to 3202 to continue to be bearish. With the slow rise and break, the bearish view is invalid. Now make a new analysis.
From a technical point of view, gold is now back above 3200, and the daily line is a big positive. It is undoubtedly absolutely strong. The key point is the gains and losses of 3200. If the retracement does not exceed 3200, then gold is extremely strong. On Friday, we will continue to see the daily line closing positive rise, but if the retracement is below 3200, the daily line cycle may close again, and there will be a continuous rebound to 3235 and 3260. Therefore, the key point today is to pay attention to the gains and losses of 3200.
The performance of the 4-hour cycle may now bottom out in the medium term. After the decline and rebound, the 4-hour mid-term Bollinger opening is temporarily strong, but if the US market rebounds continuously and stands firm at 3200, there will be a continuous positive pattern at the bottom, breaking the 5-day and 10-day moving averages, then there is a great possibility that it will go to 3235. Therefore, gold in the late trading should not be inertially bearish because of the decline on Wednesday. Even if it is bearish, it is necessary to observe the gains and losses of 3200. As for trading, first pay attention to 3200 below and try to buy, and see if 3230 breaks and 3250 breaks.
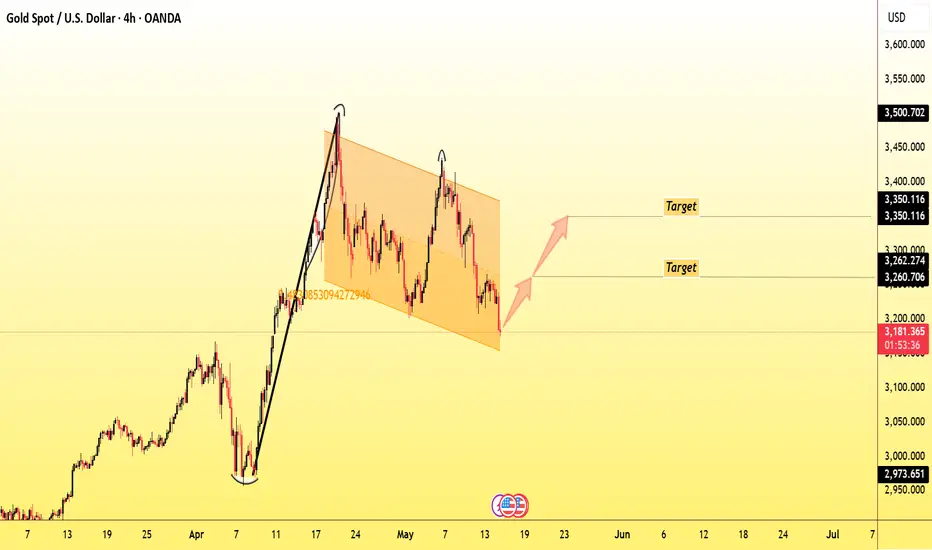
On the whole, today's short-term operation of gold suggests that callbacks should be the main focus, and rebound shorts should be supplemented. The top short-term focus is on the first-line resistance of 3250-365, and the bottom short-term focus is on the first-line support of 3193-3200. All friends must keep up with the rhythm.
Gold intraday trading strategyFrom the 4-hour line analysis, today's lower support continues to focus on around 3170-75, strong support is at the 3150 mark, and upper pressure is around 3253-60. Relying on this range as a whole, the main tone of high-altitude and low-multiple cycles remains unchanged. In the middle position, watch more and do less, be cautious in chasing orders, and wait patiently for key points to enter the market.
Gold operation strategy:
1. If gold falls back to 3170-75 and does not break, hold a light long position; if it falls back to 3150-55, add a long position; stop loss at 3144; target at 3226-3230; continue to hold if it breaks;
2. If gold rebounds to 3240-45 and does not break, hold a light short position; if it rebounds to 3253-60, add a short position; stop loss at 3266; target at 3275-80; continue to hold if it breaks;

It’s the right time to shortUS President Trump recently criticized Fed Chairman Powell again, calling him "slow to act" and emphasizing that the Fed should cut interest rates as soon as possible to support the economy. Trump believes that delaying interest rate cuts may lead to the risk of recession in the US economy, but the Fed still takes inflation and employment data as the core of decision-making, and the two sides have obvious differences in policy positions.
At present, the Fed's interest rate cut expectations have been postponed and the magnitude has been reduced. Coupled with the expectation of rising US bond yields, the gold market sentiment has weakened. The world's largest gold ETF recently reduced its holdings by 8.98 tons to 918.73 tons, reflecting the cooling of institutions' short-term bullish enthusiasm for gold. Technically, gold prices continued to weaken after breaking through key support last week, and the weekly closing was negative, suggesting that shorts were dominant; the daily level was constrained by the 20-day moving average, and the volatile downward trend may continue in the short term. Focus on the 3250-3265 line resistance during the day. If it cannot break through, the $3,200 mark below may face a test.
Gold recommendation: short sell when it rebounds to 3245-3252 range. Target 3230-3220.
GOLD Will Grow!
HI,Traders !
GOLD is trading in an
Uptrend and Made a bullish breakout
And a pullback so affter
The retest of the broken
Falling resistance which
Is now a support we will
Be expecting a further
Bullish move up !
Comment and subscribe to help us grow !

XAU/USD 4H Chart Analysis – Wave 5 Setup in PlayHey traders! Just wanted to share this clean Elliott Wave setup I’m tracking on Gold (XAU/USD).
We’ve just completed what looks like a textbook Wave (4) correction, finding support right at the lower boundary of this long-term ascending channel. Price also respected the 38.2% Fibonacci retracement perfectly, lining up around the $3,090 level. That level is acting as a key demand zone right now.
🌀 According to the wave count:
Wave (3) topped out near $3,500
Wave (4) retraced sharply into the channel base
We are now potentially at the launch point for Wave (5) — the final impulse leg
💹 Wave (5) Projection:
Targeting the upper channel boundary, which aligns closely with $3,740–$3,750
This area also completes the measured move and matches key structural confluence
📈 Technical Confluence Supporting the Bullish Bias:
RSI bounced cleanly from oversold territory
Bullish EMA crossover (20/50) is happening right near the bounce zone
We’re also seeing a break of the corrective trend line, suggesting momentum is shifting back in favor of the bulls
📍 Key Levels to Watch:
$3,149: minor pullback area / possible retest
$3,283: Fib 23.6% resistance — needs to be cleared for confirmation
$3,500: Major resistance & previous high — breakout zone
$3,747: Wave 5 target
⚠️ Invalidation Zone:
If price breaks below $3,090, and especially $3,041, I’ll be reassessing the wave count. That would suggest a deeper Wave 4 or a breakdown in bullish structure.
📌 Conclusion:
I’m watching this setup closely. Gold looks poised for a strong upside leg if current levels hold. The structure is clean, momentum is turning, and we’ve got multiple confirmations in place. I’ll be scaling in with proper risk management and looking to ride this potential Wave 5 to new highs.
Drop your thoughts below — are you long on Gold? Let’s talk setups 👇
@WrightWayInvestments
@WrightWayInvestments
@WrightWayInvestments

XAUUSD at the Crossroads: Breakout or Breakdown?OANDA:XAUUSD Gold (XAUUSD) is trading around $3,237, currently testing a descending trendline and minor resistance. A clear breakout above this level could open the way to retest the $3,289 resistance area, followed by the $3,435 recent high and potentially the all-time high near $3,498.
Failure to break higher may see the price remain range-bound between $3,240 and $3,289. A break below support at $3,123 would be bearish and could trigger a drop toward $3,050.
Fundamental Drivers:
Moody’s US credit downgrade continues to support safe-haven flows
Fed commentary and trade uncertainty cap directional clarity
Higher Treasury yields remain a headwind for Gold
📌 Key Levels:
Minor resistance: $3,240
Major resistance: $3,289 / $3,435
Support zone: $3,123 / $3,050

The latest gold operation strategyFrom a technical perspective, gold prices experienced a unilateral decline on Thursday, hitting a key support level of $3,120/ounce at the lowest. In the early trading session of the European market, a strong forced short rebound began, with a daily increase of nearly $120. The daily level closed with a long lower shadow positive line, indicating strong buying support below, and the correction formed at the top of the $3,435/ounce stage may be coming to an end. At present, it is necessary to focus on whether the price can continue to stabilize the 5-day moving average (currently running near $3,220/ounce). If the closing today confirms that it has stabilized at this technical level, it can be regarded as a signal of the end of the downward trend. The market may restart the medium-term upward structure, and the market is expected to challenge the integer level of $3,500/ounce or even higher targets in the future.
From the gold 15-minute K-line chart, the K-line relies on the 5-day moving average to rise continuously, and the gold market is relatively strong, but the MACD red column shrinks, and the short-term may be corrected. In terms of operation, it is possible to go long if the 10-day moving average of 3,220 is maintained. In summary, it is recommended to buy gold in the short-term correction today, and short gold in the rebound. Pay attention to the resistance of 3260-3280 on the top and the support of 3200-3190 on the bottom.
Operation strategy:
1. It is recommended to buy gold in the correction area of 3200-3195, with a stop loss at 3187 and a target of 3220-3240
2. It is recommended to short gold in the rebound area of 3225-3230, with a stop loss at 3238 and a target of 3215-3200

3202 Buy and see reboundGold, the price fell to 3120 on Thursday and then rebounded, and boosted by the market's risk aversion sentiment, it rose to 3252 overnight, and the trend continuity is poor; the daily chart recorded a real big sun, and it will maintain a wide range of fluctuations in the short term, waiting for the results of the Russian-Ukrainian negotiations;
First fell back, now reported 3207; short-term decline and rebound showed a signal of stopping the decline, and a rebound and consolidation are expected in the evening; short-term support 3202, strong support 3192-3186; short-term resistance 3214-3218, strong resistance 3224-3230, break to see 3252;
In terms of operation, it is recommended to try to buy in the short term;
Strategy 1: Buy near 3202, protect 3192, target 3242;

XAUUSDHello traders!
I’m sharing what may be your first trade of the week. This setup comes from the XAUUSD pair. I currently see a Buy opportunity in Gold, and the trade is already active on my side.
🔍 Trade Details:
✔️ Timeframe: 15-Minute
✔️ Risk-to-Reward Ratio: 1:1.50
✔️ Trade Direction: Buy
✔️ Entry Price: 3223.82
✔️ Take Profit: 3237.39
✔️ Stop Loss: 3214.78
🔔 Disclaimer: This is not financial advice. I’m simply sharing a trade I’m personally taking, based on my own methodology. It is intended purely for educational purposes.
📌 If you're interested in a more systematic and data-driven approach to trading:
💡 Follow the page and turn on notifications to stay updated with future trade ideas and market breakdowns.

XAUUSD – Triangle Pattern Forming with Breakout PotentialThe price of Gold (XAU/USD) has recently gone through a structural shift, transitioning from a strong downtrend to a phase of market consolidation. This transition is clearly visible on the 1H chart where price has formed a symmetrical triangle, which generally signals price compression and often precedes a large breakout in either direction.
The most recent significant downtrend came to a halt near a well-identified support zone around the $3,157 level. This level aligns with previous reactions, and the price sharply rebounded from this demand area—indicating strong buyer interest and liquidity absorption.
Following this, the market has shown higher lows and lower highs, compressing into a tight range that is forming the triangle pattern.
📐 Technical Structure Breakdown:
🔸 Symmetrical Triangle Pattern
A classic consolidation pattern.
Formed by converging trendlines—one sloping down (resistance) and one sloping up (support).
This triangle signifies market indecision between buyers and sellers.
Volume is decreasing, which is typical in triangle formations and suggests a breakout is nearing.
🔸 Trendline Breakout & CHoCH (Change of Character)
The earlier bearish trendline was broken, indicating a change in the short-term trend bias.
The CHoCH label on the chart signals the point where bearish market structure was invalidated by a bullish rally, shifting momentum toward buyers.
🔸 Support Zone ($3,157)
This zone served as the springboard for the current bullish impulse.
Price wicked into this level multiple times and formed long lower shadows, confirming buyer absorption.
Acts as the last line of defense for bulls if price retraces after a fakeout or failed breakout.
🔸 Major Resistance Zone ($3,393)
This level is derived from historical supply, where sellers previously overwhelmed buyers.
Now identified as the target zone in case of a successful bullish breakout from the triangle.
A breakout above the triangle would likely trigger buy-side liquidity up to this resistance area.
🔄 Trade Scenario Planning
✅ Bullish Breakout Setup:
Entry: Above upper triangle boundary (aggressive) or after successful retest (conservative).
Confirmation: Break and close above triangle with volume.
Target: $3,393 (major resistance zone).
Stop Loss: Below last higher low inside triangle or breakout candle low.
Risk-to-Reward: Favorable if managed properly from triangle base.
❌ Bearish Breakdown Scenario:
Entry: Below triangle support trendline or upon hitting marked Sell Stop at ~$3,223.
Confirmation: Strong bearish candle closing below the triangle with rising volume.
Target: $3,157 support zone (first target), lower if momentum continues.
Stop Loss: Just above the breakdown candle or inside triangle top.
This provides a hedge setup if the market traps breakout buyers.
📉 Curve Zone & Parabolic Projection:
A curve zone has been drawn to simulate a potential parabolic move to the upside.
If price respects the curve, we might witness accelerated buying once the breakout confirms.
This is a visual guide to monitor momentum alignment with volume and RSI.
📊 Conclusion:
The market is currently in a compressed volatility phase within the triangle. Price is winding up and preparing for a large move. The setup provides a dual-opportunity strategy, allowing traders to position for either direction, depending on which side breaks first. Key levels of support and resistance are clearly defined, and risk can be tightly managed around the breakout points.
This triangle pattern, coupled with a prior CHoCH and clear curve trajectory, gives a strong technical bias for a bullish breakout, but always stay alert for fakeouts and liquidity grabs, especially before big economic news.
🔔 Trading Notes:
Watch for breakout volume and RSI divergence.
Avoid entering prematurely—confirmation is key.
Use alerts at breakout levels.
Be aware of fundamental catalysts (e.g., USD news, Fed decisions, geopolitical tensions).

How to layout in the battle between long and short positionsGold surged directly at the opening, which is in line with our analysis expectations. We gave a short position near 3240-45. As expected, gold fell to the 3230 line for profit. There is great pressure from above and limited space above. Up to now, it has been fluctuating near 3220. For gold, we are now focusing on the short-term support of 3200-06. If it breaks through this position, it is very likely to go to the 3175-90 line.
From the current trend analysis, today's support continues to focus on 3170-80, strong support 3150, and upper pressure 3253-60. Relying on this range as a whole, the main tone of high-altitude low-multiple cycle participation remains unchanged. In the middle position, you must watch more and move less, be cautious in chasing orders, and wait patiently for key points to enter the market. I will notify you of the specific operation strategy in time and pay attention to it in time.
Gold operation strategy: short gold rebound near 3240-50, target 3230-3220. Pay attention to the support of 3202 and 3175 below, and go long according to the strength of the decline!

5/19 Gold Trading Signals🔍 Market Overview:
Last Friday, gold prices entered the 3176–3148 buy zone, and after the market opened today, prices rose to 3249, yielding substantial profits.
From a technical perspective, the overall trend is still under the pressure of a double-top pattern. In the short term, price action remains in a range, but the lows are gradually rising. However, indicators are not yet favorable for bulls. In this case, if the bulls want to take control, then the support at 3182–3176 becomes extremely important during any pullback.
🗞️ News Background:
Trump’s tax cut bill has been approved by a key committee in the U.S. House of Representatives.
👉 This week, further progress must be closely monitored as it directly impacts gold's safe-haven demand.
If trade tensions flare up again, gold is likely to rise sharply due to renewed safe-haven demand.
If tensions continue to ease, downward pressure on gold will likely increase.
Also, watch out for any comments on monetary policy — if rate cut expectations increase, gold could face additional downside risk.
📈 Today’s Trading Strategy:
🟢 Buy Zone: 3196 – 3176
🔴 Sell Zone: 3293 – 3318
🔄 Scalp/Flexible Trading Zones:
3188-3209-3236-3252-3269-3282

XAUUSD Analysis todayHello traders, this is a complete multiple timeframe analysis of this pair. We see could find significant trading opportunities as per analysis upon price action confirmation we may take this trade. Smash the like button if you find value in this analysis and drop a comment if you have any questions or let me know which pair to cover in my next analysis.

gold(4H)📌 Gold (XAU/USD) - Key 4H Levels
🔍 Critical Zones:
▫️ Resistance: 3320-3348$
▫️ Support: 3120$
▫️ Trend: Bullish above 3120$
⚡️ Trade Plan:
• Entry: 3120-3200$
• Target: 3320$ | SL: 3120$
• Risk: ≤1% capital
💬 Poll:
"Which scenario is likely?
1) Break 3348$
2) Reject at 3320$
Reply ↓"

Gold ended this week successfully!In terms of news, first, the easing of the trade situation weakened the safe-haven property of gold. Secondly, a series of data released this week and the Fed's emphasis on not rushing to cut interest rates also suppressed the gold price. In addition, the parties involved in geopolitical conflicts also began talks. Although there are differences in negotiating positions, they still have to solve the problem when they can sit down and talk. Because of the repeated news, the closing price at the end of the week was also above 3200, so some people still believe that the gold price will go to 3500, and even think that it will exceed this position. I have mentioned this in my previous analysis. The gold price was first stimulated by multiple news and buying rushed up. Now that the risk aversion has receded, I think it is reasonable to see the gold price fall.
Let's analyze it from the technical side: the rhythm of gold has changed rapidly recently, and next Monday is actually the key. The 1-hour moving average of gold has begun to show signs of turning around, so whether it can form a golden cross upwards is the key next time, or it will oscillate a few times and continue to diverge downward. The strength of gold on Monday is very critical. Gold closed with a big positive line on Thursday, which was a very fast trend. However, it fell directly on Tuesday and broke through more than half, so it cannot be said that the bulls are strong. Although it rebounded slightly in the late trading, it still closed with a big negative line. There will be two key positions on Monday next week. Pay attention to 3180 on the bottom of gold. If it falls below 3180 soon after the opening on Monday, then gold will still be weak as a whole. Pay attention to 3215 on the top. If gold breaks through 3215, then gold will be strong as a whole. If gold opens flat on Monday and the upward momentum is not strong, and it is under pressure at 3215, then you can continue to go short in the short term.
TVC:GOLD OANDA:XAUUSD FOREXCOM:XAUUSD

XAUUSD TREND PATTERN 1HOANDA:XAUUSD Good Afternoon Traders. XAUUSD 1H on 17/05/2025
My idea about XAU at 1H after break his pattern, after seeing ma100 and the pattern, i think xau on monday 19/05/2025 will break that dbs area (3195-3211) and continue to 3256-3268 area. Just wait confirmation of break dbs area.
Please discuss about this thing, and stay keep your money with your trade strategy and risk reward plan. Thankyou.
DISCLAIMER ON!

GOLD H4 Weekly Chart Update For 19 - 23 May 25As you can see that GOLD H4 for weekly term
First of all note all mentioned levels Carefully, right now market just close above 3200 psychological level
2 upside GAPS remains in focus for now
1st one around 3330-3340
2nd one is 3430
so keep in mind overall trend is remains bullish for now on senior timeframes

Gold still has room to fall and rebounds to continue to shortGold fell as expected in the Asian session, which was in line with our thinking and expectations. Our short position was shorted near 3237-38 and exited with profit, and then shorted near 3194 and exited with profit again, and we made good profits both times. There are many people who followed the trend and went long in today's market, or even chased the long position, and without exception, they were trapped and wailing. We have repeatedly emphasized that we should treat it with a sweeping approach, and different market rhythms should be responded to with different methods. Judging from the current market trend, the European session continues to weaken. The focus should be on the gains and losses of 3180 support. If it breaks through, it will continue to look at 3150 and 3120. In this case, the short-term will return to weakness. If it does not break, we will look at a wide sweeping range. The upper pressure will focus on 3200, 3215, and 3230. The rebound will be mainly high. The weekly line will be closed tonight, and volatility will intensify.

XAUUSD FLAG BULLISH PATTERN (HIGHER HIGH) ANLYSISThe XAUUSD Market momentum has made a flag bullish pattern showing the strong uptrend had the confirm targets at different zones.
1st Target Zone 3260
Final Target Zone 3350
resistance level: 3100
Conclusion: If the market momentum moves towards target then hold on your trades but if the market moves against to the target then there is an option of stop loss point active and all the trades should be closed.