"Buy Setup @3202 – Layered Entry with Smart Risk Management"Buy @3202
🎯 Targets:
TP1 – 3215
TP2 – 3229
TP3 – 3255
TP4 – 3283
🛑 Stop Loss: 3186
✅ Enter in Layers
✅ Follow Proper Money Management
✅ No Over-Leverage – Stick to the Plan
Xauusdlong

Gold Bullish Outlook - Gold BullishFollowing strong buying momentum observed yesterday, gold is currently consolidating within a falling wedge pattern — a typically bullish setup. A breakout from this pattern could trigger a fresh upward move in the price of gold.
Post-Breakout Bullish Targets:
Target 1: 3230
Target 2: 3240
Target 3: 3250
Target 4: 3275
Disclaimer: This is a technical analysis-based outlook. Please assess your risk-to-reward ratio and follow your individual trading strategy. This is not financial advice — trade responsibly and according to your plan.

GOLD 1H Chart Analysis – Market Structure Shift & Liquidity ZoneThis 1-hour chart for XAU/USD (Gold Spot vs. U.S. Dollar) from TradingView displays a detailed technical analysis highlighting key market structure events such as Break of Structure (BOS), Change of Character (CHoCH), and liquidity zones. A descending trendline indicates bearish pressure, while recent CHoCH suggests a possible bullish reversal. Key supply and demand zones are marked in red, with liquidity grabs and imbalances visualized using shaded areas. Price currently hovers around the 3,211 level, approaching a resistance zone after reclaiming bullish momentum. Traders may look for reactions near the supply zone or a break above trendline resistance for confirmation.

Gold operation strategy analysisAt present, the long and short views in the gold market are significantly different, and the effectiveness of technical positions has been verified. The 3180 point has not shown an effective support role in the recent downward process. Its logic as a potential pressure point lacks price behavior verification, and we need to be vigilant against the risk of misjudgment caused by subjective preset technical positions. As for the short strategy at 3200 points, if 3230 is used as the stop loss, the risk exposure of more than 30 US dollars is disproportionate to the current volatility range, and the profit and loss ratio needs to be strictly evaluated in actual transactions. In the current market environment, the price has not yet shown a clear bottom signal. The operational level should focus on optimizing the risk-return ratio and avoid excessive gambling on short-term fluctuations during the trend continuation stage. It is recommended to wait patiently for clearer technical signals or fundamental drivers to intervene.
Gold continued its decline last week, refreshing a new low in a month, but the gold price bottomed out and rebounded during the day, indicating that there is strong bargain hunting below. Gold's support below, from the 30-minute analysis, the upper short-term resistance is around 3180-3185, with a focus on the 3200-3210 line. The pullback will rely on this position to continue the main short trend and look down. The short-term long and short strength watershed is 3235-3240. Before the daily level breaks through and stands on this position, any pullback is a short-selling opportunity.
Operation strategy:
1. It is recommended to short gold when it rebounds to 3180-3185, with a stop loss at 3193, and the target is 3170-3160, and the break is 3160-3130

5/16 Gold Trading Signals
🌇Good afternoon, everyone!
Gold made a strong one-way rally from 3120 to above 3200 yesterday, perfectly achieving our bullish target with substantial profits.
Today, after a slight uptick at the open, gold started to pull back and enter a consolidation phase. Technically, this is a normal correction after a $120 surge. However, the key question now is:
🔍 Is this just a healthy pullback, or a bearish continuation pattern?
There’s some uncertainty in the current structure:
On the larger scale, the market still appears to be forming a double top.
On the shorter-term, this week’s pattern resembles a head and shoulders bottom, and price is now testing the neckline zone.
🧭 So, while the direction remains unclear, we can still identify key trading zones to act on.
🗞 News Watch:
Several important U.S. data releases are scheduled during the New York session. They may provide crucial directional signals for gold.
📌 Today’s Gold Trading Strategy:
🟢 Buy Zone: 3176 – 3148
🔴 Sell Zone: 3265 – 3287
🔄 Flexible Trading Zones (watch for reversals or breakout plays):
▫️3187-3198-3209-3237-3258-3267
✅ Reminder: With the structure being complex and direction unclear, avoid aggressive positioning. Focus on scalp or short-term trades near key zones and react to market post-data.

Latest trading opportunities for XAUUSD.The market went to the target position smoothly as expected.
Due to the sharp decline this week, there was a huge rebound in technical demand on Thursday. The highest broke through 3175/3200/3250. There were some pullbacks in the Asian market. So what positions should we pay attention to now? How to trade?
From the news side. The results of today's meeting between Russia and Ukraine are very important. The delay of one day in yesterday's negotiations has increased geopolitical uncertainty again. This is the biggest black swan event and the factor affecting the rise of XAUUSD. Before the results are announced today. There are still uncertain factors, which are the support for the decline of XAUUSD. However. If the results of the meeting are announced on the news side, then XUAUSD will have a corresponding response in the market. Then we can naturally choose the direction of trading.
Two results. Stop or extend the truce, then XAUUSD will fall further. If no agreement is successfully reached, then it is an opportunity to buy. So the impact of today's news results is very large. It needs to be paid attention to.
The basic data needs to pay attention to the support of 3200. Maintain the principle of long.

Cumulative recovery above 3190, maintain⭐️GOLDEN INFORMATION:
Gold price (XAU/USD) fails to build on Thursday’s sharp rebound from the $3,120 area — its lowest level since April 10 — and comes under renewed selling pressure during Friday’s Asian session. The 90-day trade truce between the US and China has alleviated some of the strain on global financial markets, weighing on demand for the safe-haven metal.
Nevertheless, lingering geopolitical tensions and a weaker US Dollar continue to offer underlying support, limiting the downside. Additionally, growing market expectations for further interest rate cuts by the Federal Reserve may deter traders from adopting strong bearish positions on gold in the near term.
⭐️Personal comments NOVA:
Gold prices recover, buyers are determined to keep prices stable around the 3200 mark in May. Waiting for new bullish momentum after tariff negotiations end
⭐️SET UP GOLD PRICE:
🔥SELL GOLD zone : 3287- 3290 SL 3294
TP1: $3270
TP2: $3260
TP3: $3250
🔥BUY GOLD zone: $3173 - $3175 SL $3168
TP1: $3188
TP2: $3200
TP3: $3218
⭐️Technical analysis:
Based on technical indicators EMA 34, EMA89 and support resistance areas to set up a reasonable BUY order.
⭐️NOTE:
Note: Nova wishes traders to manage their capital well
- take the number of lots that match your capital
- Takeprofit equal to 4-6% of capital account
- Stoplose equal to 2-3% of capital account

Gold is likely to trend upward Gold has made a perfect V - shaped reversal today. It opened at 3,177 and declined unilaterally in the Asian session, once dropping to around 3,120, reaching a new low since April 10. Then it gradually climbed all the way, and has now completely recovered the decline, with a rising trend.👉👉👉
On Friday, we continue to anticipate a bullish daily close for gold. However, if the pullback falls below 3,200, the daily cycle may narrow again, leading to a sustained rebound to 3,235 and 3,260. Therefore, the key point is to monitor whether the price holds above or breaks below 3,200.
For short-term trading of gold, the recommended strategy is to focus on going long during pullbacks and supplement with shorting during rebounds.
Short-term key resistance to watch above: 3250-3260 level
Short-term key support to focus on below: 3190-3200 level
XAUUSD trading strategy
buy @ 3210-3215
sl 3195
tp 3230-3240
If you think the analysis helpful, you can give a thumbs-up to show your support. If you have different opinions, you can leave your thoughts in the comments. Thank you for reading!👉👉👉

XAU/USD 1-Hour Chart Analysis – Bullish Momentum Towards Supply This 1-hour chart of Gold Spot (XAU/USD) from OANDA shows a strong bullish reversal following a recent sell-off. The price is approaching a key supply zone, where two potential target levels are identified:
Target 1: ~3,210 USD
Target 2: ~3,220 USD
The chart highlights previous resistance zones and current price action suggesting momentum toward these targets. The bullish run follows a reversal from a "Weak Low" area near 3,115 USD. Zones are color-coded for supply/resistance (red) and demand/support (green). The setup indicates possible short-term buying opportunities as price tests previous consolidation zones.

Will gold continue to rise after breaking down?Technical analysis of gold: the daily cycle is constructed based on the M-head pattern. 3202 is the bullish defense position. If it cannot go up at the close, there will be further declines. A major technical breakdown has occurred. Pay attention to the change in thinking. If the adjustment is large, it may even reach 2900/3000. It rises quickly and falls just as quickly, but the long-term logic of gold's rise remains unchanged. It is also an opportunity to deploy more when it goes down, but the position needs to be observed by the market. It is difficult to predict at present. In the short term, rely on 3198 to do short selling. After breaking 3200, pay attention to shorting even if it rebounds. If it rebounds upward, go short at the golden section resistance of 3265.
After gold fell below 3202 in the US market, it rebounded to 3198 at its highest. This rebound was just an oversold rebound, and then continued to fall back. Although it has not refreshed the low point for the time being, the pattern has weakened and it is difficult to rise again. Weak shorts can hardly get past 3198. The short-term support below is 3140/3150. Gold 1 hour still continues to cross downward short positions, and the short-term strength is still there. The rebound still continues to give shorts opportunities. There is no obvious sustained upward momentum in the short term, so such a market is just a rebound. Gold rebounds in the US market and continues to be short.
Overall, today's short-term operation strategy for gold is to short on rebounds and to go long on pullbacks. The short-term focus on the upper side is 3202-3205 resistance, and the short-term focus on the lower side is 3150-3155 support.
Short position strategy:
Strategy 1: Short 20% of the position in batches near 3198-3202 in the early trading of gold, stop loss 10 points, target near 3180-3170, and look at 3150 if it breaks;
Long position strategy:
Strategy 2: Buy 20% of the position in batches near 3150-3155 when gold falls back, stop loss 10 points, target near 3170-3190, and look at 3200 if it breaks;
Gold latest strategy analysisOn Thursday, spot gold gradually rebounded from around a one-month low of $3,120 per ounce. Although a brief resurgence in risk aversion supported gold prices, factors such as the easing of China-U.S. trade tensions, reduced market expectations for Federal Reserve rate cuts, and the rise in U.S. Treasury yields continued to suppress bullish momentum. Market focus has shifted to the U.S. PPI data and Federal Reserve Chair Powell's speech in the evening, which may provide new drivers for gold to break through its current trading range. Interest rate futures show that expectations for rate cuts within the year have been significantly reduced from 100 basis points a month ago to around 50 basis points, pushing the 10-year U.S. Treasury yield to a one-month high and directly suppressing the performance of non-yielding assets like gold.
Gold showed a trend of falling first and then rising today, with a breakout to the upside, indicating strong upward momentum. However, the probability of a straight-line rally is low, and a breakout may occur after a period of consolidation and oscillation. Overall, after the full release of bearish momentum, gold is expected to experience a rebound. Today's trading strategy may consider laying out long positions on pullbacks as the primary approach, supplemented by short positions at highs. Resistance is focused on the $3,215–$3,225 area, while support lies at $3,175–$3,165.
you are currently struggling with losses, or are unsure which of the numerous trading strategies to follow, at this moment, you can choose to observe the operations within our channel.

5/15 Gold Trading Signals🌇Good afternoon, everyone!
Yesterday, gold broke the support after some sideways movement and touched the buy zone near 3170, but profit was limited.
Today, after opening, gold rebounded to above 3190 but faced resistance and started dropping again. Notably, the 1-hour chart shows bullish divergence, and although not yet corrected, such divergence usually leads to a rebound of at least $60 — a potential opportunity worth watching.
🗞 News Highlights:
U.S. Initial Jobless Claims
Research conference on monetary policy and economy
These events may significantly impact gold, so stay alert.
📌 Today’s Trading Strategy:
🟢 Buy Zone: 3113 – 3076
🔴 Sell Zone: 3208 – 3223
🔄 Flexible Trading Ranges:
▫️3123-3152-3168-3187-3198
✅ Maintain cautious, flexible positioning. Watch for divergence correction opportunities for a potential sharp rebound.

Gold going to re-test 3270 ?There is a potential bullish move on the 4 hour chart.
Gold is trading in the Resistance zone, near the lower line of the channel.
Stop loss: 3127
Take profit: Around 3270

Gold Breaks Lower: Geopolitics Calm, Yields Rise, Bulls RetreatOANDA:XAUUSD Gold weakened beneath $3,150 as easing US-China trade tensions and fading Fed rate cut expectations dented safe-haven demand. US Treasury yields rose, putting further pressure on non-yielding assets. Technically, gold is testing crucial support at $3,123. A break lower can see potential for downward movement to $3,084. Fed Chair Powell speech and PPI data remain key for short-term guidance.
Resistance : $3,171 , $3,229
Support : $3,123 , $3,084

Gold plummets, pay attention to the 3100 first-line support🗞News side:
1. Russia and Ukraine hold ceasefire talks
2. Initial jobless claims data released during today's US trading session
3. Trump administration exposed to trillions of national debt
📈Technical aspects:
Gold has been in a sideways consolidation yesterday, and we did not have a good entry opportunity to trade in the evening. Today, it has been falling with inertia since the opening of the market. It has now fallen to around 3130, successfully breaking through 3150, the key early point. At present, the daily chart of gold is in a downward wedge arrangement, with the focus on 3130 support below and 3200 suppression above. If the European market cannot fall below 3130, then be wary of bullish counterattacks.
On the other hand, if we fall below the 3130 line, we will fall back and continue to focus on the 60-day moving average support 3105-3110 area. Therefore, in terms of operation, gold will first focus on the 3130 first-line support. If it breaks below, wait for the 3105-3110 area and then consider buying based on the long-short game. The top target is the 3190-3200 area. If it does not break 3200, then go short!
If you agree with this view, or have a better idea, please leave a message in the comment area. I look forward to hearing different voices.
FOREXCOM:XAUUSD FXOPEN:XAUUSD TVC:GOLD FX:XAUUSD OANDA:XAUUSD

XAUUSD SellThis week's trading cycle is fast. And there are huge fluctuations. The news is still more negative. So the decline is expected. Followers have also gained rich profits.
At present, the entire trading logic is still mainly selling. With the gradual realization of the goal, the space below becomes larger.
After the target of 3160-3130 is reached, XAUUSD has reached the lowest position of 3119. This is a huge drop. The trading opportunities are also greater. At present, 3150-3130 is a support in a dense trading area. In the short term, you can pay attention to the rebound position of 3160-3172DE selling position. The target is 3100-3070.
If it breaks through 3175, then the short-term needs to pay attention to the upper pressure level of 3200-3210. The transaction is still mainly selling.

Gold Holds Key Support Ahead of CPIOANDA:XAUUSD Gold (XAU/USD) edged higher to $3,255 early Tuesday as traders awaited the US April CPI report. While the 90-day US-China tariff truce improved market sentiment and limited gold’s upside, geopolitical tensions in Ukraine, the Middle East, and South Asia continue to drive safe-haven flows. A de-escalation in US-China trade tensions triggered the recent pullback, with price failing to reclaim the $3,271 resistance. The $3,213 area remains a major support. A break above $3,271 is needed to resume bullish momentum, while failure to hold $3,213 could expose $3,127.
Resistance : $3,271 , $3,305
Support : $3,213 , $3,127

Gold slips as trade optimism dents safe-haven demandOANDA:XAUUSD Gold remains stable around $3,237 as easing US-China trade tensions eroded safe-haven demand. The US cut its "de minimis" tariff on small Chinese parcels to 30%, with further progress in talks dampening gold's short-term appeal. Market focus now turns to the upcoming US PPI data for clues on the Fed’s rate path. Technically, gold is hovering just above the key $3,213 support. A break below could trigger further losses toward $3,132. Resistance remains near $3,264 and $3,306.
Resistance : $3,264 , $3,306
Support : $3,213 , $3,132

Gold heads towards 3100 price zone, long or short?
📌 Driving Events
Gold prices (XAU/USD) fell for the second straight session on Thursday, the third decline in the past four days, and fell to a more than one-month low below $3,150 during the Asian trading session. The continued downward pressure is largely due to renewed optimism after signs of a substantial de-escalation in the Sino-US trade dispute, a development that has dampened demand for traditional safe-haven assets such as gold.
The announcement of a 90-day trade truce between the world's two largest economies also helped ease recession fears in the United States, prompting investors to reduce expectations for aggressive monetary easing by the Federal Reserve. The shift supported the continued rise in US Treasury yields, further suppressing demand for the non-interest-bearing gold.
📊Comment Analysis
Downtrend, bears continue to exert downward pressure on the market, heading towards the 3100 price area
⭐️Set Gold Price:
💰Strategy Package
🔥Sell Gold Area: 3178-3188 SL 3191
TP1: $3180
TP2: $3170
TP3: $3160
🔥Buy Gold Area: $3101 - $3099 SL $3094
TP1: $3110
TP2: $3120
TP3: $3130
⭐️ Note: Labaron hopes that traders can properly manage their funds
- Choose a lot size that matches your funds
- Profit is 4-7% of the fund account
- Stop loss is 1-3% of the fund account

XAUUSD target range 3160-3130Continue to short and make a profit. So how to trade next time?
The news is very stable at present. Especially about the news related to geopolitics and tariffs, there are no more conflicts to cause the momentum of XAUUSD to rise. So the feedback on the chart is a decline.
Although there were some small losses in buying. But the subsequent shorting made a good profit. After making up for the losses, there is still some profit.
Next, continue to pay attention to the target range of 3160-3130 below. Investors with larger funds can choose to trade at the current price. 3210-3200 gradually increase the buy order. More detailed information can be obtained in the band trading center.
If you don’t pay attention, you can observe and read it. You can also leave me a message.

Will gold rise today?Hello everyone. Let's discuss the trend of gold this week. From the current 1-hour chart range, gold is at risk of falling again to 3200.
The current 1-hour chart range has been broken. After breaking the range support today, it has rebounded again, so the previous support has become a suppression position.
Therefore, if gold cannot stand above 3250, then we must be careful of the risk of gold testing 3200.
You can focus on 3240-3250. As long as it cannot stand above 3250, you can sell gold at 3240-3250. The target below is still around the bottom of the range 3200.

Short selling on the rebound is determined to winAfter gold fell below 3202 in the US market, it rebounded to 3198 at its highest. This rebound was just an oversold rebound, and then continued to fall back. Although it has not refreshed the low point for the time being, the pattern has weakened and it is difficult to rise again in the evening. Weak shorts can hardly get past 3198. The short-term support below is 3150-3140. Gold continues to cross downward shorts in 1 hour. The short strength is still there. The rebound continues to give shorts opportunities. There is no obvious sustained upward momentum in the short term. Then such a market is just a rebound. Gold rebounds in the US market and continues to be short. On the whole, the short-term operation strategy for gold today is recommended to be short on rebounds and long on pullbacks. The short-term focus on the resistance line of 3202-3205 is on the upper side.
Gold operation strategy reference:
Strategy 1: Short gold near 3195-3205, target near 3180-3170.
Strategy 2: Long gold near 3160-3150, target near 3170-3190.

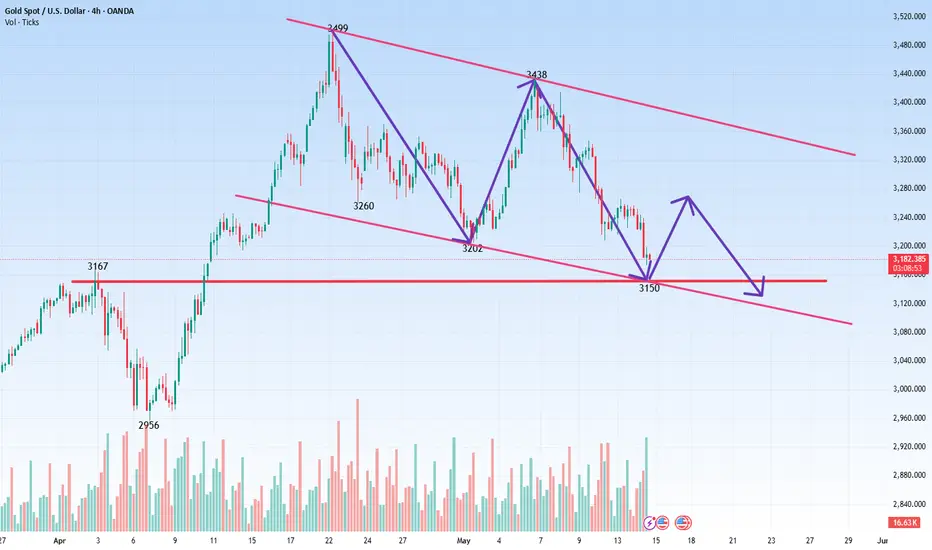
XAUUSDHello Traders. This is my analysis for XAUUSD.
I am not a professional and I would be happy if you share your opinion in the comments.
