Gold long and short repeated operation
📌 Negative driving factors
Gold prices fell below $3,320/ounce on Thursday as the US-UK trade agreement improved risk appetite. Gold fell nearly 4% in two days as the US-UK agreement boosted risk appetite and demand for the US dollar.
📊Comment analysis
Gold fell directly at the opening of the Asian session today, and did not provide a good position for short selling. However, it rebounded and rose later, regaining its footing at 3,330. The short-term price fluctuated between long and short.
💰Strategy Package
🔥Sell Gold Zone: 3351-3353 SL 3358
TP1: $3340
TP2: $3330
TP3: $3320
🔥Buy Gold Zone: $3232 - $3234 SL $3227
TP1: $3245
TP2: $3260
TP3: $3270
⭐️ Note: Labaron hopes that traders can properly manage their funds
- Choose the number of lots that matches your funds
- Profit is 4-7% of the capital account
- Stop loss is 1-3% of the capital account
Xauusdlong

Gold is in shock again, will the short position continue?🗞News side:
1. Tariffs push up inflation and slow down the economy, and the Federal Reserve may be in trouble
2. The situation between India and Pakistan escalates again
📈Technical aspects:
Gold experienced a big plunge yesterday, and today it bottomed out near 3275 again and then started to rebound. The current gold price is caught in a wide range of fluctuations, with long and short positions frequently alternating to impact the market, making it difficult to form a unilateral trend. At present, the gold price once rebounded to around 3330. If the gold price breaks through the 3336 line, short-term trading in the European market may touch the upper level near 3350, or even the 3365 line. Today's market cannot chase the rise and sell the fall. Overall, it is still a wide range of fluctuations. It should be a violent roller coaster before the subsequent surge. The European session relies on the low point of 3310 to step back as a defense, focusing on the upper 3350-3360, and further close the key resistance of 3370. The short-term focus below is the support of 3280-3290.
If you agree with this view, or have a better idea, please leave a message in the comment area. I look forward to hearing different voices.
OANDA:XAUUSD FX:XAUUSD FXOPEN:XAUUSD FOREXCOM:XAUUSD TVC:GOLD

Gold XAUUSD Possible Move 9th May 2025🟨 XAUUSD (Gold) Analysis – 09 May 2025
Market Structure Overview:
The market was previously in a bearish trend, forming consecutive Lower Lows (LL) and Lower Highs (LH).
A bullish shift in structure occurred when price formed a Higher Low (HL) followed by a Higher High (HH), breaking and closing above the previous Lower High.
This break of structure signals a potential trend reversal or deeper pullback in progress.
Key Levels:
Support Zone (Demand): Around 3,315 – 3,325 (recent breakout zone and potential retest area).
Resistance Zone (Supply): Around 3,365 – 3,375 (previous structural HH + liquidity pool).
Expectations:
If price sustains above the 3,315–3,325 support zone, we expect a continuation to the upside targeting the 3,365–3,375 supply zone.
If price fails to hold above support, a rejection and continuation to the downside toward 3,280 is likely.
🔔 Trading Signal (Setup Idea):
Type: Buy (Conditional)
Entry:
Buy on confirmation from support (e.g., bullish engulfing, FVG, or sweep + bullish structure) around 3,320–3,325.
Stop Loss:
Below the swing low or invalidation level: 3,310
Take Profit:
TP1: 3,340 (minor resistance)
TP2: 3,365–3,375 (major supply zone)
Risk/Reward: Minimum 1:2 RRR
Confirmation Tips:
Look for bullish price action at the support zone (e.g., bullish pin bar, demand FVG, CHoCH).
Use volume, OBV, or momentum divergence for additional confirmation.
Show support by following, comment and sharing.

#XAUUSD: Price to go beyond $3650 to $3700 around 3500 pips moveThe XAUUSD price is moving nicely as we had predicted in our previous analysis. Both of our analyses have hit the take-profit target, and we are likely to see more bullish momentum continue in the coming time. There are two areas where price could move or reverse. Both targets have a long-term view, which means we are talking about a possible swing move that will take time to complete. Stop-loss and intraday target and position can be taken based on your own analysis and overview. Strong fundamentals are needed for price to reach our designated target area.
Good luck and trade safely. Trading financial instruments like gold and other markets brings extreme risk and can be severe if the risk is not managed correctly.
We are sharing our bias here, but it does not guarantee that the move will happen as described.
Once the trade is activated, you can set two targets. You can choose your own take-profit based on your analysis and trade management.
Good luck and trade safely! 😊
Thanks a bunch for your unwavering support! ❤️🚀
If you’re feeling generous, here are a few ways you can help us out:
- Like our ideas
- Comment on our ideas
- Share our ideas
Cheers,
Team Setupsfx_
❤️🚀
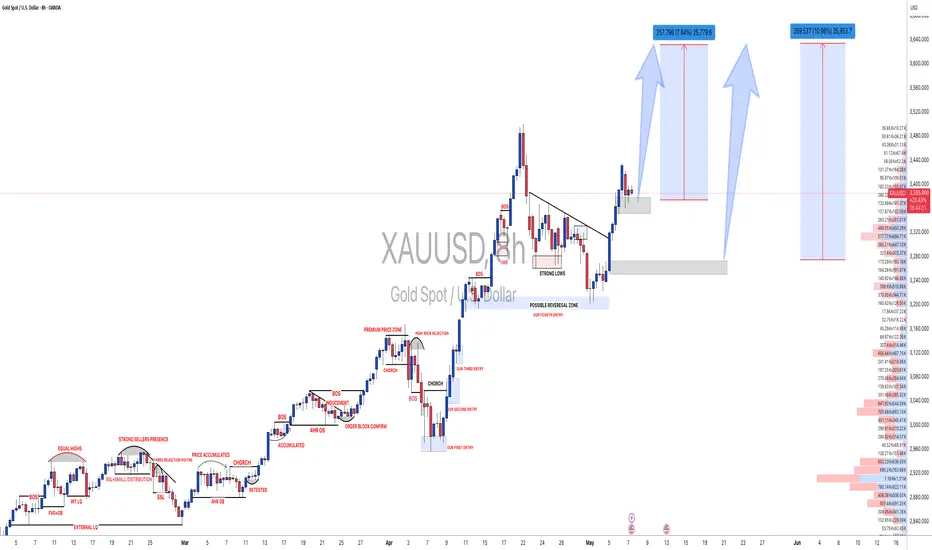
#XAUUSD: Gold to continue rising,$4000 by end of the year targetGold has unexpectedly declined to 3335 in response to the anticipated price increase following the unfolding conflict in Asia. Currently, two regions exhibit price reversals.
The XAUUSD price is progressing in accordance with our previous analysis. Both analyses have successfully reached the take-profit target, and we anticipate further bullish momentum in the near future. However, price movement is subject to potential reversals in two areas. Both targets are long-term oriented, indicating potential swing moves that may take time to complete. Stop-loss, intraday target, and position decisions should be based on individual analysis and overall market assessment. Strong fundamentals are essential for price to reach the designated target area.
We acknowledge our bias in this analysis, but it does not guarantee the realisation of the described outcome.
Upon trade activation, you can establish two targets. You have the flexibility to select your own take-profit based on your analysis and trade management strategies.
We appreciate your unwavering support.
For those who wish to contribute, we offer several avenues for assistance:
- Liking our ideas
- Commenting on our ideas
- Sharing our ideas
Thank you for your continued support.
If you feel inclined, we would be grateful for your generosity.
Best regards,
Team Setupsfx_❤️🚀

Special attention needs to be paid to gold operations on FridayThe current price fluctuates around the 3300-3348 range, with resistance at 3348-3352 and support at 3295-3303. If it breaks through 3348, be wary of a second surge to around 3365; conversely, if it loses 3295, it may fall back to the 3275-55 area.
Gold recommendation: short sell near 3335-3345 when it rebounds. Target position 3320-3310.

How to trade gold trendsTechnical analysis of gold: From a technical perspective, the overall framework of gold's rise has not changed. I said before that from a macro level, the conditions for breaking highs have been met, but in the short term, it will go back and forth several times before it can go up. If there is no adjustment, no washing, no horizontality, no shock, and the foundation is not solid, even if it goes up, it will come down quickly. If you want a solid rise, then give the market more patience. Today, gold is running around the bottoming out and rebounding pattern. After a sharp drop in the early trading, it quickly recovered the lost ground, and the signal has been released: the current key support reference is around 3280, and the upward movement needs to break through and stabilize the key dividing point of 3330. In the early trading, it fell back under pressure at 3330. Only when the entity stands firmly at this position can the breakthrough pattern of yesterday be reproduced. If the Asian and European sessions can close above 3330 steadily, the European and American sessions can directly see the new high of 3360/3370 area.
For today's market, I think it will still fluctuate upward, and will adjust and fluctuate at the current relatively low level for a period of time! If there are friends who are ready to get on the train today, then 3280 or below can be done in batches step by step. After the hourly line cycle opened the decline of 3324 and broke, today's market was not weak, and there was further upward continuation. I also said that the recent market cannot chase the rise and kill the fall. On the whole, it is still a wide range of shocks. Washing the market trend should be a violent roller coaster before the subsequent surge. The European market relies on the low point of 3310 as a defense. In the short term, continue to open more and look up, pay attention to 3350/3360. At that time, a new round of band rise will emerge, and this should be paid attention to! So I said that based on the general trend, short-term corrections are opportunities! On the whole, today's short-term operation strategy for gold is to focus on long positions on corrections and short positions on rebounds. The short-term focus on the upper side is the 3360-3370 line of resistance, and the short-term focus on the lower side is the 3280-3290 line of support.
Short order strategy:
Strategy 1: When gold rebounds around 3360-3365, short (buy short) 20% of the position in batches, stop loss 10 points, target around 3330-3320, break the position and look at 3310
Long order strategy:
Strategy 2: When gold falls back to around 3312-3315, buy long positions in batches (buy up) of 20% of the position, stop loss 10 points, target around 3330-3350, break the position and look at 3360

Gold 100% Profit SignalYesterday, gold surged and then fell. It was under pressure at 3415 in the early Asian session, and short orders were entered at 3413.6. After rebounding to 3369 in the European session, it was under pressure again, and short orders followed up at 3368.5. The overall trend continued to be extremely weak, breaking 3300 in the late trading and accelerating to 3288. It rebounded to above 3300 in the early morning, and the daily line closed with a long lower shadow positive line, indicating that short-term support is effective, but the rebound momentum is suppressed by the previous wave trend. The current gold price is fluctuating in the 3300-3348 range, with upper resistance of 3348-3352. If it breaks through, be alert to a second surge to 3365; the lower support is 3295-3303. If it loses or falls back to the 3275-3255 area. Trading needs to keep a close eye on the dynamics of key positions.
Operation strategy:
1. It is recommended to short gold when it rebounds to 3340-3345, with a stop loss at 3353 and a target of 3320-3300

Gold market operation strategyYesterday, gold surged and then fell. It was under pressure at 3415 in the early Asian session, and short orders were entered at 3413.6. After rebounding to 3369 in the European session, it was under pressure again, and short orders followed up at 3368.5. The overall trend continued to be extremely weak, breaking 3300 in the late trading and accelerating to 3288. It rebounded to above 3300 in the early morning, and the daily line closed with a long lower shadow positive line, indicating that short-term support is effective, but the rebound momentum is suppressed by the previous band trend. The current gold price is fluctuating in the 3300-3348 range, with upper resistance of 3348-3352. If it breaks through, be alert to a second surge to 3365; the lower support is 3295-3303. If it loses or falls back to the 3275-3255 area. Trading needs to keep a close eye on the dynamics of key positions.
Operation strategy:
1. It is recommended to short gold when it rebounds to 3340-3345 area, with a stop loss at 3353 and a target of 3320-3300.

High pressure rebound continues to shortThe hourly moving average of gold has begun to turn downward, and the strength of gold bulls has been suppressed. After the US market rose yesterday, gold fell as expected, hitting the highest point of 3369. We also notified in real time that short orders can be entered at the 3360-65 line, and profit can be taken at the 3340 line. However, if gold rebounds too much, then gold will still fluctuate in a large range. However, if gold rebounds and does not even break through the 3336-40 line, then the strength of gold bulls will not be strong, and gold may enter a short trend. The US gold rebound is under pressure from the 3336-40 line. Continue to sell short at highs
From the 4-hour analysis, the support below is around 3280. If it falls back and does not break, the main bullish trend remains unchanged. Pay attention to the short-term suppression of 3334-40 above. The daily level maintains a high-altitude low-multiple rhythm.
Gold operation strategy:
1. Short gold at 3334-40 when it rebounds, short at 3358-65 when it rebounds, stop loss at 3373, target at 3300-3308, continue to hold if it breaks

XAUUSD Take ProfitThe gold trade I just shared delivered great profit and helped me hit my daily profit target in a single trade :)
So, gold ended up being both the first and last trade of the day.
Tomorrow is the weekend and the FX market will be closed, but as always, the crypto market stays open.
Hopefully, BTC will offer some good opportunities tomorrow :))
Wishing everyone a great weekend!

On May 9, London market BTCUSD real-time trading strategy
Yesterday, it was suggested to buy BTCUSD in the range of 98500-99500. The target of 102k achieved a good profit growth.
Regarding BTCUSD, the current demand is also rising sharply. For Trump's call for BTCUSD, while XAUUSD falls back, this is a positive boost. At present, more factors are pushing BTCUSD to continue to rise. You can pay attention to the retracement of the band support of 101500-10200, and the upper side needs to pay attention to 104500-106000
To prevent missing out on some good trading strategies and ideas, remember to continue to pay attention to the ideas of the swing trading center. If you want to get more and more accurate signals, you can leave me a message.

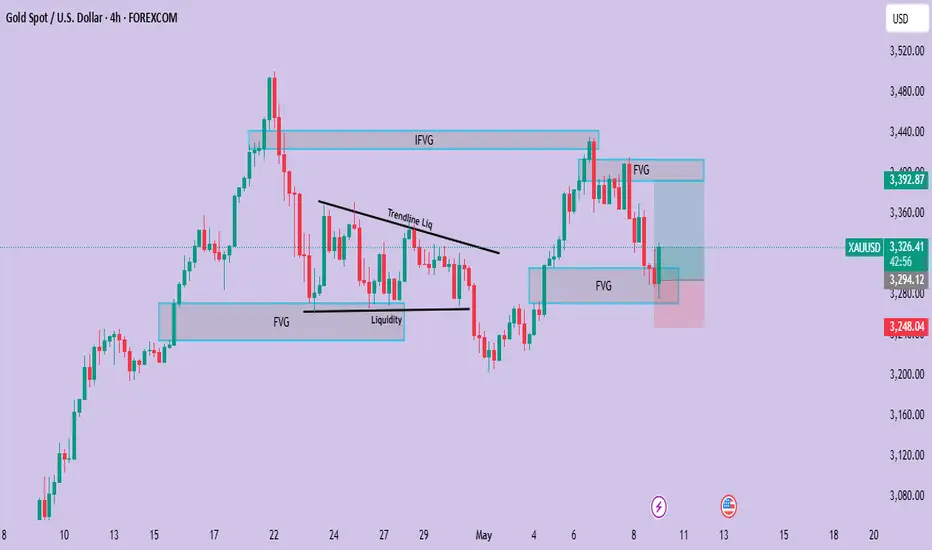
From this point, there is potential for an upward move.Gold (XAUUSD) Analysis
Recently, we’ve seen Gold consistently respecting Fair Value Gaps (FVG). Whenever a bullish FVG forms, price tends to just touch it before moving upward. Similarly, when a bearish FVG appears, the market tends to reject from that point.
Interestingly, we also observed that the market has cleared previously built liquidity right as it tapped the FVG — including both buy-side and sell-side liquidity. Currently, after dropping from a bearish FVG, price is rebounding from a bullish FVG.
From this point, there is potential for an upward move, with a target around $3375. A potential entry zone lies between $3302 and $3280. It's important to watch the market closely and, as always, do your own research (DYOR)!
The buy low and long strategy is coming!From the 4-hour analysis, the support below is around 3308-3300. If it does not break, the main bullish trend will remain unchanged. The upper side pays attention to the short-term suppression of 3360-66. The daily level stabilizes above this position and continues to maintain the low-multiple rhythm.
Gold operation strategy:
1. If gold falls back on the 3325-3320 line, go long, and if it falls back on the 3310-3300 line, it will cover long positions. The target is 3355-3360.

XAUUSD’s precise strategy.After the New York market, XAUUSD has seen some huge declines. 60-70 USD/ounce. Perfect decline.
Regarding the decline mentioned yesterday. These two days have perfectly verified this trading logic, falling from 3438 to 3300. It is completely in line with the analysis expectations. Follow the members and also successfully obtain rich profits.
The two important information mentioned yesterday and today, the interest rate decision and Powell's speech. These are the two bombshells in the current XAUUSD market. After the news landed, there was almost no bigger news to promote the rise in gold prices.
Tariffs were implemented again, reducing market tensions.
Many factors have consolidated the position of the US dollar. It has caused XAUUSD to fall under pressure. At the same time, the demand for the cryptocurrency BTCUSD is greater. Today, the London market clearly pointed out the buying point near 99400. Retreat to 98000 and continue to buy. The New York market rose sharply. The highest reached 101.5k, which also reached the expected range.
If you follow the signal and trade independently. There is profit. It's just a matter of how much. In market trading, you should seize the opportunity when you can accumulate profits. Because opportunities are not always there. So you can follow me to make more lucrative profits with such a good market.

XAUUSD Latest trading opportunities.All profits for five consecutive days of trading. Are you still losing money?
Yesterday, I prompted to sell at a higher position. But today, the Asian market has seen some gains. The highest impact reached 3414, and then fell back by more than 100 US dollars, and the lowest touched 3320. Our high-altitude thinking is completely correct.
It has helped members to make some considerable profits from selling orders.
The market changes a lot. The lag is very strong, mainly because the good news is suppressed, leading to the trend of bad news. This is an aspect that needs to be focused on when trading. The market situation better proves the accuracy of my swing trading strategy.
The current price is at 3345. We need to pay attention to the pressure of the 3362-3355 range and the support of 3300. The trading is still mainly selling.
To prevent missing out on some good trading strategies and ideas, remember to continue to pay attention to the ideas of the swing trading center. If you want to get more and more accurate signals, you can leave me a message.

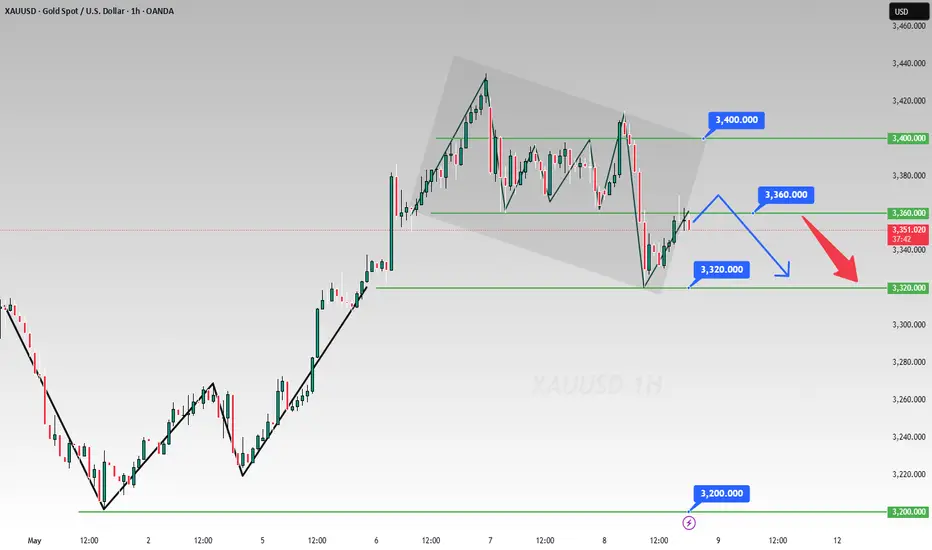
Tariffs, Fed & 3360 Line: Short-Term Bearish Gold Analysis📈 Tariff and International Relations: The Key Drivers of Gold Price 🌐
At present, the most crucial factors affecting the gold price are still the tariff situation and international relations. These global dynamics can quickly shift market sentiment, making gold a barometer for economic and geopolitical stability. Tensions often send investors flocking to the safety of gold, while diplomatic breakthroughs can ease its appeal. 📉💼
⚖️ 3360: The Pivotal Divide Between Bulls and Bears 📊
As things stand now, 3360 has clearly become an important dividing line for the game between the bulls and the bears. Technical analysts and traders closely monitor this level day and night. A decisive break above 3360 could fuel a bullish rally, while a drop below might unleash bearish momentum. 🚀📉 Every tick around this number draws intense attention from the trading community. 👀
📰 Real - Time News Shaping the Gold Market 📢
A series of real - time developments, such as the information released by the Federal Reserve, the remarks of Jerome Powell, and the agreements on tariffs signed between the UK and the US, are all influencing the trend of the gold market. Each central bank statement or trade deal announcement can send shockwaves through the market, triggering rapid price movements. Traders constantly refresh their news feeds, ready to react at a moment's notice. 💻⏱️
🌍 Future Outlook: A Bearish Short - Term Trend 📉
With the development of the situation, the tariff issue is likely to be further alleviated in the future. Based on this, from a short - term perspective, the gold price shows a bearish trend. However, long - term investors should also keep an eye on other variables like inflation rates and geopolitical flashpoints that could potentially reverse this trend. After all, the gold market is full of surprises! 🎯🔮
⚡️⚡️⚡️ XAUUSD ⚡️⚡️⚡️
🚀 Sell@3360
🚀 TP 3340 - 3320
Accurate signals are updated every day 📈 If you encounter any problems during trading, these signals can serve as your reliable guide 🧭 Feel free to refer to them! I sincerely hope they'll be of great help to you 🌟 👇
Gold Analysis StrategyGold really made a big joke today. The market turned from long to short, and the high platform dived to form a waterfall.
Gold opened with four consecutive positive rises, strongly breaking through the high point of 3397 of yesterday's oscillating sideways. The hourly line was directly pulled up, reaching the highest point of 3415. Then it slowly fell and weakened, forming a waterfall-like drop, and the 3360-3350 support was directly broken, ushering in an accelerated decline, and the lowest point reached 3320 before rebounding.
Therefore, the continuous positive of gold here is a false breakthrough, and the bulls were directly blown up. Look at the market here on Monday and the trend today. They are all stabilized by three consecutive positives first, followed by a strong breakthrough of the big positive.
The difference is that on Monday, it continued here, while today it was completely the opposite. According to the normal technical aspect, the strong break in the morning and the adjustment back to the 3400-3397 support in the afternoon must be seen from the continuation, but the reality gives you a big slap in the face.
The current market has deviated from the normal trend. It either rises straight or falls wildly without any rebound. After Trump took office, the abnormal fluctuations in the gold market have been significantly amplified, becoming the same as Trump.
It rises by $100 when it rises and falls by $100 when it falls. This morning, it went from 3315 to 3220, and it almost moved another $100 before it adjusted. This needs to be paid attention to. If gold moves like this, today's trend has undoubtedly turned to the empty side, and it is only a shock at most. There is definitely not much hope for the bulls.
Later today, the European and American markets will focus on two positions: the first position is the 3360 line of pressure above. Yesterday's low point broke the support and turned into pressure. If the top and bottom conversion positions are touched, it is still bearish.
The second position is 3305, which is the second starting point of the strong rise in the previous two days. According to the drop of 100 US dollars from 3415, it is at 3315. The drop exceeds 100 US dollars. There is basically no problem in rebounding.
Therefore, we can expect a rebound around the 3305-3310 area below. The probability of falling below 3300 today is not high, and it is easy to come up even if it goes down.

Gold prices are plummeting, is a bear market coming?🗞News side:
1. China and the United States hold talks on trade issues
2. India-Pakistan conflict escalates again
3. Geopolitical risks
📈Technical aspects:
Today, gold surged to the 3410 line and then ushered in a sharp fall, with the lowest touching near the 3322 line. We also seized the opportunity to notify our VIPs to enter the market, and all VIP members made good gains. At present, gold is still following the news, and the fundamental influencing factors are relatively complicated. Retail investors who trade alone can easily get caught up in the recent gold fluctuations. The gold price fluctuated repeatedly around 3340. The European session focused on the conversion suppression of the 3350-3360 support area. The 4H Bollinger Bands showed a closing shape. If the gold price cannot stand above 3350, then the bulls need to be repaired in the short term before they can continue to rise. The European session focused on the 3350-3360 resistance above and the 3310-3300 support below.
If you agree with this view, or have a better idea, please leave a message in the comment area. I look forward to hearing different voices.
OANDA:XAUUSD FX:XAUUSD FXOPEN:XAUUSD FOREXCOM:XAUUSD TVC:GOLD

Gold analysis layout!Gold really made a big joke today. The market turned from long to short, and the high platform dived to form a waterfall.
Gold opened with four consecutive positive rises, strongly breaking through the high point of 3397 of yesterday's oscillating sideways. The hourly line was directly pulled up, reaching the highest point of 3415. Then it slowly fell and weakened, forming a waterfall-like drop, and the 3360-3350 support was directly broken, ushering in an accelerated decline, and the lowest point reached 3320 before rebounding.
Therefore, the continuous positive of gold here is a false breakthrough, and the bulls were directly blown up. Look at the market here on Monday and the trend today. They are all stabilized by three consecutive positives first, followed by a strong breakthrough of the big positive.
The difference is that on Monday, it continued here, while today it was completely the opposite. According to the normal technical aspect, the strong break in the morning and the adjustment back to the 3400-3397 support in the afternoon must be seen from the continuation, but the reality gives you a big slap in the face.
The current market has deviated from the normal trend. It either rises straight or falls wildly without any rebound. After Trump took office, the abnormal fluctuations in the gold market have been significantly amplified, becoming the same as Trump.
It rises by $100 when it rises and falls by $100 when it falls. This morning, it went from 3315 to 3220, and it almost moved another $100 before it adjusted. This needs to be paid attention to. If gold moves like this, today's trend has undoubtedly turned to the empty side, and it is only a shock at most. There is definitely not much hope for the bulls.
Later today, the European and American markets will focus on two positions: the first position is the 3360 line of pressure above. Yesterday's low point broke the support and turned into pressure. If the top and bottom conversion positions are touched, it is still bearish.
The second position is 3305, which is the second starting point of the strong rise in the previous two days. According to the drop of 100 US dollars from 3415, it is at 3315. The drop exceeds 100 US dollars. There is basically no problem in rebounding.
Therefore, we can expect a rebound around the 3305-3310 area below. The probability of falling below 3300 today is not high, and it is easy to come up even if it goes down.

GOLD Analysis - Can buyers push toward 3,410$?OANDA:XAUUSD is trading within a clear ascending channel, with price action consistently respecting both the upper and lower boundaries. The recent bullish momentum indicates that buyers are in control, suggesting there's chances for potential continuation on the upside.
The price has recently broken above a key resistance zone and now came back for a retest. If this level holds as support, it would reinforce the bullish structure and increase the likelihood of a move toward the 3,410 target, which aligns with the channel’s upper boundary.
As long as the price remains above this support zone, the bullish outlook stays intact. However, a failure to hold above this level could invalidate the bullish scenario and increase the likelihood of a deeper pullback.
Remember, always confirm your setups and use proper risk management.

XAUUSD's next trading trendPowell's meeting is over. Powell's response was very decisive. It is difficult to do it in the short term about interest rate cuts. Therefore, through the content of the meeting, we pay attention to the fact that there is still some pressure on the rise of xauusd. In terms of economic data, the foundation of the US dollar is still strong. The market is still under pressure in terms of operations. At present, we need to pay attention to whether geopolitics will give some upward momentum in the XAUUSD market. Although I don't want to see a turbulent pattern, you need to pay attention to these influencing factors when you trade.
About today's idea of selling xauusd. It has been announced in advance in the London market. If you don't pay attention to the core content of the band trading center. Then you will definitely miss some good transactions. This is for sure. So in order to avoid missing some good trading plans next time. You can follow me.
Continue the selling trading strategy. 3382-3387 can be paid attention to as a short-term selling position. Those with larger funds can rely on the current price of 3374. Sell
Remember to control risks when trading.

XAU/USD - Fed warns of Economic UncertaintyThe XAU/USD pair on the M30 timeframe presents a Potential Buying Opportunity due to a recent Formation of a Bullish Flag Pattern. This suggests a shift in momentum towards the upside and a higher likelihood of further advances in the coming hours.
Possible Long Trade:
Entry: Consider Entering A Long Position around Trendline Of The Pattern.
Target Levels:
1st Resistance – 3473
2nd Resistance – 3519
🎁 Please hit the like button and
🎁 Leave a comment to support for My Post !
Your likes and comments are incredibly motivating and will encourage me to share more analysis with you.
Best Regards, KABHI_TA_TRADING
Thank you.
