There's still a little more left to sip from gold’s cup
Weekly Outlook on Gold (XAUUSD)
Gold has formed a classic cup pattern on the weekly timeframe, indicating a strong bullish continuation setup. If the pattern completes successfully, we could see a move toward the top of the channel, targeting the 4039 – 4100 zone.
The recent pullback to 3208 was a retest of the previously broken daily structure, acting as a healthy correction before the next potential leg up.
For those looking to enter this move, an ideal strategy would be to place a buy stop order above the last high, as a breakout confirmation.
⚠️ Important note: If the black trendline on the daily chart (which represents the current bullish structure) gets broken to the downside, the trade setup would become invalid and a reassessment would be required.
✅ The best approach is to wait for a clean breakout above the 3495 resistance, then look for a pullback entry on lower timeframes with proper risk management.
📉 In the longer term, we still expect a potential retracement all the way back to the 2199.661 level — so be aware of the bigger picture and adapt as the structure evolves.
Xauusdlong

XAU/USD (GOLD) TRADE PLAN 6/5/2025XAU/USD (Gold) Trading Outlook
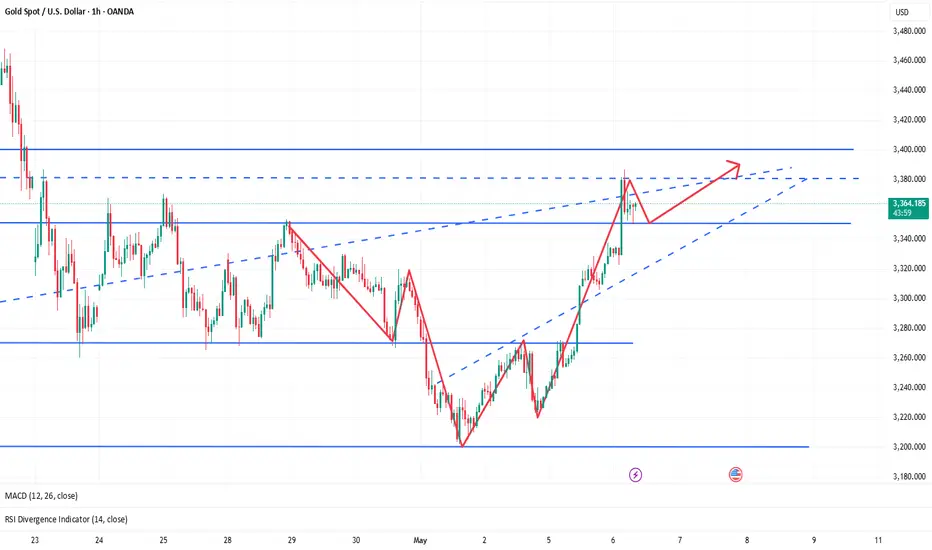
The current price of XAU/USD around 3380 to 3375. We are anticipating a pullback towards the 3300 level, at which point we will look for long (buy) entry opportunities.
Key Resistance/Target Level:
TARGET 1: 3400
TARGET 2: 3450
TARGET 3: 3480
Key Support Levels:
SUPPORT 1: 3200
SUPPORT 2: 3150
This Strategy is based on the expectation of a price retracement, providing a more favorable risk-reward setup for long positions.

Gold XAUUSD Move 06.05.2025🔹 BUY-1: 3350–3355 Zone
Conditions to Enter:
Support must hold at the 3350–3355 zone.
Wait for a clear bullish M15 candle close above the support area to confirm strength.
Rationale:
This zone overlaps with a Fresh Demand Zone identified on your chart.
Entry here takes advantage of potential accumulation and demand absorption.
It's an early entry with a tighter stop loss (just below 3346–3350).
Ideal Setup:
Stop Loss: Below 3346.
Target: Near 3380–3400 zone or higher depending on momentum.
🔹 BUY-2: 3380–3385 Zone
Conditions to Enter:
Price must break above the 3380–3385 resistance zone.
Wait for a successful retest and bullish confirmation (engulfing/imbalance/M15 close above).
Rationale:
This is the breakout and retest trade mentioned on the chart.
Entering after confirmation reduces risk of a fakeout.
Aligns with institutional breakout behaviors.
Ideal Setup:
Stop Loss: Below the retest candle or previous structure (~3370 area).
Target: 3410–3430+ depending on R/R and momentum continuation.
Kindly show your support by follow, comment and share.

XAUUSD (GOLD) | 4H | SWING TRADING Good morning, my friends,
Gold is currently at the 3355.0 level.
Even if gold makes a correction at this point, my target remains 3461.0.
This is a swing trading model, so there may be delays in reaching my target. However, I am confident that I will reach it eventually.
Once we hit that level, I will share an update for you all.
Dear friends, your likes are always my biggest motivation to keep sharing analyses. That’s why I kindly ask each of my followers to show their support—please don’t hold back on the likes.
I sincerely thank everyone who supports me with their likes. It truly means a lot

It is in an upward trend with fluctuations, and the overall viewFrom the perspective of the intraday price action, gold exhibits the typical feature of a rapid rally after a small-cycle correction. On the daily chart, the K-line combination continues to be in a bullish arrangement, and the moving average system shows a divergent upward trend. The technical pattern conforms to the characteristics of a "stepped short squeeze", and there is a relatively high probability that the upward trend will continue in the future.
Taking into account both fundamental and technical factors, the current gold market is still in a strong pattern dominated by the bulls. In terms of the trading strategy, it is recommended to focus on going long on pullbacks. At the same time, be vigilant against the risk of short-term fluctuations triggered by an unexpectedly hawkish tone of the Federal Reserve's policy.
During the US trading session, the price of gold rose to 3,399 and then declined. It is currently quoted at 3,395. The K-line combination pattern on the 4-hour chart is bullish. There is a relatively low probability of a significant trend change on Wednesday, and it is expected to continue to rise in a volatile manner tomorrow.
The short-term support is at 3,374, and the strong support is in the range of 3,370 - 3,366. The short-term resistance is at 3,388, and the strong resistance is at 3,398. If this level is broken, the upward target can be seen at 3,410.
Regarding specific price levels, the area between 3,430 - 3,470 US dollars per ounce (the resonance resistance of the Fibonacci extension level and the previous densely traded area) needs to be closely watched on the upside. On the downside, the support zone between 3,260 - 3,250 US dollars per ounce (the double support of the bullish trend line and the round-number psychological barrier) should be closely monitored.
you are currently struggling with losses, or are unsure which of the numerous trading strategies to follow, at this moment, you can choose to observe the operations within our channel.
Trading Strategy:
buy@3375-3380
TP:3400-3430

Short-term entry can be made at key points.📊Technical aspects:
|Gold showed a clear upward trend today driven by risk aversion, mainly because Trump announced a 100% tariff on films produced overseas, a move that triggered global concerns about trade wars and exacerbated economic uncertainty. In order to avoid risks, investors have turned to traditional safe-haven assets such as gold, resulting in a surge in demand for gold and a subsequent rise in prices. Currently, from the perspective of technical indicators, the 4-hour moving average is in a bullish arrangement, the Bollinger band is in an enlarged form, and the gold price is running close to the upper Bollinger band. Gold is still bullish, but the RSI shows overbought. Don't chase highs and beware of gold's highs and falls. It is recommended to go long again after a pullback.
🎯Practical strategy:
Go long when gold falls back to around 3385-75, with a target of around 3400. If it does not break, you can go short near 3400 and see a fall back near 3384.

Gold has a pressure level of 3397 and a support level of 3368Gold hit a new high, with the high point near 3397. From the gold hourly chart, 3397 is still an obvious pressure, and the support below is around 3368
We can go short around 3397, and then go long when it falls back to 3368

Long positions in the US market remain the main trend🗞News side:
1. The “demand shock” of the Trump administration’s tariffs on the global economy
2. The United States rejected Japan’s request for a comprehensive exemption from 10% reciprocal tariffs and country-specific tariffs in recent negotiations.
3. The conflict between Israel and the Houthis
📈Technical aspects:
The 4H golden moving average spreads upward, the MACD golden cross opens upward, and the 4H overall bullish trend is seen. Gold price encountered resistance at 3386 in the morning of the Asian session. This point can be used as a reference in suppressing the market outlook. If this resistance is effectively broken through, bulls are expected to continue to work towards the 3400 first-line mark above. The daily chart is positive, and the K-line combination is relatively strong. The US market is expected to break through 3386 and reach the space above 3400; the SMA10 moving average of 3370 continues to be bullish as the primary support, with strong resistance to 3400. Even if the price of gold in the US market rises and falls, the middle track of the Bollinger Bands still has good support. On the whole, we mainly focus on long positions in short-term trading. We can consider the 3370-3380 layout to go long, with the target looking towards 3400-3410 above.
If you agree with this view, or have a better idea, please leave a message in the comment area. I look forward to hearing different voices.
TVC:GOLD FOREXCOM:XAUUSD FXOPEN:XAUUSD FX:XAUUSD OANDA:XAUUSD

3419 , gold price can reach today⭐️GOLDEN INFORMATION:
Gold price (XAU/USD) pulls back slightly from its intraday peak near a two-week high reached during Tuesday’s Asian session, but remains firm around the $3,360 mark, extending its winning streak for a second day. Improved US economic data has helped temper recession fears, offering modest support to the US Dollar. Meanwhile, signs of a potential thaw in US-China trade tensions have curbed safe-haven demand for gold, prompting some investors to adopt a wait-and-see approach ahead of the highly anticipated two-day FOMC policy meeting.
⭐️Personal comments NOVA:
Bulls regain the upper hand, uptrend nears 3400 ahead of market interest rate cut expectations
⭐️SET UP GOLD PRICE:
🔥SELL GOLD zone : 3418- 3420 SL 3425
TP1: $3410
TP2: $3400
TP3: $3385
🔥BUY GOLD zone: $3323 - $3321 SL $3316
TP1: $3330
TP2: $3340
TP3: $3358
⭐️Technical analysis:
Based on technical indicators EMA 34, EMA89 and support resistance areas to set up a reasonable BUY order.
⭐️NOTE:
Note: Nova wishes traders to manage their capital well
- take the number of lots that match your capital
- Takeprofit equal to 4-6% of capital account
- Stoplose equal to 2-3% of capital account

GOLD Price Analysis: Key Insights for Next Week Trading DecisionGold ended last week under pressure as investors booked profits following improved risk appetite, driven by easing trade tensions and a strong U.S. labor market report.
📰 NFP came in at +177K in April, with the unemployment rate steady at 4.2%, matching forecasts—possibly keeping the Fed cautious on policy easing.
Technically, Gold remains bullish but is now testing the $3,200 support zone, and sellers are gaining momentum.
As we head into next week, gold price action is at a critical decision point, and whether buyers or sellers will take control is unclear.
In this video, I break down the key technical zones, share my trading plan, and discuss potential opportunities to help navigate the uncertainty ahead.
Disclaimer:
This is my take based on experience and what I see on the charts. It’s not financial advice—always do your research and consult a licensed advisor before trading.
#GoldAnalysis #XAUUSD #GoldPrice #ForexTrading #TechnicalAnalysis #FundamentalAnalysis #GoldOutlook #FedRateDecision #NFP #GoldBreakdown #GoldBulls #GoldBears #USJobsReport #ForexMentor

The Precision Sniper🧱 Market Structure
Recent Bullish BOS (Break of Structure) confirms buyer control.
Price is attempting a range breakout above key consolidation zone.
Next target: 3,488–3,500 (Swing High / Liquidity zone).
📌 Key Zones
Support: 3,320 – 3,340 (top of the box = retest area)
Resistance/Target: 3,488 – 3,500
Demand Zone (4H GZ): 3,120 (marked as deep institutional re-entry point)
📊 Indicators Aligned
EMAs are bullishly stacked (momentum up).
Volume increasing on bullish candles (breakout fuel).
Stoch RSI overbought (watch for short-term cooldown).
⚔️ Strategy at This Moment
Primary Bias: Bullish
Action:
Wait for a 4H candle close above the box
Enter on retest of the box top or small demand wick with confluence (e.g., bullish engulfing)
Protect trade with tight SL (below box or bullish candle low)
🎯 Targets:
TP1: 3,450
TP2: 3,488–3,500 (swing high)
❌ SL: 3,320 or tighter based on entry candle
🎯 Traits & Strengths
✅ Identifies structure early (BOS, CHoCH)
✅ Uses volume and EMAs to confirm breakout momentum
✅ Recognizes institutional footprints (e.g., GZ zones, wicks, liquidity grabs)
✅ Always waits for confirmation before entry — no emotional entries
✅ Backtested strategy and trusts the process
🔐 Trading Creed
“ Price is noise. Structure is signal. I only enter where the weak exit. ”

XAUUSD Price Action: Bullish Break + Liquidity Sweep Trade Idea🪙✨ Gold (XAUUSD) Technical Outlook ✨📈
I’m currently analyzing XAUUSD on both the daily and 4H timeframes, and here’s what I’m seeing:
🚀 Price has broken bullish structure and is now looking overextended, pushing into a buy-side liquidity zone—clearly visible to the left of current price action. 💰📊
It’s clearing buy stops, which could trigger a retracement soon. 🧲🔁
🎯 I’m watching closely for a pullback into the 50%–61.8% Fibonacci retracement zone on the current price swing—that’s my key point of interest for a potential long setup, provided we see a healthy pullback followed by another bullish break of structure. 🔍🔐
🧠 Not financial advice—just my personal analysis. Always manage risk. ⚠️📉

Buy gold, it may continue to rise to 3400-3420!Fundamentals:
Focus on Trump and the Fed’s dynamics;
Technical aspects:
Gold rose to the 3380 area as expected, and even exceeded expectations to 3387. Since gold rebounded near 3222, the willingness to retreat during the rebound was not strong. The lows were constantly raised, and the highs gradually broke upward, which was a very typical shock rise pattern. As the center of gravity of gold shifted upward, the short-term resistance moved up to the 3350-3340 area. Once gold hits this position and rebounds, it may continue to rise to the 3400-3420 area.
Trading strategy:
Consider the opportunity to go long on gold after gold retreats to the 3350-3340 area, TP: 3380

XAUUSD trading opportunities.6/5/2025The increase in uncertainty also caused the XAUUSD trend to continue to strengthen. The target position of 3330-3350 set yesterday is the short-term pressure position. In the Asian market, XAUUSD/GOLD hit the recent high again. After reaching 3387, it fell back. The current price is 3350. According to the momentum chart, the market is in a stage of bullish growth. Risk aversion has increased, which has led to more buying than selling.
In terms of trading, traders with large amounts of funds can buy at the current price, and those with small amounts of funds can wait until the market retreats below 3330 before choosing to join again.
The Swing Trading Center continues to update new real-time trading opportunities. If you don't know how to trade, or don't want to miss the next real-time trading opportunity, remember to follow me.

XAUUSD 3265: Bull-Bear Lifeline! Next Week's Trend PredictionFrom a daily chart perspective, overnight, the price of gold rebounded after hitting the bottom and closed with a bullish candlestick 🌞. However, on the 1-hour chart, the moving averages of gold have formed a bearish crossover pattern and are arranged in a downward trend for bears 📉. Moreover, this pattern will eventually continue to diverge downward. Currently, the price of gold has been suppressed and pulled back near the level of 3265 ⚠️. It can be seen from this that the area around 3265 will still be a crucial turning point determining the bull-bear trend of the gold price next week ⚡. Join 👉
In the latter part of the night, although the price of gold rebounded to some extent, compared with the previous decline range, the rebound strength is indeed limited 📉↗️. Looking ahead to next week, if the gold price fails to break through the resistance near 3265, then the market will most likely only maintain a volatile pattern at best, and it is less likely for the bulls in the gold market to achieve a direct reversal in the short term 📊. Investors should focus on the resistance at 3265 above and the strong support at the key level of 3195 below 🔍.
Join 👉
Accurate signals are updated every day 📈 If you encounter any problems during trading, these signals can serve as your reliable guide 🧭 Feel free to refer to them! I sincerely hope they'll be of great help to you 🌟 👇

Gold returns to the bull market as expected, follow-up layout🗞News side:
1. The “demand shock” of the Trump administration’s tariffs on the global economy
2. The United States rejected Japan’s request for a comprehensive exemption from 10% reciprocal tariffs and country-specific tariffs in recent negotiations.
3. The conflict between Israel and the Houthis
📈Technical aspects:
From a technical point of view, the 4H gold bulls are once again making an impact. At the top, we focus on the short-term suppression of the 3380-3390 line, focusing on the suppression of the 3400 line. Below, we focus on the short-term support of the 3350 line, and the important first-line support of 3335-3340. In terms of operation, we mainly go long by stepping back on 3350-3360, and the target is temporarily looking at 3380-3390. In the middle position, we should watch more and move less, pursue orders cautiously, and wait patiently for key points to enter the market.
If you agree with this point of view, or you have a better idea, please leave a message in the comment area. I look forward to hearing different voices.
OANDA:XAUUSD FX:XAUUSD FXOPEN:XAUUSD FOREXCOM:XAUUSD TVC:GOLD
GOLD UPDATEMarket structure suggests is preparing for its next move.
The AND level will likely play a critical role in the upcoming direction.
** If structure breaks and confirms the shift, a new bias might form after the retest. **

Swing Trading/XAUUSDband trading strategy points out. XAUUSD can be bought on the left side, TP3330-3350.
Aggressive traders can buy at the current price. Conservative traders can wait until the price retreats to around 3300 or below before buying.
The Swing Trading Strategy Center continues to announce trading opportunities. Stay tuned.

Gold is once again affected by tariffs and rises sharplyNews: Gold rose sharply, mainly because Trump announced a 100% tariff on all films produced abroad and entering the United States, which once again triggered global trade tensions. At the same time, the conflict between Russia and Ukraine is still ongoing, and the situation in the Middle East has become tense again. For example, Israel’s missile attacks retaliated against the Houthi armed forces in Yemen and Iran. These have stimulated gold’s safe-haven properties and pushed up gold prices.
Technical aspect: Gold bulls are strong, so there is a certain risk in shorting gold. The point of concern below is the low of 3323. If gold continues to maintain its strength, it is impossible to fall below the 3323 line again.
Trading ideas: Buy gold near 3338, stop loss 3330, target 3360

It’s the right time to short📌Fundamentals:
This week, the Federal Reserve will hold a rate decision, which is expected to dominate the market this week. In addition, we need to continue to pay attention to news related to the international trade situation.
📊Technical aspects:
The 1-hour moving average begins to turn, so the unilateral decline of gold has temporarily come to an end. However, the rise of gold has reached the key resistance area in the early stage, which is the starting point of the early stage of 3330. It is obviously not appropriate to chase more at this position, so the short-term may begin to adjust, and gold will go short at 3325 first. The market is changing rapidly. If gold breaks upward without stepping back, there will be no opportunity to go long. Then there is no need to chase more gold. Go short first and look at the decline and adjustment. On the whole, the short-term operation strategy of gold today is to go short on rebounds and go long on pullbacks. The short-term focus on the upper resistance of 3328-3330, and the support on the lower side is 3280-3293.
🎯Practical strategy:
Short gold when it rebounds to around 3325-3328, target around 3300-3280.
Buy gold when it falls back to 3280-3295, target around 3325-30.

Although the bulls are strong, don't chase them at high levels📌Fundamentals:
The market is still focused on Trump's tariffs, followed by geopolitical situations, such as the India-Pakistan conflict, the Israeli-Palestinian ceasefire, and the Russia-Ukraine negotiations.
📊Technical aspects:
From the 4-hour analysis, the upper pressure is around 3336-3345, and the lower support is around 3280-3293. Continue to rely on this range to maintain the main tone of high-altitude low-multiple cycles. In the middle position, watch more and move less, be cautious in chasing orders, and wait patiently for key points to enter the market.
🎯Practical strategy:
1. Short gold rebounds at 3336-45, with a target of 3280-3295.
2. Go long gold at 3280-3295, with a target of 3325-30.

XAU/USD "The Gold" Metals Market Heist Plan (Swing/Day Trade)🌟Hi! Hola! Ola! Bonjour! Hallo! Marhaba!🌟
Dear Money Makers & Robbers, 🤑 💰💸✈️
Based on 🔥Thief Trading style technical and fundamental analysis🔥, here is our master plan to heist the XAU/USD "The Gold" Metals Market. Please adhere to the strategy I've outlined in the chart, which emphasizes long entry. Our aim is to escape near the high-risk ATR Zone. Risky level, overbought market, consolidation, trend reversal, trap at the level where traders and bearish robbers are stronger. 🏆💸"Take profit and treat yourself, traders. You deserve it!💪🏆🎉
Entry 📈 : "The heist is on! Wait for the NEUTRAL LEVEL breakout (3400) then make your move - Bullish profits await!"
however I advise to Place Buy stop orders above the Moving average (or) Place buy limit orders within a 15 or 30 minute timeframe most recent or swing, low or high level for Pullback entries.
📌I strongly advise you to set an "alert (Alarm)" on your chart so you can see when the breakout entry occurs.
Stop Loss 🛑: "🔊 Yo, listen up! 🗣️ If you're lookin' to get in on a buy stop order, don't even think about settin' that stop loss till after the breakout 🚀. You feel me? Now, if you're smart, you'll place that stop loss where I told you to 📍, but if you're a rebel, you can put it wherever you like 🤪 - just don't say I didn't warn you ⚠️. You're playin' with fire 🔥, and it's your risk, not mine 👊."
📍 Thief SL placed at the recent/swing low level Using the 4H timeframe (3200) Day trade basis.
📍 SL is based on your risk of the trade, lot size and how many multiple orders you have to take.
🏴☠️Target 🎯: 3680 (or) Escape Before the Target
🧲Scalpers, take note 👀 : only scalp on the Long side. If you have a lot of money, you can go straight away; if not, you can join swing traders and carry out the robbery plan. Use trailing SL to safeguard your money 💰.
💰💵💴💸XAU/USD "The Gold" Metals Market Heist Plan (Day / Swing Trade) is currently experiencing a Neutral trend (there is a chance to move bullishness🐂).., driven by several key factors.👆👆👆
📰🗞️Get & Read the Fundamental, Macro economics, COT Report, Geopolitical and News Analysis, Sentimental Outlook, Intermarket Analysis, Index-Specific Analysis, Positioning and future trend targets with Overall Score...... go ahead to check👉👉👉🔗🔗🌎🌏🗺
⚠️Trading Alert : News Releases and Position Management 📰 🗞️ 🚫🚏
As a reminder, news releases can have a significant impact on market prices and volatility. To minimize potential losses and protect your running positions,
we recommend the following:
Avoid taking new trades during news releases
Use trailing stop-loss orders to protect your running positions and lock in profits
💖Supporting our robbery plan 💥Hit the Boost Button💥 will enable us to effortlessly make and steal money 💰💵. Boost the strength of our robbery team. Every day in this market make money with ease by using the Thief Trading Style.🏆💪🤝❤️🎉🚀
I'll see you soon with another heist plan, so stay tuned 🤑🐱👤🤗🤩

Israel-Houthi conflict could put gold back on the bull run🗞News side:
1. The Israeli president said that they are on the eve of a "large-scale attack on the Gaza Strip"
2. The Houthi armed forces stated that all Israeli airports are their targets
3. The situation of the Russian-Ukrainian war and the follow-up events of the India-Pakistan conflict
📈Technical aspects:
From a technical point of view, the current 1H moving average of gold is spreading upward, resulting in a small retracement. The short orders we hold are also closed in time at 3310 to lock in profits. After gold broke through the previous range, the upward channel opened. The 4H MACD diverged from the bottom, the golden cross and the green column enlarged, opening upward, and the overall 4H trend was bullish. Moreover, the support effect of the middle rail of the Bollinger Bands is obvious, and the gold price is accumulating strength below the upper rail of the Bollinger Bands, with strong upward momentum. Pay attention to 3310. After the support stabilizes, you can consider participating in long positions near 3310-3320, focusing on the 3290 line below; focus on 3375 above, and then consider participating in short sales near 3355-3365 after the pressure is under.
If you agree with this point of view, or you have a better idea, please leave a message in the comment area. I look forward to hearing different voices.
TVC:GOLD FOREXCOM:XAUUSD FXOPEN:XAUUSD FX:XAUUSD OANDA:XAUUSD
