GOLD ON BUY FROM 3316#XAUUSD price we expect drop till 3316 for bullish range to form.
Buy limit 3316-3315.5, target 3330, stop loss 3310.
Below 3306 holds bearish continuation, target 3290-3280.
Bullish range can form above 3330 on 2 times breakout, target 3345
Xauusdlong

XAUUSD Trading Strategy – July 8, 2025Gold (XAUUSD) is trading around 3,331 USD as global markets react to a series of critical economic data releases. The recent rally has brought prices back to a key resistance zone, but selling pressure remains strong due to the following factors:
- The Dollar Index (DXY) TVC:DXY holds steady near 97, its highest level in five weeks. A strong USD continues to weigh on gold, a non-yielding asset.
- U.S. 10-year Treasury yields remain stable at 4.35%, reinforcing expectations that the Federal Reserve will maintain higher interest rates for longer to tame inflation.
- Robust U.S. labor market data and June’s Core PCE figures staying above the Fed’s 2% target further reduce the likelihood of a rate cut in Q3 or Q4.
- Geopolitical tensions remain muted, with no significant escalations in the Russia–Ukraine conflict or Middle East unrest, weakening gold’s safe-haven appeal.
➡ Collectively, these factors suggest that gold’s recent rebound could be a technical pullback within a broader downtrend, unless a new catalyst drives a breakout.
1. XAUUSD Technical Analysis – Daily Chart (D1)
Price is currently testing the 3,331 – 3,340 USD resistance zone, which includes:
A previous supply zone that has rejected multiple rallies.
- Fibonacci retracement 0.5–0.618 from the recent high at 3,405 USD.
- A key Change of Character (CHoCH) area, where trend reversals have previously occurred.
- EMA20 and EMA50 remain aligned downward, confirming the dominant bearish trend.
- RSI hovers around 50 with signs of mild bearish divergence, reflecting weakening bullish momentum.
➡ The current price action fits a classic “sell on rally” setup, with repeated rejections at technical resistance zones.
2. Key Price Levels to Watch
Technical Significance
- 3,340 – 3,331 Confluence resistance (Fibo 0.5–0.618 + supply + CHoCH)
- 3,310 – 3,300 Nearest support – role reversal zone
- 3,275 – 3,260 Short-term target support – June’s low
- 3,223 – 3,205 Strong medium-term support – April’s low + extended Fibo
3. Suggested XAUUSD OANDA:XAUUSD Trading Strategy
Primary Strategy: SELL if price rejects 3,340 – 3,345
Entry: 3,340 – 3,345
Stop Loss: 3,356
Take Profit 1: 3,335
Take Profit 2: 3,330
Take Profit 3: 3,325
Ps : Gold is trading at a critical price zone. If XAUUSD fails to break above the 3,340 USD resistance, there’s a high probability of a pullback toward the lower support levels. Selling at resistance and targeting support remains the preferred approach in the current macro environment, which continues to favor bearish momentum.
This strategy will be updated regularly – save it and follow to avoid missing upcoming opportunities.
Analysis by @Henrybillion

XAUUSD Short-Term Correction From the Top ZoneOn the 15-minute chart, XAUUSD showed a strong upward momentum starting below the 3,300 USD mark, reaching a peak near 3,346 USD. This rally was supported by a clear bullish structure and an ascending trendline.
However, once the price hit resistance at the top, selling pressure intensified, pushing the price into a downward correction. A clear pullback zone has formed between 3,346 USD and the support area around 3,318 USD — currently acting as a buy-side liquidity pocket.
Crucially, the price broke below the previous uptrend line and is now being capped by a descending resistance trendline, indicating a short-term bearish bias. Multiple failed attempts to break above the 3,332 – 3,335 USD area confirm that sellers still have the upper hand.
Additionally, the price action within this correction zone hints at a potential distribution pattern. Without strong buying interest to reclaim the 3,335 USD level, further downside remains possible.
Suggested Trading Strategy:
In the short term, traders may consider a “Sell on Rally” approach if price continues to fail at the 3,332 – 3,335 USD resistance zone.
Conversely, if a clear breakout occurs above the descending trendline and especially above the 3,336 – 3,338 USD area, the bullish trend may resume.
Conclusion:
XAUUSD is undergoing a technical pullback after a sharp rise. The market is currently in a tug-of-war between profit-taking pressure and recovery attempts. How price reacts at the current resistance will determine the next key move.

Gold falls back to 18-24 and goes longFrom the 4-hour analysis, pay attention to the short-term support of 3318-3324 below, pay attention to the short-term resistance of 3345-50 above, and focus on the suppression of 3365-70. The overall high-altitude low-multiple cycle participation theme remains unchanged. In the middle position, watch more and do less, and follow orders cautiously, and keep the main theme of participation in the trend. Be patient and wait for key points to participate. I will prompt the specific operation strategy in the link, please pay attention in time.
Gold operation strategy:
1. Go long at 3318-3324, stop loss at 3312, target at 3345-50, and continue to hold if it breaks;
2. Go short at 3345-50 when gold rebounds, stop loss at 3357, target at 3318-24, and continue to hold if it breaks;

Can the gold bulls reverse?From the technical perspective of gold, the lowest price fell to 3295 on Monday and stopped falling. There is a lot of room for the rise, and the highest rose to around 3345. The overall trend was a "V" reversal of falling first and then rising. Therefore, it can be determined that the adjustment of gold has been completed, and the bullish force has emerged. The market outlook will continue to see room for growth. The upper side will maintain around 3365 to 3400, and the effective target of the rise this week is 3400. In the 4-hour chart, the technical pattern is also three consecutive positive days at a low level, and the Bollinger band is closing. Standing firmly above the middle track of the Bollinger band is absolutely strong. If it continues to rise, it will be around 3365. 3365 is the high point last week. If this point breaks and the Bollinger band opens, there is a possibility of a big rise to 3400 this week. Today's key point is the 3345 line above. Before the intraday breakout and stabilization at 3345, the rebound is an opportunity to go short. If it stabilizes above 3345, it means the formation of the bottom pattern, and the bulls will start to pull up. At that time, the bears can no longer hold on. The small cycle support is around 3320. Don't chase the long position in the Asia-Europe session, wait for it to fall back to the key support point and then go long.
Gold operation strategy: It is recommended to go long at 3320-3322, stop loss at 3314, and target 3330-3340; it is recommended to go short at 3342-3340 on the rebound, stop loss at 3350, and target 3330-3320;

XAUUSDHello traders,
Today we're taking advantage of a great buying opportunity on the XAUUSD pair. This setup is ideal for both medium- and long-term positions. I anticipate that the price will rise toward the 3392.82 USD level in the coming weeks.
That’s why I’ve positioned this trade as a medium-term opportunity.

XAUUSD:High-range consolidation, caution on rally sustainabilityFollowing Trump's reimposition of tariffs, gold staged another rally on the back of its safe-haven allure. Nevertheless, it retreated after encountering resistance near the 3345 mark, making it premature to conclude that gold has entered a robust one-sided bullish trend. After all, for a rally sparked by news-driven factors, the sustainability of the upward momentum demands close scrutiny. Should this momentum falter, gold is likely to re-enter a consolidation phase.
Given that gold is currently lingering at a relatively high level within its rebound and consolidation range, a short-position strategy could be prioritized for the time being. Only if gold sustains strong momentum throughout the day can bulls potentially amass genuine upward impetus.
XAUUSD
sell@3340-3350
tp:3330-3320
I am committed to sharing trading signals every day. Among them, real-time signals will be flexibly pushed according to market dynamics. All the signals sent out last week accurately matched the market trends, helping numerous traders achieve substantial profits. Regardless of your previous investment performance, I believe that with the support of my professional strategies and timely signals, I will surely be able to assist you in breaking through investment bottlenecks and achieving new breakthroughs in the trading field.

XAUUSD D1 – Gold Under Long-Term Bearish PressureGold is currently trading around 3,328 USD after failing to break above the descending trendline that started from the mid-June peak. On the chart, the price forms a series of lower highs and lower lows — a classic signal of a medium-term downtrend.
The descending trendline (green) acts as dynamic resistance. Each time price approaches it, strong selling pressure pushes it back down, showing sellers are in control.
In the short term, the 3,300 – 3,310 USD area serves as immediate support. If this zone is broken, price could drop further toward the major support zone around 3,260 – 3,270 USD.
Conversely, a confirmed reversal would only be valid if price breaks above the descending trendline and closes sustainably above 3,371 USD — a historically significant distribution zone.
The most recent daily candle is a small-bodied red candle with a long lower wick, indicating weak buying pressure and market indecision — typical in a consolidation phase before further downside.
Strategy Summary:
Favor short positions on pullbacks to the descending trendline.
Avoid bottom-fishing until a confirmed breakout above major resistance.
Traders should monitor the 3,300 USD zone closely in upcoming sessions.
Note: The analysis above is for informational purposes only and does not constitute investment advice. Stay tuned for further updates and adjust your trading plan accordingly.
What’s your take on the next move for gold? Share your thoughts in the comments!

GOLD TODAYHello friends🙌
🔊Due to the weakness of buyers and the strength of sellers, the price continues to fall...
We have identified two supports for you that will not be seen if the price continues to fall, and if the selling pressure increases, we will update you.
🔥Join us for more signals🔥
*Trade safely with us*

Gold: update hello friends✋️
According to the recent growth of gold, you can see that it is constantly resisting and forming a falling pattern.
For this reason, it can be a warning that the fall can continue and the price will fall to the specified limits.
🔥Follow us for more signals🔥
*Trade safely with us*

XAU/USD – 45-Minute Chart Breakdown **Date:** July 7, 2025 # 📊 XAU/USD – 45-Minute Chart Breakdown
**Date:** July 7, 2025
**Current Price:** $3,326.97
**Bias:** 📈 Bullish Breakout
---
## 🔹 Key Market Structure:
- **Trendline Breakout**: ✅
Price broke cleanly out of the descending trendline that had held since the $3,362 high.
- **LL → HL Shift**:
The structure is transitioning from Lower Lows to potential Higher Lows (HL) – a strong sign of **reversal**.
- **BOS Zone** (Break of Structure):
BOS has been confirmed; further upside is now **probable**.
---
## 🔸 Trade Zone:
| Type | Level | Description |
|------------|------------|--------------------------|
| **Entry** | ~$3,326 | Breakout confirmation 🔓 |
| **SL** | ~$3,319 | Below recent HL 🛡️ |
| **TP1** | $3,362 | Top of previous range 🎯 |
| **TP2** | $3,385+ | Momentum extension 📈 |
---
## 📌 Indicators & Labels:
- **Structure:** `Bullish` 🟢
- **Efficiency:** `Efficient` ✅
- **MSU:** Bearish (short-term countertrend, being invalidated)
- **VTA:** Active ⚡️
---
## 🧠 Strategy Note:
This breakout is occurring **after a full liquidity sweep** and a **strong bullish reaction** off the $3,290s. Volume is supporting the move and **confluence** builds toward continuation.
> 💬 *"The best trades come when structure, liquidity, and timing converge."* – Let's ride this wave with confidence.
---
### 👑 For Persian Princes of the Market 🇮🇷
We don’t guess. We **track, adapt, and lead**.
---
## 🟢 Potential Breakout from the Descending Channel
As observed in the **45-minute timeframe**, Gold (XAU/USD) has been respecting a classic **descending channel** formed by a sequence of Lower Highs (LH) and Lower Lows (LL), leading to an overall bearish structure.
However, in the latest candles, price has **broken above the upper boundary of the channel**, signaling a potential shift in market structure.
---
### 🔍 Technical Highlights:
- ✅ **Breakout above the channel** = First sign of bullish reversal
- ✅ **Formation of Higher Low (HL)** after a strong rally = Added confirmation
- ✅ **Efficient bullish move** with momentum pushing toward previous Highs
---
### 🎯 Forecast Scenario:
If price holds above the breakout zone (around **$3,327**), we can expect a bullish continuation toward:
- 🥇 **Target 1:** $3,362
- 🥈 **Target 2:** $3,385+
A **successful retest** of the broken channel would serve as a powerful confirmation for this setup.
---
> ⛳️ *This move reflects not just a breakout — but a disciplined journey through structure, liquidity, and price behavior. Pure technical elegance.*
> — *Mohsen Mozafari Nejad*
---
📈 **Structure:** Bullish
⚡️ **Momentum:** Efficient
🕰 **Timeframe:** 45 Min
💰 **Current Price:** ~$3,327

XAUUSD:Go long
Gold prices fell back in Asian trading on Monday, as they digested Friday's negative data. The short term may be partial shock, but the medium and long term news surface uncertainty or to provide support for gold prices, so trading ideas, retracement to do long can.
Trading Strategy:
Both 3300 and 3308 can be used to enter the long position, short-term traders can look at 3325-30, followed by 50 around.
For intermediate traders, the target sees 3365-70 unchanged, and the retracting of 3300/3310/3330 is an opportunity to go long.
More detailed strategies and trading will be notified here ↗↗↗
Keep updated, come to "get" ↗↗↗
7/7: Key Zone – 3320 to 3350Good morning, everyone!
Due to the U.S. market closure on Friday, price movement remained relatively subdued, and the week concluded with modest gains. As of this morning, gold opened higher but has since pulled back, and the price remains in a consolidation phase.
Key technical levels for today:
Resistance: around 3350
Support: near 3321
Short-term traders may focus on range-bound strategies between these levels. If a breakout occurs, follow the trend accordingly:
If price breaks above and stabilizes above 3338, the market may shift its focus toward the 3400 psychological level;
If price drops below and holds under 3332, there’s potential for a retest of the 3260 support zone.
In terms of broader trend analysis, the MA20 and MA60 on the daily chart should be watched closely, as they currently serve as key dynamic resistance and support levels.
Lastly, stay alert to any developments related to trade tariffs, as such news may significantly impact market sentiment and gold price direction.

Where will the price of gold go under such strong pressure?From the 4-hour analysis, the support line of 3295-3301 is concerned below, the short-term resistance above is concerned about 3316, and the suppression line of 3345-50 is focused on. The overall main tone of high-altitude low-multiple cycle participation remains unchanged. In the middle position, watch more and do less, and follow orders cautiously, and maintain the main tone of participation in the trend. Wait patiently for key points to participate.

Gold falls below 3300, will it rebound or continue to fall?Gold opened lower in the morning today and then rebounded and fell again. This kind of jump market fluctuates quickly but is mostly short-term. I usually remind you to avoid chasing orders to prevent being washed. Gold rebounded weakly and failed to touch 3320 and began to fall continuously. This weak signal alerted me - it failed to rebound strongly after the gap and instead remained at a low level, suggesting that the downward momentum was very strong and fully released, and there was a risk of further weakening. In the afternoon, the gold price was still hovering around 3312-3307, confirming its weak pattern. Combined with the repeated pressure on the key support 3300, I judged that the trend has clearly turned to short.
Gold recommendation: short in the 3312-3315 range, stop loss 3320, target 3280

Gold shock pattern breaksGold prices rose rapidly at the opening of the morning, reaching a high of 3342 before falling back. This early morning sharp pull-up market needs special attention, because from the perspective of short-term trading, this is the trend pattern that needs the most vigilance. Looking back at the trend of last Thursday, there was also a situation where the early morning surge could not continue. Historical data shows that this kind of morning pull-up often lacks sustained momentum and has limited room for subsequent increases. Combined with the recent trend, although the price rebounded on Monday and Tuesday, it basically maintained a volatile pattern in the following trading days, but the fluctuation range changed. After repeated struggles in the 3345-3322 range on Friday, the gold price rose again in this trading day and fell below the key support level of 3322. This important change means: 1. The original 3322-3345 oscillation range has been broken; 2. After the range moves down, 3322 changes from a support level to a resistance level; 3. The short-term trend weakens, and it is recommended to adopt a high-sell strategy. It is recommended to short at highs near 3322, and focus on the 3295-3293 support area below.

Trade Breakdown: XAUUSD 15-Min | Liquidity Grab + Reversal PlayOANDA:XAUUSD
Psychological Setup
This trade is rooted in the psychology of smart money and retail behavior. After a sharp drop in price, most retail traders expect continuation (trend-following). However, institutions often manipulate liquidity zones — hunting for stop-losses before a true reversal. This trade capitalizes on that behavior.
🔍 Technical Explanation:
🔻 1. Market Structure:
Price was previously in a downtrend, forming lower highs and lower lows.
A falling wedge pattern (red lines) formed after a strong bearish move, signaling potential bullish reversal.
Price broke the wedge to the upside — a classic reversal signal.
🔁 2. Liquidity Concept:
Below the wedge: The market grabbed liquidity by taking out stop losses of buyers who entered too early.
Above the wedge (TP Areas):
TP 1 Area (red box): This is the first logical resistance where previous supply sits — many sellers will enter here, providing buy-side liquidity.
Next Target Liquidity (grey box above): This is a major imbalance zone and likely where stop-losses of early short sellers are stacked.
Price is expected to grab liquidity from that area (marked by the red arrow).
✅ Entry & Trade Logic:
Entry Zone: After liquidity was swept at the bottom of the wedge, a bullish engulfing candle formed near demand — signaling institutional interest.
Risk-Reward Setup:
Targeting 0.80% move (approx. 26.48 points).
Trade is based on reversal from demand zone + wedge breakout + liquidity grab confirmation.
🎯 Target Projections:
TP1 Area: Conservative target, just above recent structure.
Final Target: High-probability liquidity zone where market is drawn to clean up resting orders (grey zone).
🧠 Why This Trade Matters (Trading Psychology Insight):
Most retail traders get trapped in emotional entries — entering shorts after a drop or longs too early in a wedge.
Smart money waits for liquidity sweeps before moving price in the desired direction.
This setup shows the importance of patience, structure, and understanding market psychology rather than reacting emotionally to price action.
📌 Key Takeaways:
📉 Trap: Falling wedge builds false bearish confidence.
🧠 Psychology: Stop hunts create fuel for reversal.
📈 Reaction: Smart money absorbs liquidity, moves price toward next inefficiency.
Hashtags:
#XAUUSD #SmartMoney #LiquidityHunt #TradingPsychology #GoldTrade #PriceAction #WedgeBreakout #FXOpen #TechnicalAnalysis #SupplyDemand

On Swing Traders’ Radar: Gold Pattern Alert on the Daily Chart!Dear Traders,
In my daily gold analysis, I’m observing a Head and Shoulders pattern nearing completion. The neckline is currently positioned around the 3,247.00 level.
If this neckline breaks to the downside, gold could potentially drop toward the 3,150.00 area.
Since this is a one-day analysis—aligned with a swing trading style—it may take some time for the setup to fully play out.
I meticulously prepare these analyses for you, and I sincerely appreciate your support through likes. Every like from you is my biggest motivation to continue sharing my analyses.
I’m truly grateful for each of you—love to all my followers💙💙💙

WEEK PLAN|Will This Gold Rally Collapse Into a Liquidity Trap ? Gold remains trapped between high-liquidity resistance and a strong order block below. While short-term bullish structure is forming, the weekly outlook remains complex due to upcoming high-impact events from the Fed and US labour data. Expect volatility and traps in both directions.
🧠 Fundamental Context
FOMC Meeting Minutes (Wed 9 July): Market will look for rate cut clues.
Unemployment Claims (Thu 10 July): A stronger labour market = stronger USD = bearish for gold.
FOMC Member Waller Speaks (Thu 10 July): Any hawkish tone could cap gold upside.
📊 Key Zones
Zone Role Notes
3,387 – 3,439 Sell Zone High liquidity, weak highs, ideal reversal trap
3,240 – 3,260 Buy Zone Strong OB, liquidity sweep, aligned with trendline support
3,365 Weekly High May reject or break based on macro catalyst
🛠️ Trade Setups (Entry Zones as Requested)
✅ 1. BUY GOLD
Entry: 3,346 – 3,344
Stop Loss: 3,340
TP1: 3,356
TP2: 3,366
TP3: 3,376+ (Open Target)
Rationale: Scalping long off micro demand, aiming for a short-term spike above liquidity.
✅ 2. BUY GOLD SCALPING
Entry: 3,291 – 3,289
Stop Loss: 3,285
TP1: 3,299
TP2: 3,310
TP3: 3,320+ (Open Target)
Rationale: Buy on breakout momentum before hitting higher sell-side zones.
✅ 3. SELL GOLD
Entry: 3,389 – 3,391
Stop Loss: 3,396
TP1: 3,381
TP2: 3,371
TP3: 3,361 (Open Target)
Rationale: Fade the breakout — fakeout zone targeting liquidity void beneath.
✅ 4. SELL GOLD
Entry: 3,349 – 3,351
Stop Loss: 3,355
TP1: 3,339
TP2: 3,329
TP3: 3,319 (Open Target)
Rationale: Short off weak rally, playing potential rejection near intraday high.
📅 This Week’s Events
Date Event Likely Impact
9 July FOMC Minutes Fed tone → volatility spike
10 July Jobless Claims (233K) Strong number = gold downside
10 July FOMC Waller Speech Additional risk-on/risk-off flows
⚠️ Trading Strategy
Use H1–H4 confirmations (CHoCH, BOS, FVG) before entries.
Avoid entries 1h before and after red news.
Focus on 3,260–3,439 range as key decision area for the week.

Gold new ATH soon?🟡 GOLD LONG SETUP: Buying the Fear at Key Support 📈
ICMARKETS:XAUUSD
"Be fearful when others are greedy, and greedy when others are fearful" - Warren Buffett
The oscillator we developed is showing some compelling signals on gold right now, and the market sentiment couldn't be more perfect for a contrarian play. 💎
Technical Analysis:
Our custom oscillator is painting a clear picture at the bottom - we're seeing those beautiful green zones emerging after extended red periods
Price action has found solid support around the 3,300 level, creating a strong foundation for the next leg up
The fear in the market is palpable, which historically has been an excellent buying opportunity for precious metals
Volume profile suggests accumulation is happening at these levels
Why This Setup Works: 🎯
The beauty of this oscillator lies in its ability to identify when institutional money starts flowing back into gold during periods of maximum pessimism. When retail traders are panicking and selling, smart money is quietly accumulating.
Key levels to watch:
• Support: 3,300 (current zone)
• First target: 3,350
• Extended target: 3,400+
Risk Management: ⚠️
• Stop loss below 3,275
• Position sizing: Never risk more than 2% of account
• Trail stops as momentum builds
The oscillator's fear signals have been remarkably accurate in identifying these reversal points. When fear reaches extremes, that's typically when the best opportunities present themselves.
This is not financial advice - always do your own research and manage risk appropriately.
What are your thoughts on this setup? Are you seeing similar signals on your charts? 🤔
#Gold #XAUUSD #TechnicalAnalysis #BuyTheFear #Oscillator

XAU/USD: Today's Strategy AnalysisVerification of Support Level Effectiveness
- $3306: As the 0.5 retracement level of the 3247-3365 band Fibonacci, it rebounded slightly after being first touched today. It is necessary to monitor whether a bullish candlestick stabilization signal forms at this level. If broken, the next target is $3290.
- $3290: Overlapping with the lower Bollinger Band support of the 4-hour chart, if a pullback signal with shrinking trading volume appears here, it can be regarded as a short-term long opportunity.
Suppression Effect of Resistance Level
- $3320-$3325: The suppression zone of the 5-day moving average at the 1-hour level, which is also near the early session rebound high. If the price is resisted and closes bearish when rebounding to this range, it confirms a short entry opportunity.
-
Operation Tips
Strictly set stop-loss orders to avoid capital drawdown caused by false breakouts of support/resistance levels.
XAUUSD
buy@3285-3295
tp:3310-3320
sell@3315-3325
tp:3305-3295
I am committed to sharing trading signals every day. Among them, real-time signals will be flexibly pushed according to market dynamics. All the signals sent out last week accurately matched the market trends, helping numerous traders achieve substantial profits. Regardless of your previous investment performance, I believe that with the support of my professional strategies and timely signals, I will surely be able to assist you in breaking through investment bottlenecks and achieving new breakthroughs in the trading field.

GOLD swing longPlacing bids for potential 1-2 setup to the upside, grey box is ideal target for this setup to trigger however scaling in on spot won't hurt

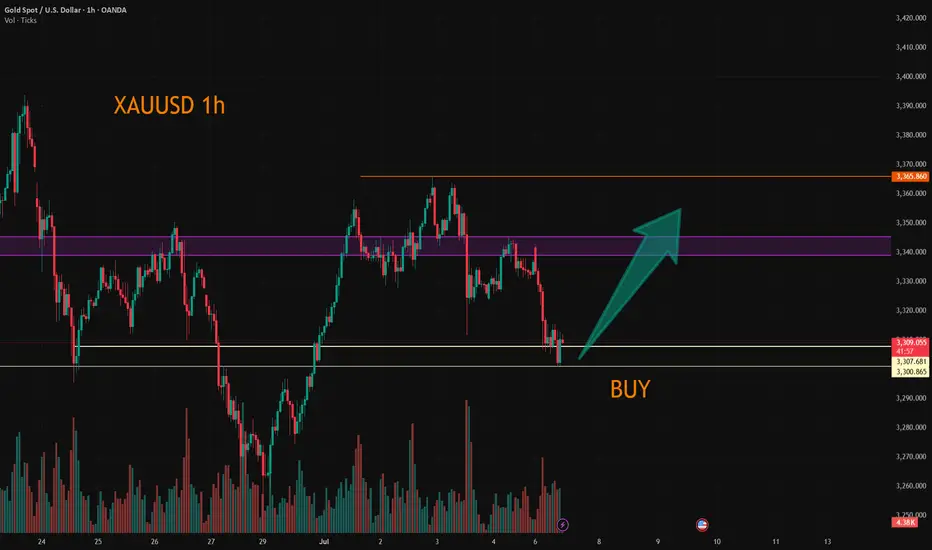
Monday Outlook on Gold (XAU/USD)My outlook for Monday is bearish at the start of the session, with price likely to drop toward the 3310–3300 area. This level aligns with a key discount zone inside the Gann box, and also overlaps with a 4H Fair Value Gap (FVG), making it a strong area of interest for potential long setups.
From that zone, I expect a bullish reaction, leading to a move back up to the trendline.
If the momentum continues, I anticipate a break of the trendline, followed by a retest, and then the beginning of a bullish trend.
I’ll be looking for confirmations around 3300 to position for the move higher.
Let’s see how Monday opens.
