Gold has the potential to rebound towards the 2338 "Gold has the potential to rebound towards the 2338 area, but first, a correction to the 3212–3293 range is needed to create a strong momentum for further upward movement."
Today's Scenario: XAUUSD Trading Strategy Around the Key Price Zones
🔻 Sell XAUUSD around 3338
Stop Loss: 3346
Take Profit 1: 3328
Take Profit 2: 3218
Take Profit 3: 3212
🔺 Buy XAUUSD around 3212
Stop Loss: 3200
Take Profit 1: 3218
Take Profit 2: 3225
Take Profit 3: 3230
Note: Always set a Stop Loss in every trade to manage risk and protect your capital.
Xauusdlong

Gold fluctuates and the trend is bearish!The rise and fall of gold is not based on technical aspects, but more on fundamentals and big data, as well as the impact of tariffs. Without these influences, we are bearish this week. If the decline of the big C wave continues, the target will be 3230. 3165 is the Fibonacci 61.8 position of the callback and also the previous high point, which is easy to form a rebound. Gold focuses on two major suppressions, one is the hourly suppression around 3300, and the other is 3315 and 3328, both of which are opportunities for air forces. In terms of the short-term operation of gold, it is recommended to short on rebounds and long on callbacks. The short-term focus on the upper side is 3298-3300 resistance, and the short-term focus on the lower side is 3265-3260 support.

Gold technical and fundamental aspects resonate!At present, gold maintains an upward trend of shocks. The short-term support below is the middle track of 3270-3290 and the 30-day moving average. If it pulls back to this range, you can arrange long orders accordingly. The key resistance above is the double top pressure of 3370 and the psychological barrier of 3400. The technical side shows that the right shoulder top pattern is formed near 3370. If it breaks through effectively, it may accelerate the upward exploration. Otherwise, it will face the risk of correction if it encounters resistance. In the near future, we need to be vigilant against the repeated short-term shock pattern of market sentiment. The operation is mainly high-altitude, supplemented by low-long, and avoid chasing up and selling down.

Gold trend picks directionGold fell by 230 USD in a row on the daily line. Currently, 3500 is under short-term pressure. Today, we will focus on the continuity of the decline. It directly rushed from 3288 to 3310 in 5 minutes after opening. Yesterday, it hit the lowest point of 3258 above the 0.5 division of 2956-3500. This position is temporarily supported and rebounded, but whether the adjustment is over is still uncertain. It depends on the intraday closing pattern. If today's closing can stand above the MA5 daily moving average resistance of 3358 again, then there will be signs of the end of the downward adjustment, and the next day must be accompanied by a positive line. Pull up; on the contrary, if it closes below the 5-day MA, then there is a high probability that the 10-day moving average position will continue to decline, and then the 50-division position 3228 is further down, which happens to be the starting point of the big positive on April 16. This is likely to be the end point of this round of adjustment, or there will not be much room to go down, because from the standard wave pattern, it cannot fall below the first wave high, which is 3167, which is also the current middle track; therefore, either 3228 will stabilize on dips, or somewhere in the 3228-3167 area will stabilize, and then finally return to the bullish trend and pull up
The short-term 4-hour middle track 3380 has been lost and has become a key counter-pressure point. As long as it does not stand above it again, it will maintain a downward correction. After breaking 3292 below, the 66-day moving average of 3260 will be the loser or loser; the 1-hour K-line is under pressure from ma10 and ma5 and continues to fall. After yesterday's consolidation and pull-up, the K-line has now re-run above ma10, and the macd has formed a golden cross below the zero axis. This wave of 200 US dollars of rapid decline has almost corrected most of it. If it continues downward for another wave, or with the help of bottom divergence, it will slowly brew a short-term bottom; today's gold rebound focuses on the resistance below 3367, below the extreme middle track of 3380, and it is still bearish if it cannot withstand the pressure. If the strong support of 3260 or 3245-28 is stable, we will start to consider bottom-fishing.

Gold 100% Profit SignalFrom the current 4-hour analysis, the short-term pressure on gold is 3343-50, and the important pressure on 3360-66. The operation is still mainly short-selling if the rebound does not break. Below, we first pay attention to the short-term support of 3310-15, and the important support of 3260-68.
Gold rebounds to 3343-50 line short, rebound to 3360-66 line to cover short, stop loss 3372, target 3310-3315 line, continue to hold if it breaks

Gold Trading Plan: Liquidity Grabs, Pullback, and UptrendHello Ladies and Gentlemen!
Based on recent news and Trump’s turbulence, we are closely following macroeconomics, the ongoing tariff wars, and geopolitical events. Gold is showing signs of exhaustion after last week's pullback. While we see a recovery, we must remember that not everything we see can be trusted. However, based on our analysis of the current situation and an understanding of market execution and liquidity grabs, we expect a pullback that could confirm the uptrend — providing a potential opportunity to go long.
Here’s the plan:
1. Double check at the current liquidation level
2. Wait for a pullback around a key level below.
3. Confirm the continuation of the uptrend.
We must carefully monitor each market session and pay close attention to macroeconomic news releases, as the market may react sharply by grabbing liquidity. It will be interesting to see how far we can go from here with liquidity runs and whether additional pullbacks will occur. For now, we remain patient and wait for clear confirmation signals.
Share your ideas!

3360 neckline is being tested!
📊Comment Analysis
Short-term short positions need to rebound further and confirm the signal before following. After the US market breaks through the 3360 defense point, it is temporarily not possible to continue to be bearish. The US market will first look at the rebound, and then make further arrangements after approaching the 3360 line.
💰Strategy Package
Long positions:
The US market temporarily enters the market to go long when gold falls back to around 3297-3310 US dollars. Target 3340, stop loss 3345.

Gold 100% Trading StrategyGold prices continued to fluctuate this week. Last Thursday, gold prices stabilized and rebounded near $3,284, and remained strong after breaking through $3,300. During today's Asian session, gold prices repeatedly hit the 3,385 pressure level but failed. After retreating to around 3,369 and gaining support, they rebounded again to around 3,396. The current price faces technical repair needs, but the overall upward trend has not changed, and the probability of breaking through the $3,400 mark is still high. The support level of the retracement is focused on the Asian session low of 3369 US dollars and the 4-hour MA5 moving average of 3360 US dollars. You can arrange long orders on dips; the upper pressure focuses on the 3396-3400 line. After breaking through, you need to be alert to the pressure of the daily error band indicator of 3425-3430 US dollars. At present, you can go short at the rebound of 3395 in the short term. The general trend is still dominated by low and long.
Gold recommendation: Go short near the rebound of 3395-3400, stop loss 3405, target 3370, strict stop loss for large fluctuations
Gold operation: Go long near the retracement of 3370-3375, stop loss 3362, target 3400, strict stop loss for large fluctuations

Gold 100% Profit SignalGold has retreated from $3,500, is the price near a top? Possibly. But I wouldn't sound the alarm bells just yet. This is most likely due to some regular profit-taking. The high indicators are more of a warning than a call to arms. Rather than "get out of here," it's more of a "stay alert."
At present, the initial support below is in the 3405-3400 area. Further down are the two key support levels of 3380 and 3357. 3380 is the support level near the middle track of the 4-hour level, and 3357 is an important top and bottom conversion position in the previous period. These two positions still provide strong support for the future market rise. At present, the 4-hour level high has closed in a bearish pattern of Yin engulfing Yang engulfing, and the K-line is negative. The short-term is expected to improve and fall back. Short-term operations will mainly rebound from high altitudes. Pay attention to the resistance near 3435 and 3450 on the top and do not break the air. Pay attention to the support near 3408-3400 on the bottom. If it breaks, adjust the position and continue to look at 3380.

Gold short-term profit is more fun
🌐 Driving factors
Geopolitical situation: US President Trump's special envoy Witkov held a three-hour meeting with Russian President Putin in Moscow last Friday to discuss the US plan to end the war in Ukraine. The Kremlin said that the positions of the two sides have become closer.
India accused Pakistan of sheltering terrorist organizations, and Pakistan denied it and accused India of instigating separatist activities in Pakistan (such as Balochistan). The situation is difficult to control.
Latest news: Russian President Putin announced on the 28th that a ceasefire will be implemented from 0:00 on May 8 to 0:00 on May 11.
Market bullish sentiment cools down
📊 Commentary analysis
According to the trend of gold in the Asian and European sessions, the trading signals derived from technical analysis have helped many people achieve short-term victories.
🔷 Technical side: For the current gold, the 1-hour chart card fluctuates widely between 3330-3292, and is currently around $3324.
✔Operational suggestions, short-term trading:
US gold operation strategy:
Short strategy: If gold falls back to the range of 3330-3350, you can enter the market to short, target 3270, stop loss 3355
💥Risk warning
Liquidity risk: The market may be bearish in early May, and price fluctuations may be amplified.
Policy black swan: Trump may suddenly change tariff policies or personnel changes at the Federal Reserve, causing violent market fluctuations.
Technical false breakthrough: There are a large number of stop-loss orders near $3350, and you need to be wary of reversals after inducing more.
Summary:
This week, the gold market will be affected by geopolitics, Federal Reserve policies and the trend of the US dollar, and the fluctuation range is expected to be between $3260 and $3350. Investors need to pay close attention to key support and resistance levels and adjust strategies flexibly.

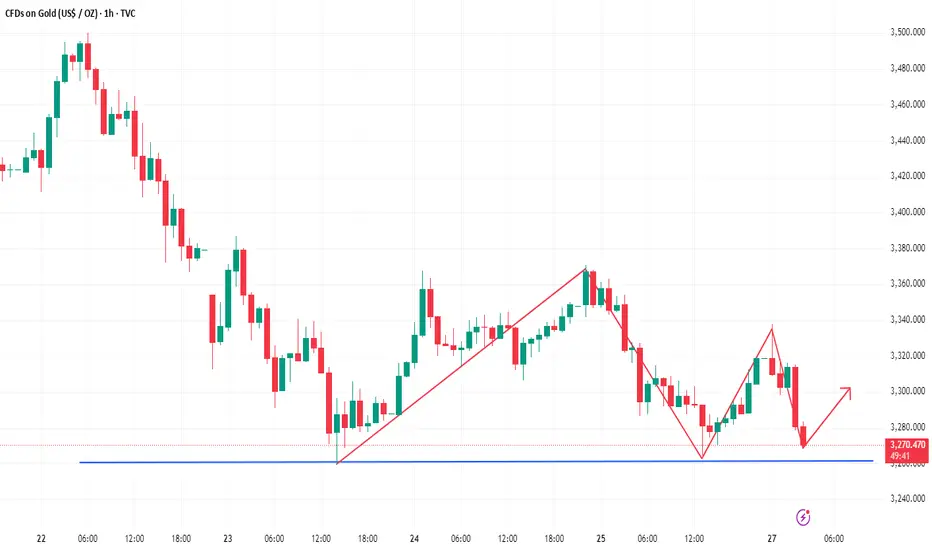
XAUUSD FLAT BOTTOM PATTERNI Created This XAUUSD Chart Analysis In 1-H Tf
Entry Point : BUY Limit 3265
Support zone : 3260
Target Will Be : 3320
NOTE : THIS CHART IS BASED ON PERSONAL ANALYSIS FOR LEARNING PURPOSES. PLEASE USE PROPER RISK MANAGEMENT

#XAUUSD:From Our Last Analysis 534+ Pips What Next?We published our analysis on gold on April 24th, highlighting the bullish market presence. The price indeed reversed from our zone, enabling us to make a significant move of over 234 pips. We anticipate a continuous price increase from our entry zone, potentially reaching 3500$. There are several reasons behind this belief. Firstly, the escalating war-like tension between India and Pakistan could lead to a surge in gold prices, potentially surpassing the previous high. Secondly, the heightened tensions among global investors are expected to result in an extreme bullish movement in gold prices.
Given the volatility of gold, we recommend trading cautiously and taking extra precautions while trading gold.
Wishing you good luck and safe trading!
Thank you for your support! 😊
If you’d like to contribute, here are a few ways you can help us:
- Like our ideas
- Comment on our ideas
- Share our ideas
Team Setupsfx_
❤️🚀

Sell@3300Currently, the level of 3300 is demonstrating rather strong resistance. We can initiate short positions at this point.
⚡️⚡️⚡️ XAUUSD ⚡️⚡️⚡️
🚀 Sell@3300
🚀 TP 3285
Accurate signals are updated every day 📈 If you encounter any problems during trading, these signals can serve as your reliable guide 🧭 Feel free to refer to them! I sincerely hope they'll be of great help to you 🌟

JPMorgan Forecasts Strong 60-90% Growth for Gold Mining JPMorgan Forecasts Strong 60-90% Growth for Gold Mining Sector as Gold Prices Reach Record Highs
Meta Description:
JPMorgan predicts the global gold mining industry will grow by 60% to 90% thanks to record-breaking gold prices, increasing investment demand, and stable production costs. Where are the opportunities for investors?
JPMorgan Forecasts 60-90% Growth for the Gold Mining Industry
According to the latest outlook from leading investment bank JPMorgan, the global gold mining sector is facing an exceptional growth opportunity, expected to rise by 60% to 90% in the near future. This forecast comes amid historic highs in gold prices and a strong surge in gold investment demand.
Rising Gold Prices – The Key Driver for Mining Industry Growth
JPMorgan experts note that gold prices have been setting multiple new records in global markets throughout 2024. The main factors are concerns about inflation, geopolitical instability, and continued monetary easing by major central banks. These conditions have driven investors to seek gold as a safe-haven asset.
Advantages for Gold Mining Companies
JPMorgan believes that gold mining companies will be among the biggest beneficiaries of this uptrend. With production costs remaining stable, gold companies are projected to see significant profit increases—some may even raise dividends for shareholders.
Key factors supporting the gold mining sector include:
Strong increases in international gold prices.
Consistent physical gold demand from central banks.
Growing purchases by both retail and institutional investors
Well-controlled production and mining costs.
Investment Opportunities and Potential Risks
JPMorgan recommends that investors prioritize shares in large gold mining companies with low production costs and strong financial foundations to optimize returns during this gold boom.
However, JPMorgan also warns that the gold mining sector still faces several risks, such as:
High volatility in global gold OANDA:XAUUSD prices.
Rising mining costs if energy prices fluctuate.
Legal and political risks in major gold-producing countries.
Conclusion
With a remarkable growth outlook of 60% to 90% as forecasted by JPMorgan, the gold mining industry is becoming a hotspot for global investment inflows. Still, investors should carefully consider potential risks and select the right gold companies to ensure both safety and effectiveness for their investment portfolios.

Gold fluctuates at high levels, waiting for the adjustment to enGold remained under pressure during the Asian trading session and is currently trading below the $3,300 mark, with a daily decline of about 0.75%. The market sentiment on trade is generally optimistic, and trade tensions are expected to ease. However, the decline in gold consumption in Asian countries in the first quarter has become a key factor in suppressing the demand for gold, a traditional safe-haven asset.
According to market research, data released by the Asian National Gold Association on Monday showed that gold consumption in the first quarter of this year fell 5.96% year-on-year to 290.492 tons. Among them, the demand for gold jewelry fell sharply by 26.85% year-on-year to 134.531 tons, while the consumption of gold bars and gold coins increased by 29.81% year-on-year to 138.018 tons.
According to market research, US President Trump once again emphasized that trade negotiations are underway with Asian countries, and the market hopes for a quick easing of trade tensions. However, Trump's frequent changes in foreign remarks, coupled with continued concerns about a global economic recession, have maintained the safe-haven demand for gold.
Quaid's analysis:
From a technical perspective, the gold price needs to effectively fall below the $3265-3260 range in the short term before a larger correction downward can be confirmed. Once confirmed to fall below, the gold price may quickly fall to the 50% retracement level near $3225, further pointing to the $3200 mark. If $3200 is lost, it will suggest that gold may have peaked in the short term.
On the contrary, if the gold price stabilizes and returns to above $3300, it may face initial resistance in the 3330-3335 area. If it breaks through this area, the short-term rebound target will point to the 3365-3370 supply area.
Once this key pivot position is broken, the gold price is expected to challenge the $3400 mark again, and even further test the intermediate resistance of 3425-3430, and try to return to the historical high of $3500.
Quaid's view:
Although the market's concerns about trade have eased, weak gold consumption in Asian countries and the pressure of the dollar rebound are still there, which may cause gold prices to fluctuate and fall back from high levels. In the next few days, the core economic data of the United States will be the key to determining the next trend of gold. Quaid will pay special attention to changes in the Fed's policy expectations. Real-time analysis for you.
The current market situation, as Quaid analyzed, can only be done in short-term scalping transactions; but always seize opportunities accurately.

GOLD Price Analysis: Key Insights for Next Week Trading DecisionAfter testing a fresh record high around the $3,500 zone, gold made a sharp U-turn, erasing much of its gains and dropping toward the $3,260 support zone.
This reversal came as the US Dollar found fresh strength, following US President Trump’s major backtracking on tariffs against China and the dismissal of Fed Chair Powell.
Markets have since stayed volatile, swinging between "risk-on" and "risk-off" sentiment.
As we head into next week, gold price action is at a critical decision point, and it is unclear whether buyers or sellers will take control.
In this video, I break down the key technical zones, share my trading plan, and discuss potential opportunities to help navigate the uncertainty ahead.
Disclaimer:
This is my take based on experience and what I see on the charts. It’s not financial advice—always do your research and consult a licensed advisor before trading.
#GoldAnalysis #XAUUSD #ForexTrading #GoldForecast #TechnicalAnalysis #GoldPrice #TradingPlan #GoldVsDollar #WeekendMarketAnalysis

The latest gold operation strategyToday, the gold price quickly hit $3336 after opening. The sharp rise in the morning was difficult to continue. After falling back, it fell below the starting point of $3320, indicating that the rise in the morning was an illusion and a lure to buy more. The support below has repeatedly challenged the support point of $3270-60. The gains and losses of this position will directly determine the direction of the next long-short game.
The high point of gold price at the 1-hour level moved down, but the support position of $3260 was not lost. The pressure after the rebound is divided into two, one is the top and bottom conversion of $3295-98, and the other is $3315. Relying on these two positions, we consider continuing to follow the downward decline. This is just a game for intraday long and short positions.
Therefore, today I think that after the rebound, short positions can be shorted within the range of $3300-15. Focus on the gains and losses of $3270-60 below, especially the position of $3260. The short position will continue if it breaks here, otherwise it will continue to maintain the box shock. Remember, as long as the rebound stands above $3340 again, this adjustment is declared over!

4/28 Gold Trading SignalsLast Friday, gold retested the 3260 support zone for the second time. After confirming support, prices began to climb steadily, and our low-entry long positions have already delivered impressive returns.
From a technical perspective, the broader structure still resembles a head-and-shoulders pattern, but recently, a double-bottom pattern has formed around the right shoulder, signaling an intense battle between bulls and bears—mainly influenced by geopolitical tensions.
Here, I would like to propose a bold yet speculative thought:
Could the current turmoil possibly lead to a regime change for Trump, or trigger massive nationwide protests? If such scenarios unfold, it would likely be extremely bullish for gold, potentially pushing prices toward 4000.
On the other hand, if Trump softens his trade policies under pressure, it would be bearish for gold, making a decline toward 2800 highly probable.
Of course, this is purely my personal speculation, and I don't claim deep expertise in international politics.
Focusing back on the technicals:
The 3260 support is critical.
A breakdown could see prices moving toward the 3245–3213 range, or even lower toward around 3190.
Any rebound from there should be carefully watched near the 3260 resistance; failure to break above would suggest a potential further drop toward 3153–3137.
If the double-bottom pattern holds firmly, a return to above 3400 this week is highly likely.
🔥 Today's Trading Plan:
Sell zone: 3407–3418
Buy zone: 3273–3241
Scalping zones: 3288–3323 / 3386–3344
Manage your positions wisely and stay flexible!

XAUUSD Profit signalLast Friday, gold hit the bottom again, with a big negative line all the way to around 3270. Of course, this position is also an obvious double bottom pattern, and it is also an obvious temperature. At present, the bullish form is still there, and the support level is still strong.
The gold four-hour line continues to maintain the bottom signal. The two big positive lines at the bottom support it, and it is also an obvious double bottom rhythm. The two big positive lines start to exert force directly from below the moving average, directly breaking through the rhythm of the sky, and the positive line crushes the moving average, stepping on the moving average to pull up. This is an obvious bullish strength. The K line just falls back, and it is definitely not a U-turn. Therefore, continue to go long in the 3270 area

Gold maintains bullish mindsetThere is a fierce game between bulls and bears in gold prices, but we remain bullish in the long term. The intraday layout follows the general trend and focuses on the gains and losses of the 3260 support below. As long as it remains above 3260, we will maintain our bullish outlook and wait for the gold price to fall slightly to around 3275 before we can intervene and go long in batches!
Gold is long near 3275, stop loss 3260, target 3300
Gold's second bottoming out shows a range, Layout direction!Gold fell back after reaching a high this week, and the highest reached 3500, which was under pressure. The weekly line finally closed with a Yin cross star. It is expected to be a wide sweep range next week, and the overall range will remain at 3370-3260. After breaking through, it will follow the trend. The daily line has bottomed out and rebounded, and the rebound strength is also strong. Finally, it closed with a long lower shadow Yin line. The repeated sweep of hundreds of points is still the main tone. There is no clear direction signal. The upper pressure is around 3348. If the rebound continues at the opening next week, pay attention to this position. If it breaks through, look at 3370-80. Pay attention to the support below 3288 and 3260. Treat it as a shock in operation, and try to participate in the band near the key position!
Operation suggestion: Gold is long near 3285-95, and look at 3325 and 3248! Shorting is possible if the upper 3248 pressure is not broken!

XAUUSD Play: Buy the Dip, Sell the Rip Gold (XAUUSD) Tactical Play: Intraday Long into 4H Premium, Then Position for Higher Timeframe Short
Higher Timeframe (4H + Daily Context) :
1. Daily Chart Bias :
Long-term bullish trend, but now expecting a mean reversion (correction) toward long-term averages (discount area).
2. Current Behaviour :
Price has aggressively rallied over the past weeks, but now it's likely moving into a larger correction phase.
3. 4H Structure :
- 4H Demand Zone (around 3,250–3,300) is still holding — price showed strong reactions after tapping it.
- 4H overall flow shifted bearish after a BOS, but internal structure inside 4H suggests a pullback toward premium levels.
Key Supply Zones Above:
• First Supply : 3,380.962 (4H + 15M alignment)
• Second Supply : 3,410.365 (strong 4H supply)
Internal Structure (15M) :
Current Observations:
1. 15M structure showed a CHoCH to the upside after tapping into the 4H demand — clear internal strength.
2. Entry zone marked in 15M purple zone (small demand refinement).
Expectation:
Price will retrace a little, tap the 15M purple zone, then push upward toward higher liquidity pools.
Targets for the Long Trade:
• First TP : The recent liquidity highs around 3,380.962 (first 4H supply).
• Second TP : 4H Fair Value Gap (FVG) closer to 3,410.365.
Thanks for your Time..

XAUUSD Opening Trends and Trading Strategies Should the downward trend persist and breach the 3265 mark 🔻, the subsequent support level to watch closely will be 3195. Conversely, in the event that this key resistance holds firm 🛡️, there's a strong likelihood of a rebound kicking in as early as next week 📈!
⚡️⚡️⚡️ XAUUSD ⚡️⚡️⚡️
🚀 Buy@3319
🚀 TP 3330 - 3340 - 3360 -3380
Accurate signals are updated every day 📈 If you encounter any problems during trading, these signals can serve as your reliable guide 🧭 Feel free to refer to them! I sincerely hope they'll be of great help to you 🌟
