Gold Buy/Sell Zone Bana Diya Ha Kya Yahaan Sa Trade Leba Safe HaGold ka latest price action dekhte hue maine TradingView par Buy aur Sell zones clearly mark kar diye hain.
Iss chart idea mein aapko milega:
✅ Fresh zones jo price respect kar sakta hai
✅ Kya aap is zone ko dekh kar trade le sakte ho?
✅ Confirmation signals ka short breakdown
✅ Risk management aur entry tips
Agar aap Gold (XAUUSD) mein trading karte ho to yeh chart aapke liye game-changer ban sakta hai.
Chart idea check karein, analysis samjhein aur informed decision lein!
📈 Follow karo aur ko like/share karna na bhoolein!
#GoldAnalysis #XAUUSD #BuySellZone #TradingView #PriceAction #ForexTrading #GoldTrade
Xauusdlong

Gold prices staged a "roller coaster" market, and the trade war In the early Asian session, spot gold showed a trend of rising and falling. The gold price reached a high of US$3370.58/ounce and then fell back to around the 3350 mark for consolidation. After experiencing a sharp drop of nearly 3%, the gold price ushered in a strong rebound, with a single-day increase of 1.83%, and finally closed at US$3348.50. This wave of rebound was mainly driven by the weakness of the US dollar and the entry of market bottom-fishing funds.
The trade deadlock fell into a "Rashomon", and the rebound of the US dollar was blocked
The current gold market is caught in a fierce game of long and short factors. The Asian power issued a solemn statement, emphasizing that if the US side really wants to solve the problem, all unilateral tariffs should be canceled immediately. This statement is in sharp contrast to the "negotiation signal" recently released by the White House, making the trade outlook more confusing.
Affected by this, the US dollar index fell 0.61% to 99.29, while gold received strong support from safe-haven buying.
Quaid believes that the gap between the positions of the United States and China on trade issues is as huge as the Pacific Ocean, and this uncertainty will continue to affect the market trend. The US dollar rebounded but was blocked. Although Trump's attitude eased and it strengthened briefly in the early stage, it showed signs of fatigue again in the morning. At the same time, the US stock market achieved three consecutive positive days, and the S&P 500 index rose by 2.03%, with technology stocks leading the gains.
Quaid's analysis:
Looking forward to the later period, high-level fluctuations may become the main theme, and traders need to grasp the rhythm.
The current market presents a pattern: First, the uncertainty of the trade war. If the US insists on imposing new tariffs, the gold price may hit the $3,500 mark again; second, the suspense of the Fed's policy. Whether the May meeting will release a signal of interest rate cuts will become a key turning point; finally, the trend of the US dollar. If subsequent economic data continues to deteriorate, the US dollar index may fall below the 99 integer mark.
Market operation strategies:
Go long on a pullback of 3335, stop loss at 3330, look at 3380
Go short after rebounding at 3380, stop loss at 3390, and look at 3330

Gold fluctuates in the short term, but you can still make a prof
Gold is still fluctuating. Due to the pressure from the upper moving average, don't chase high for the time being. Wait for gold to pull back and you can still continue to short.
During the US trading time today, short-term gold bulls have begun to be powerless, so when gold pulls back to around 3350, shorts can enter the market at any time, and gold still has the opportunity to adjust. Gold continues to wait and see the adjustment market in the short term, and pay attention to trading signals in time.
Keep an eye on the price and participate well. Grasp the rhythm of gold pullback short-selling transactions. You will find that this kind of fluctuation is much more fun than the big fluctuation.
📊Comment analysis
Gold is currently just a rebound. If there is no special risk-averse news for gold, it will still be difficult to go up directly. At least it will fluctuate first, and it is still a bearish fluctuation now.
💰Strategy Package
Short position:
Actively participate at 3350 points, profit target is around 3310 points
⭐️ Note: Labaron hopes that traders can properly manage their funds
- Choose the number of lots that matches your funds
- Profit is 4-7% of the capital account
- Stop loss is 1-3% of the capital account

4/24 Gold Trading StrategyYesterday's intraday recommendation to buy near 3260 has paid off, with gold trending upward after the market opened today and generating solid profits.
The current pullback appears to be a healthy support retest. However, caution is needed—if the price breaks below 3306, momentum could drag it under 3300 again.
Should that happen, a renewed long position at lower levels is still worth considering. The rebound so far lacks both strength and duration, suggesting a potential shakeout. While it could also be a bull trap, entering at lower levels limits downside risk—with the worst case being reduced profits, not significant losses.
Today's Trading Strategy:
Sell Zone: 3410–3440
Buy Zone: 3267–3230
Flexible Trading Zones: 3383–3340 / 3288–3336

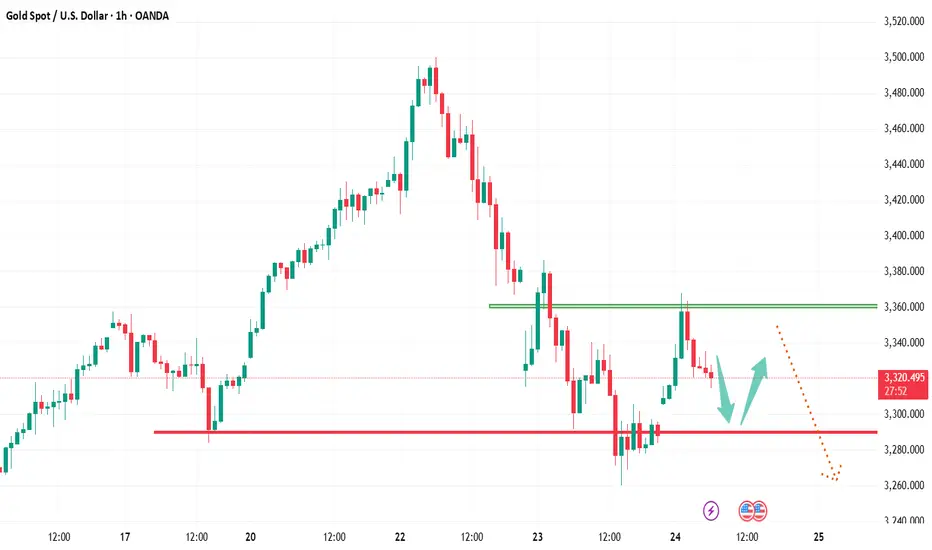
XAUUSD Today's Operation StrategyLooking back on our previous analyses, we have repeatedly emphasized the close correlation between the easing of tariff issues and the pullback in the price of gold 🔍. Now, based on the judgment of the latest market dynamics, today's trading strategy for gold still maintains short selling as its main tone 📉. Here, we solemnly remind all freelance traders that to avoid the risk of account liquidation caused by drastic market fluctuations, it is advisable to stay away from taking long positions as much as possible ⚠️
From a technical analysis perspective, the range between 3380 and 3360 has established a solid resistance barrier 🚧. Once the gold price rises and reaches this area, there is a high probability that it will encounter strong selling pressure and decline 📉. This is precisely the optimal time to place short orders 📝. Additionally, the price range of 3330 - 3320 deserves special attention 👀. As the starting point of a large bullish candlestick on the hourly chart, it also serves as a potential support level for long positions during retracements 📈. At the same time, the gain or loss of the key support level of 3280 below is of great significance 📊. If this support level is effectively broken, it indicates that the bearish forces have full control of the market, and the gold price may initiate a new round of decline ⬇️. The next target level can be focused on around 3195 🎯. It is crucial to keep in mind that in the actual trading process, formulating a rigorous SL and TP strategy and reasonably managing the position size are the keys to stable trading 🔑
⚡️⚡️⚡️ XAUUSD ⚡️⚡️⚡️
🚀 Sell@3380 - 3360 - 3340
🚀 TP 3330 - 3320 - 3300 - 3280
The market has been extremely volatile lately 📈📉 If you can't figure out the market's direction, you'll only be a cash dispenser for others 💰

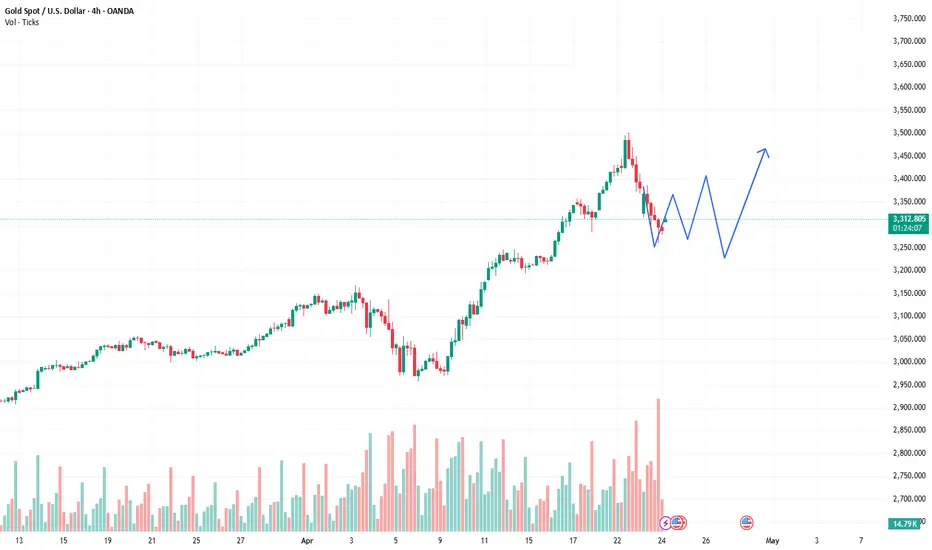
Gold still has the risk of adjustment in the short termAnalysis of gold market trend:
From the daily level, gold rose strongly during the trading session on Tuesday, touched the key price of 3500, then fell under pressure and finally closed with a negative line. This trend of rising and falling shows that the selling pressure from above is heavy, and the bulls are strongly blocked by the bears at high levels. Then, gold continued to fall on Wednesday and closed with a negative line again, forming a technical pattern of two consecutive negative lines. This continuous decline further confirms that the short-term bears are dominant.
From the 4-hour gold chart, the gold price has maintained a fluctuating decline since it was under pressure at the 3500 line. The current price has fallen back to the 3260 line at its lowest, and the short-term decline has reached 240 US dollars. Although there has been a rebound during the day, the upward trend has been destroyed. The MACD indicator double line has issued a dead cross change signal, suggesting that the callback trend may have started. Pay attention to the pressure effect of the 3368 line during the day. For the current market, the rebound is just a flash in the pan, and it rebounded sharply again, reaching the highest point near 3367 and then retreated. It is currently maintained near 3330. In fact, the market is actually at a loss for long and short positions, and is simply unable to withstand its huge shocks. For the Asian session's highs and falls, we support it according to the shock retracement. For example, if the European session rebounds again near 3358-60, we will continue to try to short, with the target at 3320-10, and a loss of 3370. The market amplitude is so drastic that I need to strictly implement good operating habits, try with a light position, strictly stop loss, and don't have a fluke mentality! On the whole, today's short-term operation strategy for gold is to rebound and short, supplemented by callbacks. The short-term focus on the upper side is 3368-3370, and the short-term focus on the lower side is 3260-3285. Friends must keep up with the rhythm.

US policy news triggers huge shock in gold Analytical StrategyThe short-term 4-hour middle track 3380 line has been lost, becoming a key counter-pressure point. As long as the price cannot stand on this position again, it will maintain a downward correction trend. If it falls below 3292, the gains and losses of the 66-day moving average 3260 will be concerned. The 1-hour level K line is under pressure from ma10 and ma5 and continues to fall. After last night's consolidation and pull-up, the current K line has re-run above ma10, and at the same time, macd forms a golden cross below the zero axis. This wave of 200 US dollars of rapid exploration has almost corrected most of the overbought situation. If the price continues to fall, or with the help of bottom divergence, it will slowly brew a short-term bottom. Today's gold rebound reminds that attention should be paid to the resistance below 3340, and the limit is below 3356. If it is not under pressure, it will still be bearish adjustment. Strong support is at 3260 or 3245. After the position stabilizes, it will begin to consider bottom-fishing. For today's short-term operation of gold, it is recommended to focus on rebound shorting and supplemented by callback longing. The short-term focus on the upper side is 3350-3370 first-line resistance, and the short-term focus on the lower side is 3300-3280 first-line support.

Gold re-surged at $3,400. China denies tariff negotiations with International gold prices rebounded as investors bought on dips after a sharp drop in the previous trading day, while the market focus remained on U.S.-China trade tensions.
As of press time, spot gold rose 1.6% to $3,340.79, reaching a high of $3,367 in the Asian session. Gold fell more than 3% on Wednesday, the biggest one-day drop since late November last year.
In addition, the decline in the U.S. dollar index made dollar-denominated gold cheaper for overseas buyers, which also supported gold prices.
Quaid's analysis:
Although the White House has repeatedly released signals this week that relations with Beijing may ease, China said on Thursday that there are currently no ongoing negotiations with the United States on tariffs. China's strong attitude also affects the current trend of gold.
In addition, the data released by the United States today on the number of initial jobless claims in the United States for the week ending April 19 and the monthly rate of durable goods orders in March also directly guided the trend of gold.
Quaid believes that the current trend of gold is still in an upward stage; gold is still supported by many favorable factors, and the "gold bulls" may eventually break through the $3,500 mark firmly.
Quaid recommends the operation strategy:
3335 long, 3330 stop loss, and look up to 3380.
Every decisive decision is paving the way for account value-added. Every decisive decision paves the way for account appreciation. Trust your own judgment, and gold will crown you.

#XAUUSD :Is it a Correction Or a start of Major Bearish Trend? Gold has plummeted from 3550 to 3270, and it’s been falling steadily. We firmly believe that the price could reverse from either of our entry points, but given its significant drop, it raises concerns among traders. If the trend has shifted to bearish, it will likely continue to target buyers’ stop losses. In these market conditions, we strongly advise trading with utmost caution and prioritising risk management.
Good luck and trade safely.
Thanks for your support! 😊
If you want to help us out, here are a few things you can do:
- Like our ideas
- Comment on our ideas
- Share our ideas
Team Setupsfx_
❤️

XAUUSD TRIANGLE PATTERN IN 30-MI Created This XAUUSD Chart Analysis In 30-M Tf
Entry: BUY from 3338
Support zone : 3334
Target Will Be : 3370
NOTE : XAUUSD MADE TRIANGLE PATTERN SO THIS ANALYSIS IS BASED ON PERSONAL ANALYSIS FOR LEARNING PURPOSES. PLEASE USE PROPER RISK MANAGEMENT

XAU/USD Gold Trade Plan 24/4/2025XAUUSD (Gold) Trading Outlook:
Buy Entry: $3,325
Key Support Zones: $3,260 and $3,200
Market Scenarios:
Bullish Scenario:
If XAUUSD sustains above the $3,260–$3,200 support zone, the bullish structure remains intact. A rebound from this zone may offer a buying opportunity with an upside target of $3,500.
Bearish Scenario:
If the price breaks below the $3,200 support level and falls through the channel, it may signal a bearish trend continuation, suggesting potential downside movement.

Gold may continue to fall in the short term
Trading sometimes does require some luck, but in the long run, good luck and bad luck will offset each other. To continue to succeed, you must rely on skills and apply good principles. Always remember; "Trading gold: half science, half art, all discipline."
📌 Driving events
The continued uncertainty of President Donald Trump's tariff policy and its broader impact on global economic growth have exacerbated market anxiety. These factors have triggered a new wave of safe-haven demand, pushing investors back into the gold market.
📊Commentary analysis
Gold prices are still facing selling pressure and are consolidating below the downward trend line. Trading prices are around 3,300 or lower.
💰Strategy Package
Short position:
Participate around 3320-30 points, profit target around 3290-80 points
⭐️ Note: Labaron hopes that traders can properly manage their funds
- Choose the number of lots that matches your funds
- Profit is 4-7% of the fund account
- Stop loss is 1-3% of the fund account
GOLD → Holdings are still insufficient, and there is still potenThe gold market has pulled back sharply one day after hitting an intraday record high of more than $3,500 an ounce. But Quaid believes that the gold rally is far from over as gold is severely under-owned and still cheap by some indicators.
Investors may see some short-term volatility as gold's parabolic move above $3,400 an ounce has made it "overbought at certain technical levels." However, overall, gold is still widely ignored by investors.
This could be a good technical target for gold. Comparing historical gold prices to the cost curve, the ratio shows that we can go further.
Although the opportunity cost of holding gold will remain high, gold remains an important safe-haven asset.
While a large number of investors continue to ignore gold, there is one group in the market that is buying as much of the precious metal as possible, and that is central banks.
Central banks will continue to buy gold as they question the reliability of the United States as a trading partner. The dollar is still weakening despite the selling of long-term U.S. bonds. This shouldn't happen, so there are definitely signs that not all US Treasuries are traditional safe-haven assets, and gold will benefit from this.
I hope this comprehensive analysis by Quaid can help all traders.
If you have other ideas, please leave a message to Quaid and we will discuss its trend together.

Gold price has stopped falling, can we buy higher?The short-term 4-hour middle track 3380 has been lost and has become a key counter-pressure point. As long as it does not stand above it again, it will maintain a downward correction. After breaking 3292 below, it will be the 66-day moving average of 3260. The 1-hour K-line is under pressure, After last night's consolidation and pull-up,plus MACD has a golden cross below the zero axis. This wave of $200 rapid decline has almost corrected most of it. If it continues downward for another wave, or with the help of bottom divergence, it will slowly brew a short-term bottom; today's gold rebound focuses on the resistance below 3340, below the extreme middle track 3356, it is still bearish if it cannot withstand the pressure, and it will start to consider bottom-fishing if the strong support 3260 or 3245 is stable;
Gold peaked and plummeted, entering a correction mode!Analysis of gold market trend:
Technical analysis of gold: Today, the highest price of gold is 3386, and the lowest price of US market is 3260, which is also a drop of 126 points. Although gold has continued its decline, it is not like yesterday. The decline is accompanied by a rebound. The trend of Asian market is a back and forth, and the trend of European market is also a back and forth. Needless to say, the US market fell after the opening and the current rebound, the overall rhythm is bearish, but it is not as clean as Tuesday. This trend reflects the opposition of market sentiment. After the risk aversion subsided, the gold price fell from the high of 3500, but after the long position was sold at a high level, some people still took over at a low level, so it led to a rebound trend after the decline.
Now from the daily chart, the daily K is likely to close with an upper shadow line as on Tuesday. Now the upper shadow line has been formed, so the closing price should be below the opening price of 3320. Now we need to pay attention to whether the lower shadow line can continue to spread downward. In other words, after this wave of rebound in the US market, there will be another wave of decline, and there will be a small rebound; returning to the short-term trend, in 1 hour, after the gold price fell below the two key positions of 3356 and 3285 today, the support moved down to around 3245. Although there was a rebound in the US market, it is likely to go to the range of 3228 to 3245 before rebounding, so the support references are 3260 and 3245; on the other hand, the resistance level, now the gold price pierces 3285 and then rebounds, and is now trading near this. The only reference is 3315 in the Asian session, and then up is the European session rebound high of 3340. If it is effectively crossed here, the bearish outlook will be suspended.
The direction of the end of the session is bearish. The steady operation is to intervene in short orders near 3320 to protect the area near 3330. Of course, you can intervene in short orders near 3310 to see if it can reach the range of 3260 to 3245. This is up to you. Even if it touches this range and rebounds later, I do not recommend participating in long orders. Overall, today's short-term operation strategy for gold is to focus on rebound shorting. The short-term focus on the upper side is 3315-3320 line resistance, and the short-term focus on the lower side is 3260-3245 line support. Friends must keep up with the rhythm.

The rise of the US dollar index suppressed gold.From the perspective of technical analysis, the gold daily chart shows a large negative line pattern and then forms an inverted hammer reversal prototype structure. Today, the key support level below has moved down to the 3300 integer mark area. In the US hourly chart cycle, after the gold price short-term touched the price of 3290 US dollars/ounce, the technical indicators showed oversold repair characteristics, suggesting the existence of technical rebound momentum. The upper resistance level of the current price range is locked in the 3350-3360 US dollars/ounce area, and the core defense level below is still 3300 US dollars/ounce. I think if this support level is effectively broken, it may trigger a technical bottoming out of the price in the 3250 US dollars/ounce area.
It is worth noting that the US dollar index has a short-term technical retracement. This kind of currency market fluctuation may provide a phased rebound support for the gold price through the exchange rate transmission mechanism. However, we need to be alert that the gold price has fallen below the 23.6% Fibonacci retracement level of the upward trend started from $2,900/ounce. If the 38.2% retracement level of $3,289/ounce is confirmed to be lost, it may trigger the resonance of technical stop loss orders and programmatic trading systems, forming further selling pressure. The current market structure shows typical characteristics of long-short game. It is recommended to pay close attention to the significance of gains and losses of $3,300/ounce for trend judgment.
Operation strategy: 1. It is recommended to short gold when it rebounds around 3,310, with the target at 3,290.3250
