Gold price drops to 3250Today's daily line is in the negative, rebounding in the morning, and the high point yesterday morning was 3310, and the bearish point is also at this point. It is higher than the 382 line of yesterday's decline and rebound, 3307. After the morning rebound, the current decline formed a morning downward trend. The watershed is 3308-10, today's short stop loss position. The market fell in the morning, and the strength of the rebound should not be strong. The top and bottom conversion position is 3297-98. The European session broke the bottom, and the US session continued to fall. The next double bottom support is around 3275. If the rebound is in place, it is still bearish, and the decline continues. 3258-60 line.
Xauusdlong

Big day for xauusd (gold)today fed (fomc ) will change the game , so i provide the level on chart. please check that levels . chart say #xauusd touch the level 3264 on negative news that level for buy and positive news for #gold 3296 and 3307 level and next t day 3328 and 3343 . so all thing on fed sir. and i am going for buy . thanks

gold on buy retrace#XAUUSD buy on 2 times breakout above 3300. The bullish needs formation there to start buying.
Buy limit 3300 on 2 times breakout, target 3316-3328, stop loss 3290.
Below 3287 holds bearish continuation if the m30-H1 closes below there target 3267.

GOLD Intraday H2 Chart update for 9 July 2025Hello Traders
as you can see that we have strong resistance on 3310 level only break above that level will consider bullish move
Below 3300 Psychological level market remains Bearish and move towards 3245 level
FOMC Meeting minutes dues today
Disclaimer: Forex is Risky
XAUUSD 15Min – Bullish Reaction from Demand Zone | SMC AnalysisSmart Money Concept (SMC) Analysis
Price has tapped into a clearly defined 4H Demand Zone (highlighted in green) with multiple rejections. Prior liquidity was swept below the 3288 region, trapping early sellers and grabbing institutional interest. This is a classic liquidity grab + demand zone confluence.
🔹 Entry: 3290 – Inside Demand Zone
🔹 SL: 3282 – Below Liquidity Sweep
🔹 TP: 3320 – Targeting Last Broken Structure (Break of Structure)
🧠 Smart Money Clues:
Liquidity grab under the lows ✅
Clean rejection wick ✅
BOS (Break of Structure) above needed for confirmation
Anticipating move back to 3320.57 (blue line) – previous SMC mitigation level
🟢 If price breaks above 3300 with strong volume, more upside is likely.
#XAUUSD #GoldAnalysis #SmartMoney #SMC #DemandZone #LiquidityGrab #TradingView #ForexSignals

Focus on the Fed meeting minutesFrom a technical perspective, the trend of gold is obviously weak. In the morning trading yesterday, the price of gold failed to continue the previous day's rise, and the rebound high kept moving down. After breaking the key support level during the US trading session, it accelerated downward, and the daily line closed with a big negative line, and the short-selling force had the upper hand. Today's closing situation is crucial. If it continues to close with a negative line, the short-term downward trend may be established. The minutes of the Federal Reserve meeting will also bring new variables to the gold market. The policy direction may further affect the trend of gold prices. At present, the upper resistance is 3303-3308, and the lower support is 3284-3278. It is recommended to do more on the callback.
Operation strategy: It is recommended to do more on the callback of 3280-3275, with a target of 3295-3307 and a stop loss of 3370.

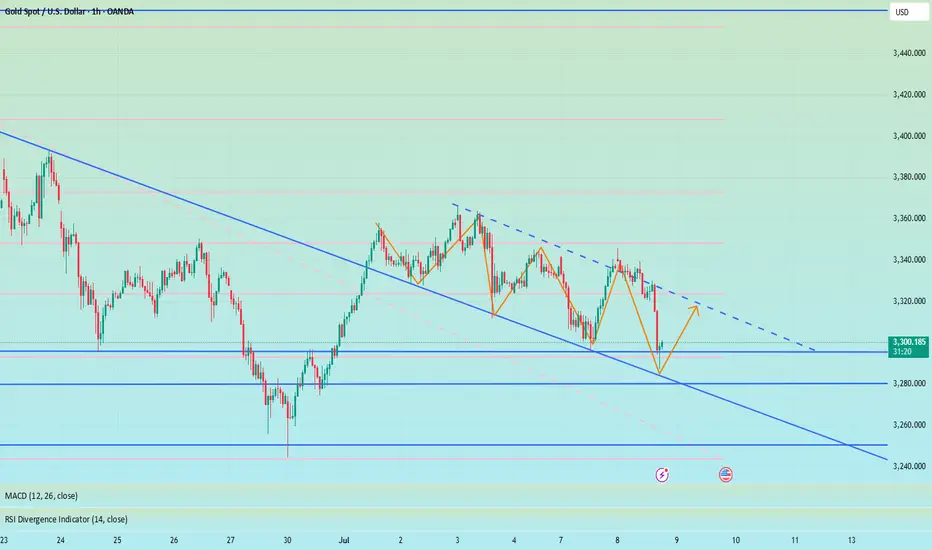
Gold (XAU/USD) Technical Analysis : Structural Analysis + TargetGold is currently trading near $3,292 on the 30-minute timeframe, showing classic signs of accumulation and compression within a well-respected descending channel. The current price action is approaching a critical decision zone, and the market is offering potential clues for both short-term and swing traders.
🔎 Detailed Breakdown of Chart Elements:
🔷 1. Descending Channel & Dynamic Support
Gold has been moving inside a falling channel, with price repeatedly reacting to both the upper and lower boundaries.
The lower boundary of the channel, currently acting as support, has been tested multiple times, suggesting a strong buying interest at this level.
This channel also aligns with the broader downtrend structure, giving sellers confidence while also creating interest for counter-trend buyers looking for reversal setups.
📐 2. Trendline Pressure and Compression
A downward sloping trendline, drawn from the recent swing highs, continues to apply bearish pressure.
Price is squeezing between the channel support and this descending trendline — a tight range compression, which often precedes a volatile breakout.
The analysis notes: “We have to wait for a trendline breakout” – this is a crucial technical signal that will determine the next move.
🚧 3. Break of Structure (BOS) Zones
Two potential bullish BOS (Break of Structure) levels have been identified:
Minor BOS (~$3,300):
A break above this level may signal short-term bullish intent and invalidate minor lower highs.
Early confirmation for buyers to enter with tight risk management.
Major BOS (~$3,310):
This is the key swing high which, if broken, would invalidate the current bearish structure and flip market sentiment bullish.
A strong bullish candle closing above this level could signal the start of a larger upward leg.
📍 4. Next Reversal Zone (Supply Area: $3,320 – $3,330)
This zone represents a strong supply area where previous price action saw heavy selling.
If bulls manage to clear the BOS zones, this area becomes the next target/resistance.
Price reaching this level could lead to a pullback, making it an ideal area for partial take-profits or reassessment of continuation trades.
📈 5. Scenario Planning & Strategy
✅ Bullish Bias (If Breakout Occurs):
Wait for a confirmed breakout above the trendline and Minor BOS with volume.
Ideal long entry would be on the retest of the trendline (now acting as support).
First target: Major BOS, then extend to the Reversal Zone.
Stop-loss can be placed below the channel support or latest swing low.
🚫 Bearish Continuation (If No Breakout):
If price fails to break above the trendline and continues to reject at resistance, sellers may look to short the retest of the trendline.
Targets can be set at the channel's lower boundary or previous lows.
Confirmation: Bearish engulfing patterns, rejection wicks, or divergence.
🧠 Technical Summary & Outlook
Gold is currently in a neutral to slightly bullish consolidation, showing early signs of demand at the bottom of the channel. The market is in "wait-and-watch" mode — traders should focus on the trendline breakout, which will serve as the trigger for directional bias.
The structure is clean, zones are well defined, and potential is high for both scalping and intraday setups. Traders are advised to stay patient and follow price action confirmation before entering trades.
📌 Key Levels to Watch:
Support Zone: $3,280 – $3,285 (Channel Base)
Trendline Resistance: ~$3,294–$3,296
Minor BOS: ~$3,300
Major BOS: ~$3,310
Reversal Zone (Supply): $3,320 – $3,330

Gold Recovery Trade As gold moved around 500 pips on last day. The pull back seems good and this trade's possibility will be good and a good Risk Reward ratio. Keep your risk small if you want to take the trade. This isn't an investment advice this is a probability analysis. Which according to market structure seems good.

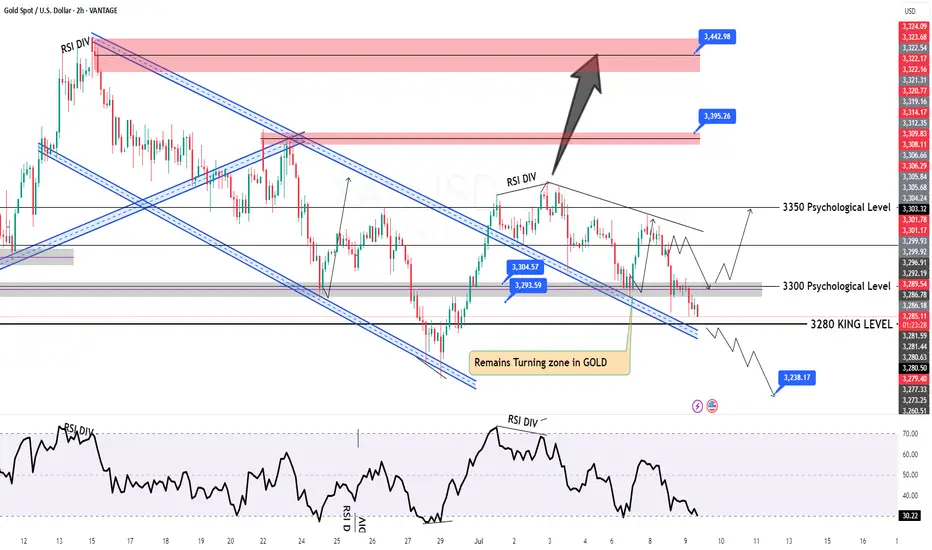
7/9: Failure to Break Above 3321 May Lead to a Drop Toward 3220Good morning, everyone!
Yesterday, gold tested support and attempted a rebound but failed to break through resistance, followed by a second leg down that broke the support zone, invalidating the potential inverse head-and-shoulders pattern and resulting in a drop below the 3300 level.
On the daily (1D) chart, price has now broken below the MA60, signaling a further confirmation of the bearish structure.
However, due to the sharp drop, a double bottom or multi-bottom structure is forming on the 30-minute chart, which may be building momentum for a potential test of the 3321 resistance zone.
📌 Key focus areas:
If 3321 is broken and held, there is room for a short-term rebound to extend;
If 3321 holds as resistance, the current rebound is likely a short-selling opportunity.
Technically speaking, without the support of bullish news, if gold fails to reclaim and sustain above 3321, there is a strong chance of a further move lower—potentially down to 3220, where the weekly MA20 is located. A deeper decline could even test the 3200–3168 support zone.
📉 Therefore, the primary trading bias remains bearish, with sell-on-rebound as the preferred strategy until a stronger bullish signal emerges. Monitor the 3321 zone closely for direction confirmation.

Will gold continue to rise if it accelerates its decline?Technically, we need to focus on the key support of 3260 and the strong resistance range of 3320 above. The hourly chart shows that the short-term moving average diverges downward, and the K-line is under pressure, showing short-term fatigue, suggesting that there is still a need for a correction. The current long-short watershed is at the 3390 mark. If the gold price cannot effectively break through and stand above 3315, the short-term rebound can be regarded as a good opportunity to enter a short position. The 4-hour chart shows that the gold price has received support after touching 3287 and slowly repaired the decline, but it is still in a volatile pattern in the near future. Although the 3287 support is effective, the oscillation range has not been broken. The future direction needs to pay attention to the actual defense strength of the 3260 support level and the direction of the range break. The operation suggestion on Wednesday is to rebound high as the dominant strategy. The upper resistance area focuses on the 3315-3320 range, where short positions can be arranged. The downward targets are 3270 and the key support level 3260. If 3260 is effectively broken, it may open up a larger downward space.

XAUUSD 4H – Smart Money Concept (SMC) SetupPrice action on the 4H chart shows a confirmed Change of Character (CHoCH) at the 3,320 level, marking a shift from a bearish trend into potential bullish order flow. This CHoCH is supported by a strong break of internal structure followed by a pullback.
🧠 Smart Money Insight:
CHoCH Zone (Break of Structure): Price broke the previous lower high, confirming possible bullish intent.
POI (Point of Interest): A refined 4H demand zone sits between 3,280–3,310, aligning with a previous accumulation area. Price is currently approaching this zone with decreasing momentum (potential liquidity sweep below minor lows).
Liquidity Grab: Several equal lows were formed before the POI — prime setup for a liquidity sweep before a bullish push.
Refined Entry Zone: Based on candle wicks and order block imbalance.
🎯 Trade Idea:
🟢 Entry: Wait for bullish reaction or confirmation inside the POI zone (3,295–3,305)
🎯 Target Zones:
TP1: 3,380 (reaction level)
TP2: 3,420–3,440 (major supply zone + inefficiency)
🛡️ Stop Loss: Below 3,270 (invalidates demand zone and structure)
📈 Bias: Bullish unless POI fails
🔍 Confluences:
✅ 4H CHoCH Confirmed
✅ Price approaching refined demand zone
✅ Liquidity resting below recent lows
✅ Previous imbalance not yet filled
✅ Clean supply zone overhead (TP target)
💬 Conclusion:
This is a clean SMC-based long setup. We are waiting for price to tap into demand and show bullish intent before entry. Strong probability of reversal into premium pricing zone if structure holds.
📍Drop a like if you caught this setup or save it to monitor the reaction!

Wednesday's Gold Trend Analysis and Trading RecommendationsGold surged on Tuesday but then kept pulling back during the U.S. session, hitting a recent new low, with intense seesawing between bulls and bears currently. The fluctuating U.S. tariff policies have triggered volatility in risk-averse sentiment, while the over 95% probability that the Federal Reserve will keep interest rates unchanged in July has provided support to the U.S. dollar.
Technically, focus should be on the key support level around 3260 and the strong resistance range of 3320 above. The hourly chart shows short-term moving averages diverging downward, with candlesticks under pressure and showing short-term weakness, suggesting there is still a need for a pullback tomorrow. The current bull-bear watershed lies at the 3390 mark; if gold fails to break through and stabilize above 3315 effectively, any short-term rebound can be seen as a good opportunity to enter short positions.
The 4-hour chart indicates that gold found support near 3287 and slowly recovered losses, but it remains trapped in a consolidation pattern recently. Although the 3287 support is effective, the consolidation range has not been broken. The future direction depends on the actual defensive strength of the 3260 support level and the direction of the range breakout.
For Wednesday's trading, the main strategy is to go short on rebounds. Focus on the resistance zone of 3315-3320, where short positions can be established. The downside targets are 3270 and the key support level of 3260 in sequence. If 3260 is broken through effectively, it may open up more downward space.
XAUUSD
sell@3315-3320
tp:3300-3280-3260
Investment itself is not the source of risk; it is only when investment behavior escapes rational control that risks lie in wait. In the trading process, always bear in mind that restraining impulsiveness is the primary criterion for success. I share trading signals daily, and all signals have been accurate without error for a full month. Regardless of your past profits or losses, with my assistance, you have the hope to achieve a breakthrough in your investment.

The intraday low has already appeared, so go long on gold boldlyGold unexpectedly fell sharply to around 3287. To be honest, the short position is relatively strong. However, since gold fell below 3000, we can clearly see that gold has shown strong resistance to falling during the decline, and the volatility tends to converge around 3287, proving that the buying support below is strong; and as gold continues to retreat, the off-market wait-and-see funds will be more willing to go long on gold; and some short positions will be more willing to go long on gold after profit taking;
In addition, although the short position is strong, it is difficult to continue in the short term. The intraday decline is basically in place. It is estimated that 3287 is the intraday low, so at this stage, it is inconvenient for us to continue to chase short gold. On the contrary, we can boldly go long on gold in the 3305-3295 area and look at the target area: 3320-3330.

7/8: Inverse Head and Shoulders Pattern, Support at 3321–3312Good morning, everyone!
Yesterday, gold broke below the 3321 support during the session, dropped to around 3296, then staged a strong rebound back toward the opening price—forming a classic deep V-shaped reversal and regaining support above the MA60 on the daily chart.
The market remains in a consolidation phase between the MA20 and MA60 on the 1D chart, with no clear directional breakout yet.
On the 30-minute chart, the previous head-and-shoulders top pattern has been completed with the recent decline. The current structure can be tentatively viewed as the formation of a head-and-shoulders bottom.
If this bullish reversal pattern holds:
The 3321 level must act as valid support during any pullback; deeper confirmation may come from 3312, which corresponds to the previous left shoulder low. Although this was partially driven by a data-related spike, most candle bodies remained around 3321—so 3321 is the primary support, and 3312 is the backup.
If confirmed, the price may advance toward the 3360 target zone.
If the pattern fails, watch for the development of a double bottom formation, with MA60 on the daily chart remaining a key support level.
📌 For today, focus on trading within the 3312–3352 range, using a buy-low/sell-high approach, and stay flexible in response to evolving chart patterns.

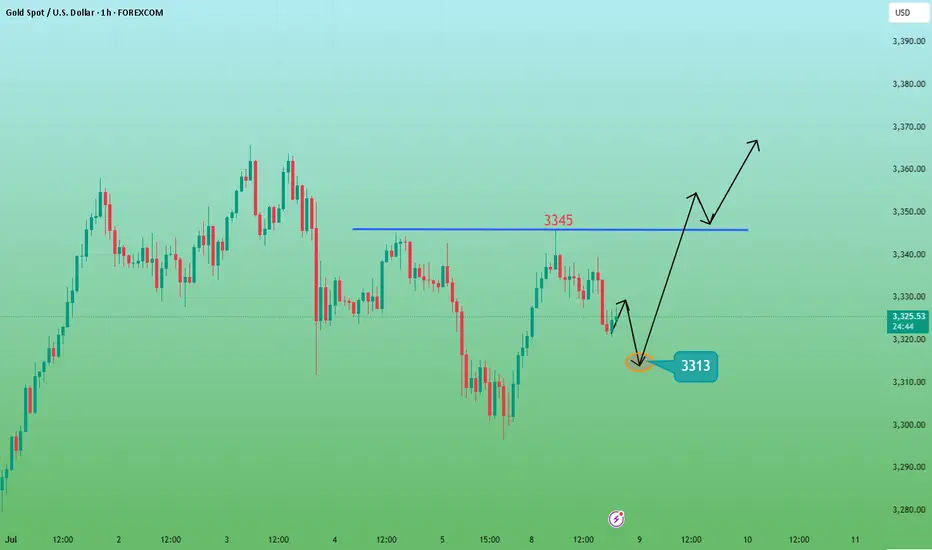
Short-term gold bulls and bears are anxious,3330 becomes the keyAt present, the market has been fluctuating narrowly in the range of 3330-3320, and both bulls and bears are in a stalemate. However, gold has formed a double-layer head and shoulders bottom pattern, so the short-term bullish trend is definitely unchanged. In the previous post, I also mentioned that if the rebound in the European session is weak and gold continues to be below 3345, then the short-term NY session may usher in a retracement and a second bottom. Therefore, I still hold a long order of 3325-3315, and temporarily modify the TP to the 3335 line. I expect that there may be a retracement here, but there may also be a direct retracement. No matter what the situation is, we need to stabilize before entering the market.
In addition to investment, life also includes poetry, distant places, and Allen. Facing the market is actually facing yourself, correcting your shortcomings, facing your mistakes, and exercising strict self-discipline. I share free trading strategies and analysis ideas every day for reference by brothers. I hope my analysis can help you.
PEPPERSTONE:XAUUSD FOREXCOM:XAUUSD FX:XAUUSD FXOPEN:XAUUSD OANDA:XAUUSD TVC:GOLD

How to solve the problem of order being trapped in a loop📊 Gold Day Trading Strategy (Recommendation index ⭐️⭐️⭐️⭐️⭐️)
📰 News information:
1. The lasting impact of new tariffs
2. The impact of geopolitical conflicts
3. The Fed’s interest rate cut
📈 Technical Analysis:
The recent market conditions have been volatile. Many brothers have reported that they have been trapped recently. They have just been released from short positions, but have fallen into the situation of being trapped by long orders again. I have also encountered such a situation recently. Brothers who follow me must know that I have been trapped, but in the process of being trapped, I still share my trading ideas for the brothers who are trapped to check, so that we can all get out of the trap.
Gold fell as expected and hit the lowest point of 3287 before rebounding. The current 3300-3290 range given at the bottom has certain support. At present, I have answered it. As long as it does not fall below 3285, we can still go long and look for rebound correction. TP can temporarily look at 3305-3310. At present, the short-term upper watershed is near the 3321 line. As time goes by, the medium-term point can be seen at 3345. Only when the price stands above 3345 can the upward momentum continue to touch the 3380 line, or even 3400. In the short term, you can go long if you look at the support below. In the short term, pay attention to the resistance above 3315-3320. If it encounters resistance under pressure, it will fall back. On the contrary, after breaking through the first level of resistance, the upward trend will continue.
🎯 Trading Points:
BUY 3300-3290-3285
TP 3305-3315-3320-3345
SELL 3315-3321
TP 3300-3290
In addition to investment, life also includes poetry, distant places, and Allen. Facing the market is actually facing yourself, correcting your shortcomings, facing your mistakes, and exercising strict self-discipline. I share free trading strategies and analysis ideas every day for reference by brothers. I hope my analysis can help you.
TVC:GOLD OANDA:XAUUSD FXOPEN:XAUUSD FX:XAUUSD FOREXCOM:XAUUSD PEPPERSTONE:XAUUSD
Gold Price Setup: Bullish Continuation or Rejection? 🧠 Chart Analysis (XAU/USD – 1H):
Key Structure Highlights:
CHoCH (Change of Character) zones marked both up and down indicate a battle between bulls and bears.
Recent bullish CHoCH followed by a fair value gap (FVG) retest suggests potential continuation to the upside.
Price recently bounced strongly from demand zone, shown by the green arrows and strong candle reaction.
Ichimoku Cloud:
Price is trying to break back above the Kumo (cloud), a sign of bullish momentum building.
However, resistance is still present with the Kijun and Tenkan lines converging.
FVG (Fair Value Gap):
The current price is attempting to fill and break above the FVG zone.
A successful breakout above this area confirms bullish intention.
Fibonacci Levels:
Price is hovering around the 0.5 - 0.618 retracement zone, often a strong reversal or continuation point.
Upside targets lie near the 0.786 retracement (3352) and ultimate target at 3391, a major resistance level.
Risk Management:
Trade setup shows an excellent Risk:Reward ratio.
Stop-loss placed just below the last structure low.
Potential downside to 3290–3258 if breakout fails.
🟢 Possible Next Move:
Bullish Scenario: If price clears the FVG and breaks above 3353, expect continuation to 3391.
Bearish Rejection: If rejected at FVG/0.618 level, watch for a drop back to 3290 or even 3259.

The shock continues, and the retracement continues to go long📊 Gold Day Trading Strategy (Recommendation index ⭐️⭐️⭐️⭐️⭐️)
📰 News information:
1. The lasting impact of new tariffs
2. The impact of geopolitical conflicts
3. The Fed’s interest rate cut
📈 Technical Analysis:
From the hourly chart, gold has formed a head and shoulders bottom. At present, 3320 below has formed a certain support in the short term. For now, the daily line still cannot close below 3320. If the daily line closes below 3320, the decline may open further. On the contrary, the current upper suppression position of gold is near 3350. If the daily line stands above 3350 again, it will be a bull-dominated trend and may test 3380-3390 above. In the short term, pay attention to the support line of 3325-3315 below. If it retreats to the support level, you can consider going long. Look to the resistance range of 3340-3350 above, and pay special attention to the suppression line of 3365-3370. At the same time, if the European session is always suppressed below 3345 and sideways, there is no performance, so you should consider selling it, and there may be further retreat in the evening.
🎯 Trading Points:
BUY 3330-3325-3315
TP 3340-3350-3365
In addition to investment, life also includes poetry, distant places, and Allen. Facing the market is actually facing yourself, correcting your shortcomings, facing your mistakes, and exercising strict self-discipline. I share free trading strategies and analysis ideas every day for reference by brothers. I hope my analysis can help you.
TVC:GOLD OANDA:XAUUSD FXOPEN:XAUUSD FX:XAUUSD FOREXCOM:XAUUSD PEPPERSTONE:XAUUSD

Gold Finds Supports – Is the Rebound About to Begin?Gold ( OANDA:XAUUSD ) declined to the Support zone($3,312-$3,290) and Support lines as I expected in the previous idea .
Gold is currently trading in the Support zone($3,312-$3,290) and near a set of support lines .
In terms of Elliott Wave theory , it seems that Gold has completed the Zigzag Correction(ABC/5-3-5 ) and we should wait for the next 5 impulse waves . One of the confirmation signs of the end of these corrective waves could be the break of the resistance line .
I expect Gold to trend higher in the coming hours and rise to at least $3,343 AFTER breaking the Resistance line .
Second Target: $3,364
Note: Stop Loss (SL) = $3,287
Gold Analyze (XAUUSD), 1-hour time frame.
Be sure to follow the updated ideas.
Do not forget to put a Stop loss for your positions (For every position you want to open).
Please follow your strategy; this is just my idea, and I will gladly see your ideas in this post.
Please do not forget the ✅ ' like ' ✅ button 🙏😊 & Share it with your friends; thanks, and Trade safe.

XAUUSD Breakout Done , Long Entry Valid Now To Get 150 Pips !Here is my opinion on Gold On 15 Mins , we have a very good closure with breakout candle and now the price retest the broken res and new support and we can enter a buy trade as a scalping , if we have a 4H Closure Below 3326.00 this idea will be not valid anymore.

GOLD ON BUY FROM 3316#XAUUSD price we expect drop till 3316 for bullish range to form.
Buy limit 3316-3315.5, target 3330, stop loss 3310.
Below 3306 holds bearish continuation, target 3290-3280.
Bullish range can form above 3330 on 2 times breakout, target 3345

Will gold continue to fall?Judging from the current trend of gold, it is weak in the early trading and continues to break lows in the European trading. Then there will be a second bottoming action in the US trading. Pay attention to the 3330 and 3335 areas for short selling before the US trading. Pay attention to the two support levels of 3318-3315 below. The market changes in real time, and it is recommended to operate in real time according to my prompts before the trading!
XAUUSD Trading Strategy – July 8, 2025Gold (XAUUSD) is trading around 3,331 USD as global markets react to a series of critical economic data releases. The recent rally has brought prices back to a key resistance zone, but selling pressure remains strong due to the following factors:
- The Dollar Index (DXY) TVC:DXY holds steady near 97, its highest level in five weeks. A strong USD continues to weigh on gold, a non-yielding asset.
- U.S. 10-year Treasury yields remain stable at 4.35%, reinforcing expectations that the Federal Reserve will maintain higher interest rates for longer to tame inflation.
- Robust U.S. labor market data and June’s Core PCE figures staying above the Fed’s 2% target further reduce the likelihood of a rate cut in Q3 or Q4.
- Geopolitical tensions remain muted, with no significant escalations in the Russia–Ukraine conflict or Middle East unrest, weakening gold’s safe-haven appeal.
➡ Collectively, these factors suggest that gold’s recent rebound could be a technical pullback within a broader downtrend, unless a new catalyst drives a breakout.
1. XAUUSD Technical Analysis – Daily Chart (D1)
Price is currently testing the 3,331 – 3,340 USD resistance zone, which includes:
A previous supply zone that has rejected multiple rallies.
- Fibonacci retracement 0.5–0.618 from the recent high at 3,405 USD.
- A key Change of Character (CHoCH) area, where trend reversals have previously occurred.
- EMA20 and EMA50 remain aligned downward, confirming the dominant bearish trend.
- RSI hovers around 50 with signs of mild bearish divergence, reflecting weakening bullish momentum.
➡ The current price action fits a classic “sell on rally” setup, with repeated rejections at technical resistance zones.
2. Key Price Levels to Watch
Technical Significance
- 3,340 – 3,331 Confluence resistance (Fibo 0.5–0.618 + supply + CHoCH)
- 3,310 – 3,300 Nearest support – role reversal zone
- 3,275 – 3,260 Short-term target support – June’s low
- 3,223 – 3,205 Strong medium-term support – April’s low + extended Fibo
3. Suggested XAUUSD OANDA:XAUUSD Trading Strategy
Primary Strategy: SELL if price rejects 3,340 – 3,345
Entry: 3,340 – 3,345
Stop Loss: 3,356
Take Profit 1: 3,335
Take Profit 2: 3,330
Take Profit 3: 3,325
Ps : Gold is trading at a critical price zone. If XAUUSD fails to break above the 3,340 USD resistance, there’s a high probability of a pullback toward the lower support levels. Selling at resistance and targeting support remains the preferred approach in the current macro environment, which continues to favor bearish momentum.
This strategy will be updated regularly – save it and follow to avoid missing upcoming opportunities.
Analysis by @Henrybillion
