Gold lacks downward momentum.Today, gold is relatively quiet due to the impact of the US Independence Day holiday. Below, we continue to pay attention to the short-term quality layer of 3324. The key pressure above is maintained at yesterday's opening point of 3345-50. At midnight, gold rebounds near 3345-50 and can be shorted. The target is around 3330-33. It closes early at midnight and maintains a range of fluctuations! If your current gold operation is not ideal, I hope I can help you avoid detours in your investment. Welcome to communicate!
From the 4-hour analysis, pay attention to the support of 3324-30 below, focus on the support position of 3316, and pay attention to the short-term resistance of 3345-50 above. At midnight, the overall high-altitude low-multiple cycle participation remains unchanged. In the middle position, watch more and move less, be cautious in chasing orders, and wait patiently for key points to participate.
Xauusdlong
Go short before breaking 3350, go long before falling to 3320📰 News information:
1. Geopolitical situation
2. Tariff implementation and interest rate cut bill
📈 Technical Analysis:
As I said, the US stock market closed early today, and the market will lack some momentum. It is difficult to have a large fluctuation. It is expected to fluctuate and consolidate. I also explained in the previous post that the upper pressure in the short term is at 3340-3350. If it is touched, we can try to short and defend 3360. If it falls back to 3323, we can try to go long for the first time. If it continues to fall, it is expected to reach 3315-3305. Therefore, if it first touches 3323, go long, SL 3316, and consider going long if it touches 15-05 below.
🎯 Trading Points:
SELL 3340-33350
TP 3330-3320-3310-3300
BUY 3323
TP 3333-3340-3350
BUY 3315-3305
TP 3325-3333-3340
In addition to investment, life also includes poetry, distant places, and Allen. Facing the market is actually facing yourself, correcting your shortcomings, confronting your mistakes, and strictly disciplining yourself. I hope my analysis can help you🌐.
TVC:GOLD OANDA:XAUUSD FX:XAUUSD FOREXCOM:XAUUSD PEPPERSTONE:XAUUSD FXOPEN:XAUUSD

Gold suffered a heavy blow from non-farm payrolls! Yesterday's decline in gold prices was mainly affected by news, and such declines usually do not last too long. From a technical point of view, gold prices received support near 3322 at night, which is the key support level today. It is worth noting that on Wednesday, gold prices were under pressure in the 3340-3344 area, while on Thursday, prices formed support in this range, indicating that the area is forming a top-bottom conversion, so 3340-3345 has become an important pressure level today. It is expected to fluctuate and consolidate in the 3322-3340/45 range during the day. The impact of news on gold prices is usually short-term. When the fundamentals and technical directions are consistent, price fluctuations will be more obvious; when the two are inconsistent, price fluctuations will weaken, but will not change the technical trend. The rebound pattern established at the beginning of the week is still valid. After a short-term shock, gold prices are expected to re-stand above 3345 and continue to maintain the rebound trend.

Tariff tensions heat up againGold, the price rebounded quickly after the parallel attack and defense at 3245 at the beginning of the week. The article emphasizes that the short-term strength will continue. The high point of the week may appear around Thursday's non-agricultural data. The medium-term top idea of 3500-3452 is still maintained; on Tuesday, it actually hit 3358, and the daily K-line combination showed a long arrangement. In the morning, it was emphasized that it was still possible to follow the trend and wait for the non-agricultural data to break through on Thursday night;
The actual retracement rebounded from 3327 and is now reported at 3343, which is in line with expectations; the short-term support in the evening is 3340-3336, and the strong support is 3330; the short-term resistance is 3348, and the strong resistance is 3352-3358. If it breaks, it will look at 3365-3400;

U.S. stocks are closed, how to operate gold volatility📰 News information:
1. Geopolitical situation
2. Tariff implementation and interest rate cut bill
📈 Technical Analysis:
Gold has maintained a volatile pattern recently, lacking a sustained unilateral trend. The unclear short-term direction of DXY has limited the volatility of gold. The market has repeatedly shown a mixture of high-rise decline and downward recovery. It is unable to effectively break through the previous high and lacks the momentum to break downward. The short-term pressure during the day is concentrated on the 3340-3345 line, and the upper middle track is at 3350. If it fails to effectively break above 3350, then gold may fall further. On the contrary, if it can stand above the middle track 33350, then gold may rise further. The short-term support below is near the 3323 line. If it fluctuates during the day, maintain a high-altitude low-multiple cycle.
🎯 Trading Points:
SELL 3340-3350
TP 3330-3320-3310
BUY 3320-3310
TP 3340-3350
In addition to investment, life also includes poetry, distant places, and Allen. Facing the market is actually facing yourself, correcting your shortcomings, confronting your mistakes, and strictly disciplining yourself. I hope my analysis can help you🌐.
FXOPEN:XAUUSD PEPPERSTONE:XAUUSD FOREXCOM:XAUUSD FX:XAUUSD OANDA:XAUUSD TVC:GOLD

Gold accumulates and moves above 3350⭐️GOLDEN INFORMATION:
Gold prices declined by 0.80% on Thursday after a robust US Nonfarm Payrolls (NFP) report boosted the US Dollar, dampening expectations for a Federal Reserve rate cut at the upcoming July meeting. At the time of writing, XAU/USD is trading at $3,332, after reaching an intraday high of $3,365.
June’s employment data significantly outperformed forecasts and even surpassed May’s figures, reinforcing the resilience of the US labor market. Notably, the Unemployment Rate edged closer to the 4% mark, underscoring continued labor market strength. The upbeat report casts doubt on Wednesday’s softer ADP private-sector jobs data, which had shown a 33,000 drop in hiring.
⭐️Personal comments NOVA:
Gold price accumulates and recovers around 3350. Friday has no important news and bank holiday in US session, short-term recovery
⭐️SET UP GOLD PRICE:
🔥SELL GOLD zone: 3365- 3367 SL 3372
TP1: $3355
TP2: $3342
TP3: $3330
🔥BUY GOLD zone: $3311-$3313 SL $3306
TP1: $3325
TP2: $3338
TP3: $3350
⭐️Technical analysis:
Based on technical indicators EMA 34, EMA89 and support resistance areas to set up a reasonable BUY order.
⭐️NOTE:
Note: Nova wishes traders to manage their capital well
- take the number of lots that match your capital
- Takeprofit equal to 4-6% of capital account
- Stoplose equal to 2-3% of capital account

XAUUSD Consolidates Below Resistance – A Breakout Imminent?On the 4-hour timeframe (H4), XAUUSD is clearly consolidating just below the key resistance zone near $3,366, forming higher lows and lower highs within a tightening range highlighted by the shaded area.
1. Key Price Action Highlights
Price has been forming higher lows, suggesting growing bullish momentum.
The $3,366 resistance remains intact – a breakout above this level could confirm bullish continuation.
A visible double bottom (W pattern) formed around June 28 hints at a strong technical rebound after a correction phase.
2. Important Support and Resistance Levels
Price Level
Significance
$3,366 – $3,380
Major resistance zone – likely breakout target
$3,300
Key near-term support where price recently bounced
$3,242
Deeper support – a breakdown here could confirm bearish reversal
3. Suggested Trading Strategy
Buy on breakout above $3,366 with strong volume and clear confirmation (e.g., a large-bodied candle closing above resistance).
Consider buying on a pullback to the $3,320 – $3,300 zone for better risk-reward.
Stay cautious if price breaks below $3,300 – this could signal a bearish shift in momentum.
Gold is currently in a tight consolidation phase under major resistance, with bullish structure still intact. A breakout above $3,366 could trigger a sharp move upward. Until then, traders should monitor the lower boundaries for potential pullbacks or invalidation signals.

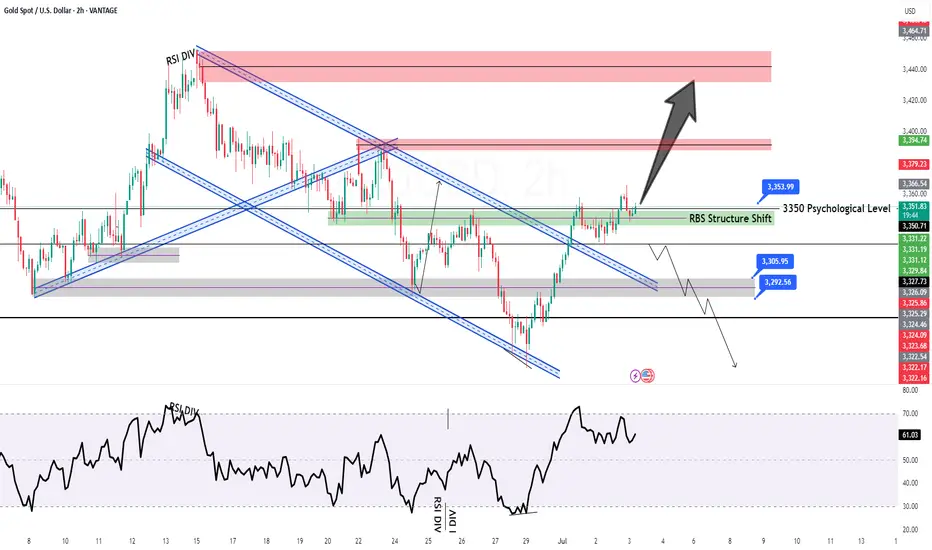
GOLD H2 Intraday Chart Update For 4 July 2025As you can see that GOLD is still in consolidation range above 3300 Psychological Level
Currently prices are still standing @ 3340 nearby Psychological Level, only if market breaks 3368 clearly then it will consider Bullish other below 3368 market still in Bearish Move
Reminder: Today is US Bank Holiday
Disclaimer: Forex is Risky

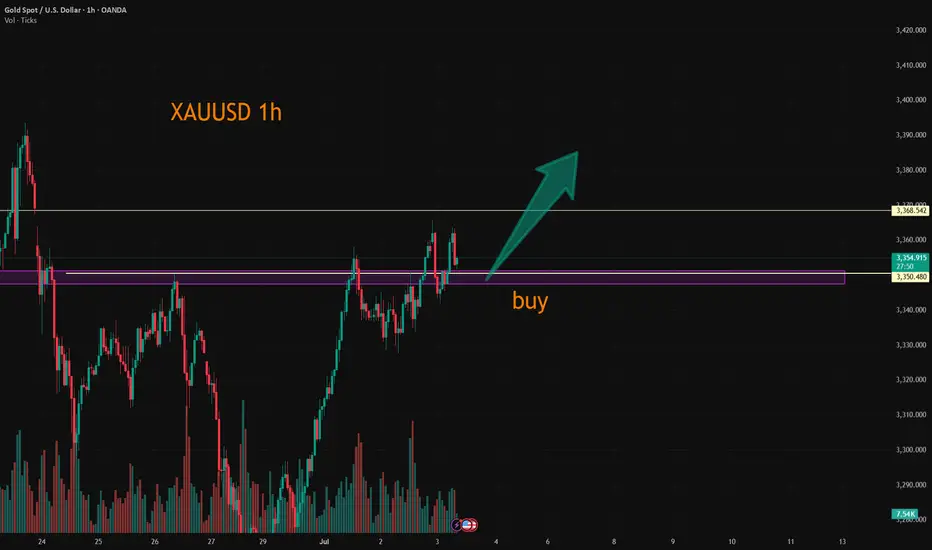
Gold/USD Bullish Breakout Toward Target Zone Gold/USD Bullish Breakout Analysis 🚀🟢
The chart illustrates a strong bullish breakout from a consolidation zone, signaling upward momentum:
🔍 Key Technical Observations:
Support Zone: The price respected the support area around 3,325 – 3,330 USD, forming a solid base for reversal.
Bullish Structure: Series of higher lows and higher highs indicate a bullish trend formation.
Breakout Confirmation: Price broke above short-term resistance with a strong bullish candle, indicating buying pressure.
Trendline Support: The ascending trendline has held well, confirming trend continuation.
Target Point 🎯: Projected target is near 3,365 USD, which aligns with a previous resistance and Fibonacci confluence zone.
✅ Conclusion:
The breakout above resistance, supported by a bullish structure and momentum, suggests further upside potential toward the 3,365 USD target zone. As long as price holds above the breakout level, bullish bias remains valid.
🛑 Watch for invalidation if price falls back

MGC UPDATE 7/2/2025COMEX_MINI:MGC1! played out as expected weekly level was respected and it it clear because of BFI sponsorship Thanks for the people who gave some interest to my last post always happy to help another fellow trader
www.tradingview.com

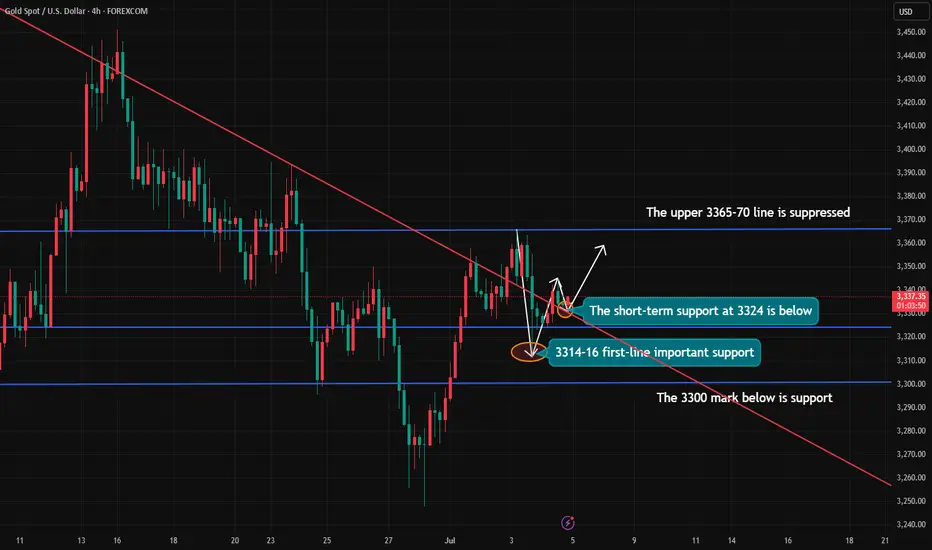
7/4: Trade Within the 3313–3346 RangeGood morning, everyone!
Yesterday’s intraday trades delivered solid profits. Since the U.S. market will be closed today, news-driven volatility is expected to be limited. Therefore, today’s trading focus will primarily revolve around technical setups.
Current structure:
Key support: 3321–3316
Immediate resistance: 3337–3342, followed by 3360
If support holds and resistance breaks, a potential inverse head-and-shoulders pattern may form on the 4H chart, with the next target near 3380
If support breaks, focus shifts to the 3303–3289 support zone
Given the likelihood of range-bound price action today, the suggested intraday range is 3313–3346, with a preference for selling near resistance and buying near support.
If an upside breakout occurs, consider using the MA20 on the 30-minute chart as a guide for pullback entries.

NFP unexpectedly broke out, where will gold go?📰 News information:
1. Initial jobless claims and NFP data
2. The final decision of the Federal Reserve
📈 Technical Analysis:
The unexpectedly negative NFP data caused a sudden plunge in gold prices, which forced me to terminate the transaction urgently. Currently, gold has not fallen below the 3,300 mark. Therefore, I will still pay attention to the closing of the hourly line. If gold closes below 3,320, the downward trend will continue. On the contrary, if it closes above 3,320, gold will consolidate at a high level in the short term. Two days ago, I gave the support level of 3315-3305 below. Please be cautious in trading at the moment.
🎯 Trading Points:
For now, let’s focus on the hourly closing situation
In addition to investment, life also includes poetry, distant places, and Allen. Facing the market is actually facing yourself, correcting your shortcomings, confronting your mistakes, and strictly disciplining yourself. I hope my analysis can help you🌐.
TVC:GOLD OANDA:XAUUSD FX:XAUUSD FOREXCOM:XAUUSD PEPPERSTONE:XAUUSD FXOPEN:XAUUSD

Gold prices plunge after non-farm payrolls surpriseGold was hit by non-agricultural data and fell rapidly in the short term. All cycles showed bearish signals, and there was a slight rebound after the sharp drop. After the release of non-agricultural data, the market broke down directly, and the short-term trend has turned to decline. Data shows that gold fell by $40, the moving average formed a dead cross on the 3-hour chart, the MACD indicator formed a dead cross and increased in volume, and the gold price has fallen below the lower track of the Bollinger Band. It is recommended to continue shorting when it rebounds to the middle track position. The upper pressure level is 3342-3347. The operation is mainly based on rebound shorting.
Operation strategy:
1. It is recommended to short gold near the rebound of 3342-3347, stop loss 3355, target 3330-3320

7/3: Focus on Short Positions, Watch Support Near 3320Good morning, everyone!
Yesterday, gold tested support near 3328 but failed to break below it effectively. The price then rebounded toward the 3350 level. At today’s open, gold briefly extended to around 3365 before pulling back.
Technically:
On the daily (1D) chart, the price remains capped by the MA20, with no confirmed breakout yet.
Support levels below are relatively dense, and moving averages are increasingly converging, suggesting a breakout in either direction is approaching.
Key intraday support lies in the 3321–3316 zone.
On the 2-hour chart, we are seeing the first signs of a bearish divergence, indicating a need for technical correction. Much like Tuesday’s setup, there are two possible scenarios:
If 3342–3334 holds, the price may extend slightly higher, intensifying divergence before pulling back;
If 3337 breaks, we could see a drop toward 3320, where correction would occur through a direct decline.
From a fundamental perspective, several high-impact U.S. data releases are scheduled for the New York session, which may increase volatility and make trading more challenging.
Trading suggestion:
For most traders, the safest approach is to wait for data to be released, then look for oversold rebounds or overbought corrections following sharp market reactions.
This style requires patience and strong risk control—avoid being overly aggressive or greedy, as such behavior can easily lead to trapped positions or even liquidation.

Buying the Dip or Catching a Knife? My Gold Setup Explained.Entered a long position on XAU/USD from the 1H demand zone following sharp intraday selling into a key support level. With gold hovering near $3,300 and a significant testimony from Fed Chair Powell on deck, the setup aligns with both technical rebound potential and fundamental uncertainty that could fuel upside.
The goal here is to play the liquidity vacuum left after aggressive positioning was cleared, with tight invalidation and asymmetric reward.
Technicals:
• Entry aligned with prior price inefficiency and confluence of multiple demand zones
• 1H structure shows clear deviation below the range with immediate buy-side response
• EMA channel flattening, indicating potential compression ahead of expansion
• First target: $3,352
• Risk-managed with defined stop-loss below $3,260
Execution Note: This is not a “hold forever” trade. It’s an opportunistic reaction to unwind + sentiment imbalance.
Fundamentals
• Gold saw a 25% surge in 2024 due to safe-haven demand and dovish policy, but enters 2025 under pressure from:
▫️ A strong USD
▫️ Higher cost of carry
▫️ Speculators taking profit
• Fed policy remains the core variable:
▫️ A hawkish tone from Powell could weigh on price
▫️ Rate cuts would likely revive bullish momentum
• Central bank demand remains supportive
• Geopolitical tensions (Russia-Ukraine, Israel-Iran) could trigger safe-haven bids again.
Bearish headwinds:
• Waning bullish momentum per RSI divergence
• Reduced rate cut expectations post-election
• Powell’s testimony could revive volatility either way.
This is a short-term tactical long, not a macro bet. With sentiment temporarily overextended and key support defended intraday, this is a high R/R window to exploit Powell-related volatility.
Let’s see how price reacts into $3,350+. Any sustained strength there would open room toward $3,400, while failure would confirm a retest of $3,260s.
Note: Please remember to adjust this trade idea according to your individual trading conditions, including position size, broker-specific price variations, and any relevant external factors. Every trader’s situation is unique, so it’s crucial to tailor your approach to your own risk tolerance and market environment.

XAUUSD:A long trading strategy
The highest gold price in the Asian session reached 3365.4, which is already our mid-line target range. If you have completed and left the market, congratulations, because I personally set the TP point of 3368, so it did not touch, the trend of the past two days is appropriate rewithdrawal after strengthening, the high is also gradually rising, the overall long trend has not changed. For today's data, the probability will make gold prices continue to rise, trading ideas or to do the main.
Trading Strategy:
BUY@3347-51
TP:3365-70
This TP range is also the target range of the median trader, for friends who do not have automatic stop profit, you can take a profit manually at that time.
More detailed strategies and trading will be notified here ↗↗↗
Keep updated, come to "get" ↗↗↗
Who will be the winner in the battle between bulls and bears?From the analysis point of view, the short-term resistance above is around 3295-3301, and the pressure at 3315-3316. Focus on the pressure at 3324, the long-short watershed. In terms of operation, the rebound will continue to be the main short and look for a decline. The short-term support below is around 3250-3255. Relying on this range, the main tone of high-altitude participation remains unchanged.

Gold is unilaterally upward during the dayGold, the general trend is as described in the morning analysis. The price fell from the 3452 high point in this round. On Monday, it rebounded quickly after parallel attack and defense near 3245. The article emphasizes that the short-term strength will continue. The high point of the week may appear around Thursday's non-agricultural data. The medium-term top idea of 3500-3452 is still maintained;
It actually opened unilaterally upward from 3303 during the day and is now reported at 3340; the bullish pattern of each cycle is good, and there will be a high in the evening; short-term support is 3338, strong support is 3332; short-term resistance is 3350-3356, strong resistance is 3365-3374;

Gold Breakout Retest – Will PRZ Trigger the Next Rally?Gold ( OANDA:XAUUSD ) attacked the Resistance lines and Resistance zone($3,350-$3,326) as I expected in yesterday's idea .
Gold seems to have broken the Resistance zone($3,350-$3,326) and Resistance lines and is pulling back to this zone.
In terms of Elliott Wave theory , Gold appears to have completed wave 3 and is currently completing wave 4 .
I expect Gold to have a chance to rise back to the Resistance zone($3,394-$3,366) after entering the Potential Reversal Zone(PRZ) .
Note: Stop Loss (SL) = $3,297=Worst SL
Gold Analyze (XAUUSD), 1-hour time frame.
Be sure to follow the updated ideas.
Do not forget to put a Stop loss for your positions (For every position you want to open).
Please follow your strategy; this is just my idea, and I will gladly see your ideas in this post.
Please do not forget the ✅ ' like ' ✅ button 🙏😊 & Share it with your friends; thanks, and Trade safe.

XAUUSD:Today's Trading Strategy
Gold retreated in the sub-session, I have personally increased my long position near 3331, the overall trend is bullish unchanged, the median strategy is patient to rise. If you are trading short, you can go long at 3325-3330 and leave at 3340-45. The same can be said if you want to solve the problem; Trade according to your trading preferences and risk tolerance.
More detailed strategies and trading will be notified here ↗↗↗
Keep updated, come to "get" ↗↗↗

GOLD H2 Intraday Chart Update For 3 July 2025Hello Traders,
Main event of is day NFP and all eyes on 3400 Psychological for now, right now market sustains around 3350 Psychological level for downward move GOLD still need to break 3324 level in order to go further down above 3324 LEVEL GOLD is still remains Bullish
Remember: It's NFP day
Disclaimer: Forex is Risky
GOLD LOND TRADE IDEA We Are Looking Gold Bullish Today ,
TL BUY AREA : 3347 💡
1ST SUPPORT BUY : 3336, 3333 💡
2ND SUPPORT BUY: 3329, 3325 💡
If Gold Break The Trendline Then We See Gold Bearish Price Then We Buy At Support The Target Will Be ATH Liquidity 3390
If Gold Breaks Also 2nd Support Then Continue Bearish Trend Then We Trade Sell On a2nd Support Break
Manage Trades Properly Dont Forget To Follow Us For More Free Trades

Gold growth, recovery 3393⭐️GOLDEN INFORMATION:
Gold prices edge higher during the North American session as investors turn their attention to the upcoming US Nonfarm Payrolls (NFP) report — a key indicator that could influence the Federal Reserve’s next policy move. At the time of writing, XAU/USD is trading at $3,348, up 0.29%.
Recent labor data from ADP revealed that companies are pausing hiring rather than resorting to layoffs, reflecting caution amid uncertain economic conditions. Meanwhile, Microsoft’s decision to cut 9,000 jobs has added to concerns about a softening labor market.
Traders now await Thursday’s official employment report from the Bureau of Labor Statistics, which is projected to show 110,000 new jobs added in June — a slowdown from May’s 139,000. The Unemployment Rate is expected to tick up slightly to 4.3%, still within the Fed’s projected range of 4.4% according to its latest Summary of Economic Projections.
⭐️Personal comments NOVA:
good buy, hold before NF news. Dollar continues to be under selling pressure from investors, worried about the Trump administration's unstable tariff policies.
⭐️SET UP GOLD PRICE:
🔥SELL GOLD zone: 3393- 3395 SL 3400
TP1: $3380
TP2: $3363
TP3: $3350
🔥BUY GOLD zone: $3296-$3294 SL $3289
TP1: $3308
TP2: $3318
TP3: $3330
⭐️Technical analysis:
Based on technical indicators EMA 34, EMA89 and support resistance areas to set up a reasonable BUY order.
⭐️NOTE:
Note: Nova wishes traders to manage their capital well
- take the number of lots that match your capital
- Takeprofit equal to 4-6% of capital account
- Stoplose equal to 2-3% of capital account
