XAU: An upward trend - will it continue or die?The price of gold is in the middle between long-term support / resistance levels. An upward trend may lose momentum. The dimension of the movements upwards is reduced. The size of the rollbacks is increasing. The closer the summer, the stronger the influence of seasonal decline in gold prices. If the upward trend does not get support in the coming weeks, work towards an uptrend may be dangerous.
Xauusdlongterm

Gold: 2017 TechnicalsWe are seeing a good bounce this week.
The weekly chart for 2017 looks very promising.
RSI is turning up from hitting 30.
MACD will cross in negative territory.
MA50 is crossing MA200 this week.
We printed a healthy correction for the 2016 rally.
The fundamentals for 2017 alse look promising
DXY made a 14 year high, a serious correction is near.
S&P 500 is making new all time highs on staggering earnings. (I can't believe people are buying at these P/E levels...)
The FED again made a promise they can't keep.
Inflation has yet to pick up.
The possibility of a EU breakdown is looming
European banks are facing solvability issues, politicians said another bailout is off the table.
Trump is a big question mark, the only certainty is the uncertainty he brings. He's the only one that might spoil our 2017 gold party with a prolonged USD/S&P rally.
We need a clean and strong break of 1171 for this to work.
A happy 2017.

XAUUSD GOING DOWN ! IS CLEAR IS HEADING DOWN AND DOWN BUT WE SHOULD WAIT IF IT BREAKS THIS SUPPORT ZONE !
I AM PLACING A SELL ORDER @ 1193.00 AND TP 1150.00
TRADE WITH CARE !

newh higher high (10/11/2016)new higher high was created as the market react on trump, hello bulls
keep it simple and stupid!
watch your money management!
this is my idea the risk is all yours!

XAUUSD LONG TERM INVESTMENT IDEAON THE DAILY CHART PRICE IS MAKING ITS FINAL PUSH BEFORE A BREAKOUT FROM THE BEAR FLAG PATTERN.
PRICE WILL MAKE ONE MORE FINAL DESCENT TO THE MAJOR SUPPORT TREND LINE.
WAIT FOR THE BREAKOUT OF THE FIB AT THE 1355.02 LEVEL.
STOP LOSS IS 1338 LEVEL.
THERE IS NOT PROFIT TARGET ON THIS ONE. JUST FOLLOW THE TREND.

XAU USD TRIPLE BOTTOM LONG TRADE IDEAON THE CHART PRICE RETESTS THE 1308 ((0.618) Fib level.
PUT A BUY STOP AT THE 1310 LEVEL AS SOON AS PRICE IS READY TO 'TAKE OFF''.
STOP LOSS JUST BELOW THE MAJOR RESISTANCE TREND LINE.
LIMIT SHOULD BE THE 1348 LEVEL.
STOCHASTIC/RSI IS GOING BELOW THE 20 LEVEL.

xuausd next movements assumption I dont know when will the gold touch 1310~15 this support area . if gold stop fall down around this area i believe gold will pull back to 1330 or more than 1345


XAUUSD | Ascending Triangle Movement Until 21/09/2016Hi everyone!
As i insistently said in my last posts, speculative movements are occurred under my green line 1. As i said again in this post " I see that after the price had touch to green line 1, a strong movements had came in 2 days and it touch blue line 1 least. " A strong movement had came!
I keep my chart but i have added price labels and yellow arrows for next 2 weeks.
Please note that time prediction is always been hard but i expect an ascending triangle movement until 21/09/2016 which visits my price labels.
In a nutshell when i see 1331-1333 $ i will be "seller" , when i see 1316 i will be "buyer" for next 2 weeks.
At 21/09/2016 the price may suddenly touch to 1317 and then rise.
This is not an investment advice, all these are analysis based predictions and notes for myself.
Best regards.
Volkan ONURSOY

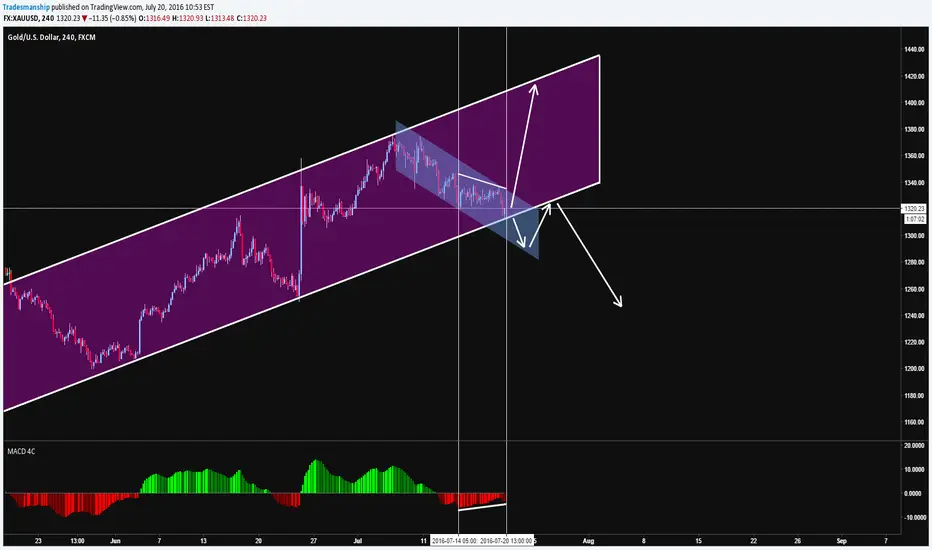
Different perspective on gold.Earlier we were hoping for a short term short knowing that the general trend is bullish.
We took 20 pips in the old trade and we have a new trade setup here.
We have a minor channel embedded in a major channel, I have already bought at 1317 .
I don't think its wise selling even if we do break to the downside but this scenario is quite unlikely.
you can either buy at this point if your a aggressive trader or wait for it to break out the minor channel before making a move.
GOLD Divergence/Wedge/Cypher Patterns SHORTThe chart is self explanatory.
Scenario 1:
- Bears push the price down to around 1300.00 which is between the 61.8% and the 50.0% Fibonacci retracement levels and bounces off any of these two levels to POSSIBLY test the previous high.
Scenario 2:
- Bears push the price down to around 1300.00 which is between the 61.8% and 50.0% Fibonacci retracement levels, instead of bouncing back up, price breaks out the bottom of the rising wedge and the rest is history.
What Do YOU Think?
ANYTHING CAN HAPPEN!

