XAU/USD 20 March 2025 Intraday AnalysisH4 Analysis:
-> Swing: Bullish.
-> Internal: Bullish.
Price has very nearly printed a bearish CHoCH following printing further all time highs.
CHoCH positioning is very near current price.
Remainder of my analysis remains the same as yesterday's analysis dated 19 March 2025
Price has printed a bullish iBOS, however, I will apply discretion and not classify as a bullish iBOS due to very insignificant pullback which would distort internal range. Therefore, I have marked the iBOS in red.
Intraday Expectation:
Await for price to indicate pullback phase initiation by printing bearish CHoCH. ChOCH positioning is denoted with a blue dotted line.
Note:
With the Federal Reserve's dovish stance and persisting geopolitical uncertainties, heightened volatility in Gold is expected to continue. Traders should proceed with caution and adjust risk management strategies in this high-volatility environment.
Price could also be driven by President Trump's policies, geopolitical tensions and economic decisions which are sparking uncertainty.
H4 Chart:
M15 Analysis:
-> Swing: Bullish.
-> Internal: Bullish.
Again, since yesterday's analysis, price has continued to surge to new all time highs, largely fuelled by geopolitical tensions. Gold is solidifying itself as a safe haven asset.
Price has printed a further bullish iBOS followed by a bearish CHoCH to confirm internal structure.
Intraday Expectation:
Price has mitigated M15 demand zone. Technically price should target weak internal high priced at 3,057.590.
Alternative scenario:
You will note internal range has significantly narrowed. All HTF's require a pullback, therefore, it would be completely viable if price printed a bearish iBOS.
Note:
With the Federal Reserve maintaining a dovish stance and ongoing geopolitical tensions, volatility in Gold prices is expected to remain elevated. Traders should exercise caution, adjust risk management strategies, and stay prepared for potential price whipsaws in this high-volatility environment.
M15 Chart:
Xauusdmapping

XAU/USD 13 March 2025 Intraday AnalysisH4 Analysis:
-> Swing: Bullish.
-> Internal: Bearish.
Analysis/Bias remains the same as analysis dated 07 March 2024.
Price has printed a bullish CHoCH according to analysis and bias dated 28 February 2025.
Price is currently trading within an established internal range.
Intraday Expectation:
Price is now trading in premium of 50% internal EQ where we could see a reaction at any point. Price could also target H4 supply zone before targeting weak internal low, priced at 2,832.720
Note:
With the Federal Reserve's dovish stance and persisting geopolitical uncertainties, heightened volatility in Gold is expected to continue. Traders should proceed with caution and adjust risk management strategies in this high-volatility environment.
Price could also be driven by President Trump's policies, geopolitical moves and economic decisions which are sparking uncertainty.
H4 Chart:
M15 Analysis:
-> Swing: Bullish.
-> Internal: Bullish.
Analysis and bias has not been met, largely due macroeconomic events, particularly the Trump trade tariff war, which is causing uncertainty within the markets which is supporting Gold price.
Price has printed a bullish iBOS.
Within the structure following the iBOS, price has printed a several bearish CHoCH's with very minimal pullbacks before continuing bullish.
In order not to distort internal structure range I will apply discretion and not classify bearish CHoCH without considerable pullback.
Intraday Expectation:
Await for price to print Bearish CHoCH which is supported by a pullback relative to recent price action.
Note:
With the Federal Reserve maintaining a dovish stance and ongoing geopolitical tensions, volatility in Gold prices is expected to remain elevated. Traders should exercise caution, adjust risk management strategies, and stay prepared for potential price whipsaws in this high-volatility environment.
M15 Chart:

XAU/USD 12 March 2024 Intraday AnalysisH4 Analysis:
-> Swing: Bullish.
-> Internal: Bearish.
Analysis/Bias remains the same as analysis dated 07 March 2024.
Price has printed a bullish CHoCH according to analysis and bias dated 28 February 2025.
Price is currently trading within an established internal range.
Intraday Expectation:
Price is now trading in premium of 50% internal EQ where we could see a reaction at any point. Price could also target H4 supply zone before targeting weak internal low, priced at 2,832.720
Note:
With the Federal Reserve's dovish stance and persisting geopolitical uncertainties, heightened volatility in Gold is expected to continue. Traders should proceed with caution and adjust risk management strategies in this high-volatility environment.
Price could also be driven by President Trump's policies, geopolitical moves and economic decisions which are sparking uncertainty.
H4 Chart:
M15 Analysis:
-> Swing: Bullish.
-> Internal: Bearish.
Analysis and bias remains the same as analysis dated 03 March 2023.
As mentioned in my analysis dated 28 February 2025, whereby price printed a bullish CHoCH but stated I would continue to monitor price.
On this occasion I have marked the previous bullish CHoCH in red as price did not pull back deeply enough to warrant internal structure breaks, additionally, there was minimal time spent .
Price has printed a further bullish CHoCH which is now confirmed. Price is not trading within an established internal range.
Intraday Expectation:
Price to continue bullish, react at either premium of internal 50% EQ, or M15 supply zone before targeting weak internal low priced at 2,832.720.
Note:
With the Federal Reserve maintaining a dovish stance and ongoing geopolitical tensions, volatility in Gold prices is expected to remain elevated. Traders should exercise caution, adjust risk management strategies, and stay prepared for potential price whipsaws in this high-volatility environment.
M15 Chart:

XAU/USD 10-14 March 2025 Weekly AnalysisWeekly Analysis:
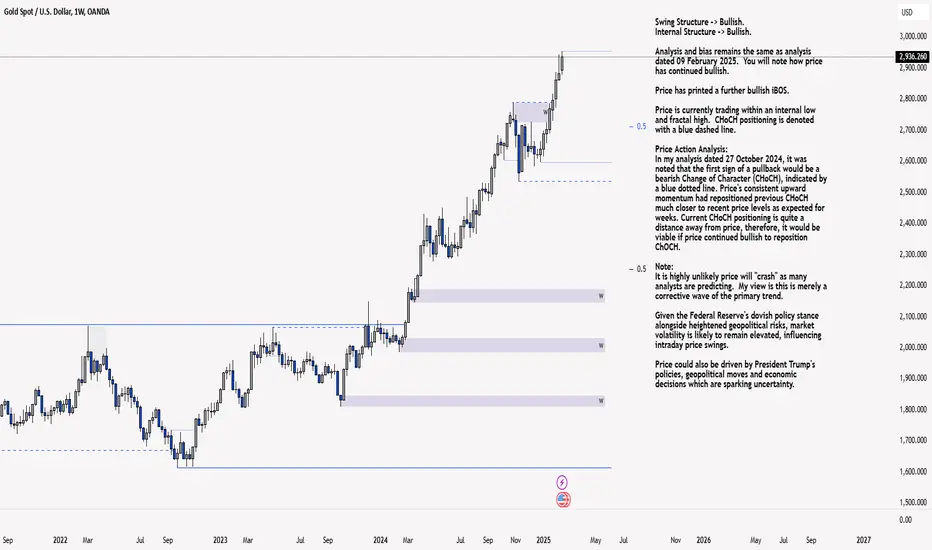
Swing Structure -> Bullish.
Internal Structure -> Bullish.
Analysis and bias remains the same as analysis dated 09 February 2025.
Price has printed a further bullish iBOS.
Price is currently trading within an internal low and fractal high. CHoCH positioning is denoted with a blue dashed line.
Price Action Analysis:
In my analysis dated 27 October 2024, it was noted that the first sign of a pullback would be a bearish Change of Character (CHoCH), indicated by a blue dotted line. Price's consistent upward momentum had repositioned previous CHoCH much closer to recent price levels as expected for weeks. Current CHoCH positioning is quite a distance away from price, therefore, it would be viable if price continued bullish to reposition ChOCH.
Note:
It is highly unlikely price will "crash" as many analysts are predicting. My view is this is merely a corrective wave of the primary trend.
Given the Federal Reserve's dovish policy stance alongside heightened geopolitical risks, market volatility is likely to remain elevated, influencing intraday price swings.
Price could also be driven by President Trump's policies, geopolitical moves and economic decisions which are sparking uncertainty.
Weekly Chart:
Daily Analysis:
Swing -> Bullish.
Internal -> Bullish.
As per analysis dated 16 February 2025 price has printed a bearish CHoCH which indicates, but does not confirm, bearish pullback phase initiation
Price is now trading within an established internal range. I will however continue to monitor price and depth of pullback.
Expectation is for price to trade down to either discount of internal 50% EQ, or Daily demand zone before targeting weak internal high, priced at 2,956.310.
Note:
With the Fed maintaining a dovish policy stance and the continued rise in geopolitical tensions, we should anticipate elevated market volatility, which may impact both intraday and longer-term price action.
Price could also be driven by President Trump's policies, geopolitical moves and economic decisions which are sparking uncertainty.
Daily Chart:
H4 Analysis:
-> Swing: Bullish.
-> Internal: Bearish.
Analysis/Bias remains the same as analysis dated 07 March 2024.
Price has printed a bullish CHoCH according to analysis and bias dated 28 February 2025.
Price is currently trading within an established internal range.
Intraday Expectation:
Price is now trading in premium of 50% internal EQ where we could see a reaction at any point. Price could also target H4 supply zone before targeting weak internal low, priced at 2,832.720
Note:
With the Federal Reserve's dovish stance and persisting geopolitical uncertainties, heightened volatility in Gold is expected to continue. Traders should proceed with caution and adjust risk management strategies in this high-volatility environment.
Price could also be driven by President Trump's policies, geopolitical moves and economic decisions which are sparking uncertainty.
H4 Chart:

XAU/USD 07 March 2025 Intraday AnalysisH4 Analysis:
-> Swing: Bullish.
-> Internal: Bearish.
Price has printed a bullish CHoCH according to analysis and bias dated 28 February 2025.
Price is currently trading within an established internal range.
Intraday Expectation:
Price is now trading in premium of 50% internal EQ where we could see a reaction at any point. Price could also target H4 supply zone before targeting weak internal low, priced at 2,832.720
Note:
With the Federal Reserve's dovish stance and persisting geopolitical uncertainties, heightened volatility in Gold is expected to continue. Traders should proceed with caution and adjust risk management strategies in this high-volatility environment.
Price could also be driven by President Trump's policies, geopolitical moves and economic decisions which are sparking uncertainty.
H4 Chart:
M15 Analysis:
-> Swing: Bullish.
-> Internal: Bearish.
Analysis and bias remains the same as analysis dated 03 March 2023.
As mentioned in my analysis dated 28 February 2025, whereby price printed a bullish CHoCH but stated I would continue to monitor price.
On this occasion I have marked the previous bullish CHoCH in red as price did not pull back deeply enough to warrant internal structure breaks, additionally, there was minimal time spent.
Price has printed a further bullish CHoCH which is now confirmed. Price is not trading within an established internal range.
Intraday Expectation:
Price to continue bullish, react at either premium of internal 50% EQ, or M15 supply zone before targeting weak internal low priced at 2,832.720.
Note:
With the Federal Reserve maintaining a dovish stance and ongoing geopolitical tensions, volatility in Gold prices is expected to remain elevated. Traders should exercise caution, adjust risk management strategies, and stay prepared for potential price whipsaws in this high-volatility environment.
M15 Chart:

XAU/USD 05 March 2025 Intraday AnalysisH4 Analysis:
-> Swing: Bullish.
-> Internal: Bearish.
Price has printed a bullish CHoCH according to analysis and bias dated 28 February 2025.
Price is currently trading within an established internal range.
Intraday Expectation:
Price is now trading in premium of 50% internal EQ where we could see a reaction at any point. Price could also target H4 supply zone before targeting weak internal low, priced at 2,832.720
Note:
With the Federal Reserve's dovish stance and persisting geopolitical uncertainties, heightened volatility in Gold is expected to continue. Traders should proceed with caution and adjust risk management strategies in this high-volatility environment.
Price could also be driven by President Trump's policies, geopolitical moves and economic decisions which are sparking uncertainty.
H4 Chart:
M15 Analysis:
-> Swing: Bullish.
-> Internal: Bearish.
Analysis and bias remains the same as analysis dated 03 March 2023.
As mentioned in my analysis dated 28 February 2025, whereby price printed a bullish CHoCH but stated I would continue to monitor price.
On this occasion I have marked the previous bullish CHoCH in red as price did not pull back deeply enough to warrant internal structure breaks, additionally, there was minimal time spent .
Price has printed a further bullish CHoCH which is now confirmed. Price is not trading within an established internal range.
Intraday Expectation:
Price to continue bullish, react at either premium of internal 50% EQ, or M15 supply zone before targeting weak internal low priced at 2,832.720.
Note:
With the Federal Reserve maintaining a dovish stance and ongoing geopolitical tensions, volatility in Gold prices is expected to remain elevated. Traders should exercise caution, adjust risk management strategies, and stay prepared for potential price whipsaws in this high-volatility environment.
M15 Chart:

XAU/USD 04 March 2025 Intraday AnalysisH4 Analysis:
-> Swing: Bullish.
-> Internal: Bearish.
Price has printed a bullish CHoCH according to analysis and bias dated 28 February 2025.
Price is currently trading within an established internal range.
Intraday Expectation:
Price is now trading in premium of 50% internal EQ where we could see a reaction at any point. Price could also target H4 supply zone before targeting weak internal low, priced at 2,832.720
Note:
With the Federal Reserve's dovish stance and persisting geopolitical uncertainties, heightened volatility in Gold is expected to continue. Traders should proceed with caution and adjust risk management strategies in this high-volatility environment.
Price could also be driven by President Trump's policies, geopolitical moves and economic decisions which are sparking uncertainty.
H4 Chart:
M15 Analysis:
-> Swing: Bullish.
-> Internal: Bearish.
Analysis and bias remains the same as analysis dated 03 March 2023.
As mentioned in my analysis dated 28 February 2025, whereby price printed a bullish CHoCH but stated I would continue to monitor price.
On this occasion I have marked the previous bullish CHoCH in red as price did not pull back deeply enough to warrant internal structure breaks, additionally, there was minimal time spent .
Price has printed a further bullish CHoCH which is now confirmed. Price is not trading within an established internal range.
Intraday Expectation:
Price to continue bullish, react at either premium of internal 50% EQ, or M15 supply zone before targeting weak internal low priced at 2,832.720.
Note:
With the Federal Reserve maintaining a dovish stance and ongoing geopolitical tensions, volatility in Gold prices is expected to remain elevated. Traders should exercise caution, adjust risk management strategies, and stay prepared for potential price whipsaws in this high-volatility environment.
M15 Chart:

XAU/USD 03 March 2025 Intraday AnalysisH4 Analysis:
-> Swing: Bullish.
-> Internal: Bearish.
Analysis and bias remains the same as analysis dated 28 February 2025.
Price has printed a bearish iBOS as per alternative scenario mentioned over the last few weeks.
Price is now trading within an internal high and fractal low.
Bullish CHoCH positioning is marked with a blue dotted line.
Intraday Expectation:
Await for price to indicate bullish pullback phase initiation by printing a bullish CHoCH.
Note:
With the Federal Reserve's dovish stance and persisting geopolitical uncertainties, heightened volatility in Gold is expected to continue. Traders should proceed with caution and adjust risk management strategies in this high-volatility environment.
Price could also be driven by President Trump's policies, geopolitical moves and economic decisions which are sparking uncertainty.
H4 Chart:
M15 Analysis:
-> Swing: Bullish.
-> Internal: Bearish.
As mentioned in my analysis dated 28 February 2025, whereby price printed a bullish CHoCH but stated I would continue to monitor price.
On this occasion I have marked the previous bullish CHoCH in red as price did not pull back deeply enough to warrant internal structure breaks, additionally, there was minimal time spent .
Price has printed a further bullish CHoCH which is now confirmed. Price is not trading within an established internal range.
Intraday Expectation:
Price to continue bullish, react at either premium of internal 50% EQ, or M15 supply zone before targeting weak internal low priced at 2,832.720.
Note:
With the Federal Reserve maintaining a dovish stance and ongoing geopolitical tensions, volatility in Gold prices is expected to remain elevated. Traders should exercise caution, adjust risk management strategies, and stay prepared for potential price whipsaws in this high-volatility environment.
M15 Chart:

XAU/USD 28 February 2025 Intraday AnalysisH4 Analysis:
-> Swing: Bullish.
-> Internal: Bearish.
Price has printed a bearish iBOS as per alternative scenario mentioned over the last few weeks.
Price is now trading within an internal high and fractal low.
Bullish CHoCH positioning is marked with a blue dotted line.
Intraday Expectation:
Await for price to indicate bullish pullback phase initiation by printing a bullish CHoCH.
Note:
With the Federal Reserve's dovish stance and persisting geopolitical uncertainties, heightened volatility in Gold is expected to continue. Traders should proceed with caution and adjust risk management strategies in this high-volatility environment.
Price could also be driven by President Trump's policies, geopolitical moves and economic decisions which are sparking uncertainty.
H4 Chart:
M15 Analysis:
-> Swing: Bullish.
-> Internal: Bearish.
Price has printed a bearish iBOS in accordance with analysis and bias dated 26 January 2025.
You will note price has printed several bullish CHoCH's followed by bearish iBOS's, however, I have left them unmarked due to low volume candles printing erratically. This would in-turn distort internal structure.
Price has printed a further bullish CHoCH, which indicates, but does not confirm bullish pullback phase initiation, however, I will continue to monitor price action.
Intraday Expectation:
Price to continue bullish, react at either premium of internal 50% EQ, or M15 supply zone before targeting weak internal low priced at 2,851.115.
Note:
With the Federal Reserve maintaining a dovish stance and ongoing geopolitical tensions, volatility in Gold prices is expected to remain elevated. Traders should exercise caution, adjust risk management strategies, and stay prepared for potential price whipsaws in this high-volatility environment.
M15 Chart:

XAU/USD 27 January 2025 Intraday AnalysisH4 Analysis:
-> Swing: Bullish.
-> Internal: Bullish.
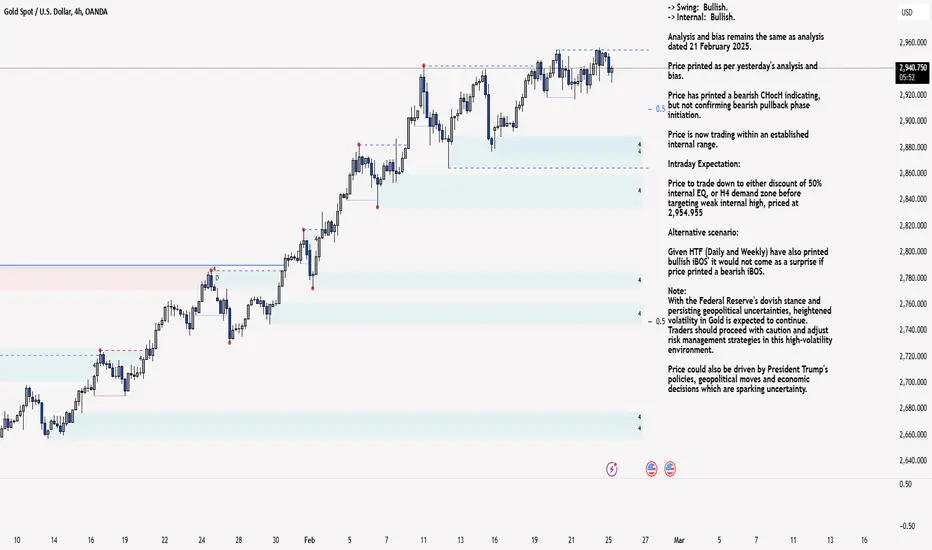
Analysis and bias remains the same as analysis dated 21 February 2025.
Price printed as per yesterday's analysis and bias.
Price has printed a bearish CHocH indicating, but not confirming bearish pullback phase initiation.
Price is now trading within an established internal range.
Intraday Expectation:
Price to trade down to either discount of 50% internal EQ, or H4 demand zone before targeting weak internal high, priced at 2,954.955
Alternative scenario:
Given HTF (Daily and Weekly) have also printed bullish iBOS' it would not come as a surprise if price printed a bearish iBOS.
Note:
With the Federal Reserve's dovish stance and persisting geopolitical uncertainties, heightened volatility in Gold is expected to continue. Traders should proceed with caution and adjust risk management strategies in this high-volatility environment.
Price could also be driven by President Trump's policies, geopolitical moves and economic decisions which are sparking uncertainty.
H4 Chart:
M15 Analysis:
-> Swing: Bullish.
-> Internal: Bearish.
Analysis and bias remains the same as yesterday's analysis dated 26 January 2025.
Price has printed as per alternative scenario analysis whereby I mentioned that as we await for H4 TF to confirm bearish pullback phase initiation, it would be a realistic expectation for price to print a bearish iBOS, which price printed.
As a result of the bearish iBOS, we now have a confirmed swing high.
Price has also printed a bearish CHoCH and traded in to premium of internal 50% EQ.
Intraday Expectation:
Technically, price should target weak internal low priced at 2,888.180.
Note:
With the Federal Reserve maintaining a dovish stance and ongoing geopolitical tensions, volatility in Gold prices is expected to remain elevated. Traders should exercise caution, adjust risk management strategies, and stay prepared for potential price whipsaws in this high-volatility environment.
M15 Chart:

XAU/USD 26 January 2025 Intraday AnalysisH4 Analysis:
-> Swing: Bullish.
-> Internal: Bullish.
Analysis and bias remains the same as analysis dated 21 February 2025.
Price printed as per yesterday's analysis and bias.
Price has printed a bearish CHocH indicating, but not confirming bearish pullback phase initiation.
Price is now trading within an established internal range.
Intraday Expectation:
Price to trade down to either discount of 50% internal EQ, or H4 demand zone before targeting weak internal high, priced at 2,954.955
Alternative scenario:
Given HTF (Daily and Weekly) have also printed bullish iBOS' it would not come as a surprise if price printed a bearish iBOS.
Note:
With the Federal Reserve's dovish stance and persisting geopolitical uncertainties, heightened volatility in Gold is expected to continue. Traders should proceed with caution and adjust risk management strategies in this high-volatility environment.
Price could also be driven by President Trump's policies, geopolitical moves and economic decisions which are sparking uncertainty.
H4 Chart:
M15 Analysis:
-> Swing: Bullish.
-> Internal: Bearish.
Price has printed as per alternative scenario analysis whereby I mentioned that as we await for H4 TF to confirm bearish pullback phase initiation, it would be a realistic expectation for price to print a bearish iBOS, which price printed.
As a result of the bearish iBOS, we now have a confirmed swing high.
Price has also printed a bearish CHoCH and traded in to premium of internal 50% EQ.
Intraday Expectation:
Technically, price should target weak internal low priced at 2,888.180.
Note:
With the Federal Reserve maintaining a dovish stance and ongoing geopolitical tensions, volatility in Gold prices is expected to remain elevated. Traders should exercise caution, adjust risk management strategies, and stay prepared for potential price whipsaws in this high-volatility environment.
M15 Chart:

XAU/USD 25 February 2025 Intraday AnalysisH4 Analysis:
-> Swing: Bullish.
-> Internal: Bullish.
Analysis and bias remains the same as analysis dated 21 February 2025.
Price printed as per yesterday's analysis and bias.
Price has printed a bearish CHocH indicating, but not confirming bearish pullback phase initiation.
Price is now trading within an established internal range.
Intraday Expectation:
Price to trade down to either discount of 50% internal EQ, or H4 demand zone before targeting weak internal high, priced at 2,954.955
Alternative scenario:
Given HTF (Daily and Weekly) have also printed bullish iBOS' it would not come as a surprise if price printed a bearish iBOS.
Note:
With the Federal Reserve's dovish stance and persisting geopolitical uncertainties, heightened volatility in Gold is expected to continue. Traders should proceed with caution and adjust risk management strategies in this high-volatility environment.
Price could also be driven by President Trump's policies, geopolitical moves and economic decisions which are sparking uncertainty.
H4 Chart:
M15 Analysis:
-> Swing: Bullish.
-> Internal: Bullish.
Analysis and bias remains the same as analysis dated 21 February 2025, however, you will note how price has targeted strong internal high without closing above.
Price printed as per analysis and bias dated 20 February 2025.
Price is now trading within an established internal range.
You will note my comments in yesterday's analysis whereby I mentioned that as we await for H4 TF to confirm bearish pullback phase initiation, it would be a realistic expectation for price to print a bearish iBOS.
This scenario seems underway, price has targeted strong internal low, however, price has, thus far, not been able to close below.
Intraday Expectation:
Technically price should target weak internal high priced at 2,954.955, however, my alternative scenario remains live.
Alternative scenario:
As we await for H4 TF to confirm bearish pullback phase initiation, it would be a realistic expectation for price to print a bearish iBOS.
Note:
With the Federal Reserve maintaining a dovish stance and ongoing geopolitical tensions, volatility in Gold prices is expected to remain elevated. Traders should exercise caution, adjust risk management strategies, and stay prepared for potential price whipsaws in this high-volatility environment.
M15 Chart:
XAU/USD 24 January 2025 Intraday AnalysisH4 Analysis:
-> Swing: Bullish.
-> Internal: Bullish.
Analysis and bias remains the same as analysis dated 21 February 2025.
Price printed as per yesterday's analysis and bias.
Price has printed a bearish CHocH indicating, but not confirming bearish pullback phase initiation.
Price is now trading within an established internal range.
Intraday Expectation:
Price to trade down to either discount of 50% internal EQ, or H4 demand zone before targeting weak internal high, priced at 2,954.955
Alternative scenario:
Given HTF (Daily and Weekly) have also printed bullish iBOS' it would not come as a surprise if price printed a bearish iBOS.
Note:
With the Federal Reserve's dovish stance and persisting geopolitical uncertainties, heightened volatility in Gold is expected to continue. Traders should proceed with caution and adjust risk management strategies in this high-volatility environment.
Price could also be driven by President Trump's policies, geopolitical moves and economic decisions which are sparking uncertainty.
H4 Chart:
M15 Analysis:
-> Swing: Bullish.
-> Internal: Bullish.
Analysis and bias remains the same as analysis dated 21 February 2025.
Price printed as per analysis and bias dated 20 February 2025.
Price is now trading within an established internal range.
You will note my comments in yesterday's analysis whereby I mentioned that as we await for H4 TF to confirm bearish pullback phase initiation, it would be a realistic expectation for price to print a bearish iBOS.
This scenario seems underway, price has targeted strong internal low, however, price has, thus far, not been able to close below.
Intraday Expectation:
Technically price should target weak internal high priced at 2,954.955, however, my alternative scenario remains live.
Alternative scenario:
As we await for H4 TF to confirm bearish pullback phase initiation, it would be a realistic expectation for price to print a bearish iBOS.
Note:
With the Federal Reserve maintaining a dovish stance and ongoing geopolitical tensions, volatility in Gold prices is expected to remain elevated. Traders should exercise caution, adjust risk management strategies, and stay prepared for potential price whipsaws in this high-volatility environment.
M15 Chart:

XAU/USD 24-28 February 2025 Weekly AnalysisWeekly Analysis:
Swing Structure -> Bullish.
Internal Structure -> Bullish.
Analysis and bias remains the same as analysis dated 09 February 2025. You will note how price has continued bullish.
Price has printed a further bullish iBOS.
Price is currently trading within an internal low and fractal high. CHoCH positioning is denoted with a blue dashed line.
Price Action Analysis:
In my analysis dated 27 October 2024, it was noted that the first sign of a pullback would be a bearish Change of Character (CHoCH), indicated by a blue dotted line. Price's consistent upward momentum had repositioned previous CHoCH much closer to recent price levels as expected for weeks. Current CHoCH positioning is quite a distance away from price, therefore, it would be viable if price continued bullish to reposition ChOCH.
Note:
It is highly unlikely price will "crash" as many analysts are predicting. My view is this is merely a corrective wave of the primary trend.
Given the Federal Reserve's dovish policy stance alongside heightened geopolitical risks, market volatility is likely to remain elevated, influencing intraday price swings.
Price could also be driven by President Trump's policies, geopolitical moves and economic decisions which are sparking uncertainty.
Weekly Chart:
Daily Analysis:
Swing -> Bullish.
Internal -> Bullish.
Analysis and bias remains the same as last week's analysis dated 16 February 2025. You will note that CHoCH positioning has been brought closer to current price action. This allows for price to not pull back so deep to indicate bearish pullback phase initiation.
Since my last weekly analysis price has printed a bullish iBOS. Bias and analysis has been accurate over the last few months.
Price is now trading within a fractal high and internal low.
Bearish ChOCH positioning is denoted with a blue shorter dotted line and is very well positioned to print bearish CHoCH which is the very first indication, but not confirmation of bearish pullback phase initiation
Note:
With the Fed maintaining a dovish policy stance and the continued rise in geopolitical tensions, we should anticipate elevated market volatility, which may impact both intraday and longer-term price action.
Price could also be driven by President Trump's policies, geopolitical moves and economic decisions which are sparking uncertainty.
Daily Chart:
H4 Analysis:
-> Swing: Bullish.
-> Internal: Bullish.
Analysis and bias remains the same as analysis dated 21 February 2025.
Price printed as per yesterday's analysis and bias.
Price has printed a bearish CHocH indicating, but not confirming bearish pullback phase initiation.
Price is now trading within an established internal range.
Intraday Expectation:
Price to trade down to either discount of 50% internal EQ, or H4 demand zone before targeting weak internal high, priced at 2,954.955
Alternative scenario:
Given HTF (Daily and Weekly) have also printed bullish iBOS' it would not come as a surprise if price printed a bearish iBOS.
Note:
With the Federal Reserve's dovish stance and persisting geopolitical uncertainties, heightened volatility in Gold is expected to continue. Traders should proceed with caution and adjust risk management strategies in this high-volatility environment.
Price could also be driven by President Trump's policies, geopolitical moves and economic decisions which are sparking uncertainty.
H4 Chart:
XAU/USD 21 February 2025 Intraday AnalysisH4 Analysis:
-> Swing: Bullish.
-> Internal: Bullish.
Price printed as per yesterday's analysis and bias.
Price has printed a bearish CHocH indicating, but not confirming bearish pullback phase initiation.
Price is now trading within an established internal range.
Intraday Expectation:
Price to trade down to either discount of 50% internal EQ, or H4 demand zone before targeting weak internal high, priced at 2,954.955
Alternative scenario:
Given HTF (Daily and Weekly) have also printed bullish iBOS' it would not come as a surprise if price printed a bearish iBOS.
Note:
With the Federal Reserve's dovish stance and persisting geopolitical uncertainties, heightened volatility in Gold is expected to continue. Traders should proceed with caution and adjust risk management strategies in this high-volatility environment.
Price could also be driven by President Trump's policies, geopolitical moves and economic decisions which are sparking uncertainty.
H4 Chart:
M15 Analysis:
-> Swing: Bullish.
-> Internal: Bullish.
Price printed as per yesterday's analysis and bias.
Price is now trading within an established internal range.
You will note my comments in yesterday's analysis whereby I mentioned that as we await for H4 TF to confirm bearish pullback phase initiation, it would be a realistic expectation for price to print a bearish iBOS.
This scenario seems underway, price has targeted strong internal low, however, price has, thus far, not been able to close below.
Intraday Expectation:
Technically price should target weak internal high priced at 2,954.955, however, my alternative scenario remains live.
Alternative scenario:
As we await for H4 TF to confirm bearish pullback phase initiation, it would be a realistic expectation for price to print a bearish iBOS.
Note:
With the Federal Reserve maintaining a dovish stance and ongoing geopolitical tensions, volatility in Gold prices is expected to remain elevated. Traders should exercise caution, adjust risk management strategies, and stay prepared for potential price whipsaws in this high-volatility environment.
M15 Chart:

XAU/USD 20 February 2025 Intraday AnalysisH4 Analysis:
-> Swing: Bullish.
-> Internal: Bullish.
Price printed as per analysis and bias dated 10 February 2025.
Price has printed a bullish iBOS.
Price is currently trading within an internal low and fractal high.
Intraday Expectation:
Price to indicate bearish pullback phase initiation by printing bearish CHoCH.
Bearish CHoCH is denoted with a blue dotted line.
Alternative scenario:
Given HTF (Daily and Weekly) have also printed bullish iBOS' it would not come as a surprise if price printed a bearish iBOS.
Note:
With the Federal Reserve's dovish stance and persisting geopolitical uncertainties, heightened volatility in Gold is expected to continue. Traders should proceed with caution and adjust risk management strategies in this high-volatility environment.
Price could also be driven by President Trump's policies, geopolitical moves and economic decisions which are sparking uncertainty.
H4 Chart:
M15 Analysis:
-> Swing: Bullish.
-> Internal: Bullish.
Price printed as per analysis and bias dated 11 February 2025.
Price has printed a double bullish iBOS.
You will note the most recent bullish iBOS followed by a bearish CHoCH despite price not tapping in to discount of 50% internal EQ or M15 demand zone. I will consider this a bullish iBOS due to time spent, however, I will continue to monitor.
Intraday Expectation:
Await for price indicate bearish pullback phase initiation and print bearish ChOCH.
CHoCH positioning is denoted with a blue dotted line.
Alternative scenario:
As we await for H4 TF to confirm bearish pullback phase initiation, it would be a realistic expectation for price to print a bearish iBOS.
Note:
With the Federal Reserve maintaining a dovish stance and ongoing geopolitical tensions, volatility in Gold prices is expected to remain elevated. Traders should exercise caution, adjust risk management strategies, and stay prepared for potential price whipsaws in this high-volatility environment.
M15 Chart:

XAU/USD 19 February 2025 Intraday AnalysisH4 Analysis:
-> Swing: Bullish.
-> Internal: Bullish.
Analysis and bias remains the same as analysis dated 11 February 2025.
As mentioned in analysis dated 10 February 2025 that it is highly likely price will print a bullish iBOS is how price printed.
Price is currently trading within an internal low and fractal high.
ChoCH positioning to indicate, but not confirm bearish pullback phase initiation is denoted with a blue dotted line.
Intraday Expectation:
Price to continue bearish and react at either discount of internal 50%, or H4 demand zone, before targeting weak internal high, priced at 2,942.780.
Alternative scenario:
Given HTF (Daily and Weekly) have also printed bullish iBOS' it would not come as a surprise if price printed a bearish iBOS.
Note:
With the Federal Reserve's dovish stance and persisting geopolitical uncertainties, heightened volatility in Gold is expected to continue. Traders should proceed with caution and adjust risk management strategies in this high-volatility environment.
Price could also be driven by President Trump's policies, geopolitical moves and economic decisions which are sparking uncertainty.
H4 Chart:
M15 Analysis:
-> Swing: Bullish.
-> Internal: Bullish.
Analysis and bias remains the same as analysis dated 11 February 2025.
Price printed as per yesterday's analysis whereby it was mentioned price to print bearish CHoCH to indicate bearish pullback phase initiation.
Price is now trading within an established internal range.
Intraday Expectation:
Price to trade down to either discount of 50% internal EQ or nested H4/M15 demand zone before targeting weak internal high priced at 2,942.780.
Alternative Scenario:
As all HTF's are in bearish pullback phase it would be viable if price targeted strong internal low, printing a bearish iBOS.
Note:
With the Federal Reserve maintaining a dovish stance and ongoing geopolitical tensions, volatility in Gold prices is expected to remain elevated. Traders should exercise caution, adjust risk management strategies, and stay prepared for potential price whipsaws in this high-volatility environment.
M15 Chart:

XAU/USD 18 February 2025 Intraday AnalysisH4 Analysis:
-> Swing: Bullish.
-> Internal: Bullish.
Analysis and bias remains the same as analysis dated 11 February 2025.
As mentioned in analysis dated 10 February 2025 that it is highly likely price will print a bullish iBOS is how price printed.
Price is currently trading within an internal low and fractal high.
ChoCH positioning to indicate, but not confirm bearish pullback phase initiation is denoted with a blue dotted line.
Intraday Expectation:
Price to continue bearish and react at either discount of internal 50%, or H4 demand zone, before targeting weak internal high, priced at 2,942.780.
Alternative scenario:
Given HTF (Daily and Weekly) have also printed bullish iBOS' it would not come as a surprise if price printed a bearish iBOS.
Note:
With the Federal Reserve's dovish stance and persisting geopolitical uncertainties, heightened volatility in Gold is expected to continue. Traders should proceed with caution and adjust risk management strategies in this high-volatility environment.
Price could also be driven by President Trump's policies, geopolitical moves and economic decisions which are sparking uncertainty.
H4 Chart:
H15 Analysis:
-> Swing: Bullish.
-> Internal: Bullish.
Analysis and bias remains the same as analysis dated 11 February 2025.
Price printed as per yesterday's analysis whereby it was mentioned price to print bearish CHoCH to indicate bearish pullback phase initiation.
Price is now trading within an established internal range.
Intraday Expectation:
Price to trade down to either discount of 50% internal EQ or nested H4/M15 demand zone before targeting weak internal high priced at 2,942.780.
Alternative Scenario:
As all HTF's are in bearish pullback phase it would be viable if price targeted strong internal low, printing a bearish iBOS.
Note:
With the Federal Reserve maintaining a dovish stance and ongoing geopolitical tensions, volatility in Gold prices is expected to remain elevated. Traders should exercise caution, adjust risk management strategies, and stay prepared for potential price whipsaws in this high-volatility environment.
M15 Chart:

XAU/USD 17 February 2025 Intraday AnalysisH4 Analysis:
-> Swing: Bullish.
-> Internal: Bullish.
Analysis and bias remains the same as analysis dated 11 February 2025.
As mentioned in yesterday's analysis dated 10 February 2025 that it is highly likely price will print a bullish iBOS is how price printed.
Price is currently trading within an internal low and fractal high.
ChoCH positioning to indicate, but not confirm bearish pullback phase initiation is denoted with a blue dotted line.
Intraday Expectation:
Price to continue bearish and react at either discount of internal 50%, or H4 demand zone, before targeting weak internal high, priced at 2,942.780.
Alternative scenario:
Given HTF (Daily and Weekly) have also printed bullish iBOS' it would not come as a surprise if price printed a bearish iBOS.
Note:
With the Federal Reserve's dovish stance and persisting geopolitical uncertainties, heightened volatility in Gold is expected to continue. Traders should proceed with caution and adjust risk management strategies in this high-volatility environment.
Price could also be driven by President Trump's policies, geopolitical moves and economic decisions which are sparking uncertainty.
H4 Chart:
M15 Analysis:
-> Swing: Bullish.
-> Internal: Bullish.
Analysis and bias remains the same as analysis dated 11 February 2025.
Price printed as per yesterday's analysis whereby it was mentioned price to print bearish CHoCH to indicate bearish pullback phase initiation.
Price is now trading within an established internal range.
Intraday Expectation:
Price to trade down to either discount of 50% internal EQ or nested H4/M15 demand zone before targeting weak internal high priced at 2,942.780.
Alternative Scenario:
As all HTF's are in bearish pullback phase it would be viable if price targeted strong internal low, printing a bearish iBOS.
Note:
With the Federal Reserve maintaining a dovish stance and ongoing geopolitical tensions, volatility in Gold prices is expected to remain elevated. Traders should exercise caution, adjust risk management strategies, and stay prepared for potential price whipsaws in this high-volatility environment.
M15 Chart:

XAU/USD 17-21 February 2025 Weekly AnalysisWeekly Analysis:
Swing Structure -> Bullish.
Internal Structure -> Bullish.
Analysis and bias remains the same as analysis dated 09 February 2025.
Price has printed a further bullish iBOS.
Price is currently trading within an internal low and fractal high. CHoCH positioning is denoted with a blue dashed line.
Price Action Analysis:
In my analysis dated 27 October 2024, it was noted that the first sign of a pullback would be a bearish Change of Character (CHoCH), indicated by a blue dotted line. Price's consistent upward momentum had repositioned previous CHoCH much closer to recent price levels as expected for weeks. Current CHoCH positioning is quite a distance away from price, therefore, it would be viable if price continued bullish to reposition ChOCH.
Note:
It is highly unlikely price will "crash" as many analysts are predicting. My view is this is merely a corrective wave of the primary trend.
Given the Federal Reserve's dovish policy stance alongside heightened geopolitical risks, market volatility is likely to remain elevated, influencing intraday price swings.
Price could also be driven by President Trump's policies, geopolitical moves and economic decisions which are sparking uncertainty.
Weekly Chart:
Daily Analysis:
Swing -> Bullish.
Internal -> Bullish.
Since my last weekly analysis price has printed a bullish iBOS. Bias and analysis has been accurate over the last few months.
Price is now trading within a fractal high and internal low.
Bearish ChOCH positioning is denoted with a blue shorter dotted line and is very well positioned to print bearish CHoCH which is the very first indication, but not confirmation of bearish pullback phase initiation
Note:
With the Fed maintaining a dovish policy stance and the continued rise in geopolitical tensions, we should anticipate elevated market volatility, which may impact both intraday and longer-term price action.
Price could also be driven by President Trump's policies, geopolitical moves and economic decisions which are sparking uncertainty.
Daily Chart:
H4 Analysis:
-> Swing: Bullish.
-> Internal: Bullish.
Analysis and bias remains the same as analysis dated 11 February 2025.
As mentioned in yesterday's analysis dated 10 February 2025 that it is highly likely price will print a bullish iBOS is how price printed.
Price is currently trading within an internal low and fractal high.
ChoCH positioning to indicate, but not confirm bearish pullback phase initiation is denoted with a blue dotted line.
Intraday Expectation:
Price to continue bearish and react at either discount of internal 50%, or H4 demand zone, before targeting weak internal high, priced at 2,942.780.
Alternative scenario:
Given HTF (Daily and Weekly) have also printed bullish iBOS' it would not come as a surprise if price printed a bearish iBOS.
Note:
With the Federal Reserve's dovish stance and persisting geopolitical uncertainties, heightened volatility in Gold is expected to continue. Traders should proceed with caution and adjust risk management strategies in this high-volatility environment.
Price could also be driven by President Trump's policies, geopolitical moves and economic decisions which are sparking uncertainty.
H4 Chart:

XAU/USD 14 February 2025 Intraday AnalysisH4 Analysis:
-> Swing: Bullish.
-> Internal: Bullish.
Analysis and bias remains the same as analysis dated 11 February 2025.
As mentioned in yesterday's analysis dated 10 February 2025 that it is highly likely price will print a bullish iBOS is how price printed.
Price is currently trading within an internal low and fractal high.
ChoCH positioning to indicate, but not confirm bearish pullback phase initiation is denoted with a blue dotted line.
Intraday Expectation:
Price to continue bearish and react at either discount of internal 50%, or H4 demand zone, before targeting weak internal high, priced at 2,942.780.
Alternative scenario:
Given HTF (Daily and Weekly) have also printed bullish iBOS' it would not come as a surprise if price printed a bearish iBOS.
Note:
With the Federal Reserve's dovish stance and persisting geopolitical uncertainties, heightened volatility in Gold is expected to continue. Traders should proceed with caution and adjust risk management strategies in this high-volatility environment.
Price could also be driven by President Trump's policies, geopolitical moves and economic decisions which are sparking uncertainty.
H4 Chart:
M15 Analysis:
-> Swing: Bullish.
-> Internal: Bullish.
Analysis and bias remains the same as analysis dated 11 February 2025.
Price printed as per yesterday's analysis whereby it was mentioned price to print bearish CHoCH to indicate bearish pullback phase initiation.
Price is now trading within an established internal range.
Intraday Expectation:
Price to trade down to either discount of 50% internal EQ or nested H4/M15 demand zone before targeting weak internal high priced at 2,942.780.
Alternative Scenario:
As all HTF's are in bearish pullback phase it would be viable if price targeted strong internal low, printing a bearish iBOS.
Note:
With the Federal Reserve maintaining a dovish stance and ongoing geopolitical tensions, volatility in Gold prices is expected to remain elevated. Traders should exercise caution, adjust risk management strategies, and stay prepared for potential price whipsaws in this high-volatility environment.
M15 Chart:

XAU/USD 13 February 2025 Intraday AnalysisH4 Analysis:
-> Swing: Bullish.
-> Internal: Bullish.
Analysis and bias remains the same as analysis dated 11 February 2025.
As mentioned in yesterday's analysis dated 10 February 2025 that it is highly likely price will print a bullish iBOS is how price printed.
Price is currently trading within an internal low and fractal high.
ChoCH positioning to indicate, but not confirm bearish pullback phase initiation is denoted with a blue dotted line.
Intraday Expectation:
Price to continue bearish and react at either discount of internal 50%, or H4 demand zone, before targeting weak internal high, priced at 2,942.780.
Alternative scenario:
Given HTF (Daily and Weekly) have also printed bullish iBOS' it would not come as a surprise if price printed a bearish iBOS.
Note:
With the Federal Reserve's dovish stance and persisting geopolitical uncertainties, heightened volatility in Gold is expected to continue. Traders should proceed with caution and adjust risk management strategies in this high-volatility environment.
Price could also be driven by President Trump's policies, geopolitical moves and economic decisions which are sparking uncertainty.
H4 Chart:
M15 Analysis:
-> Swing: Bullish.
-> Internal: Bullish.
Analysis and bias remains the same as analysis dated 11 February 2025.
Price printed as per yesterday's analysis whereby it was mentioned price to print bearish CHoCH to indicate bearish pullback phase initiation.
Price is now trading within an established internal range.
Intraday Expectation:
Price to trade down to either discount of 50% internal EQ or nested H4/M15 demand zone before targeting weak internal high priced at 2,942.780.
Alternative Scenario:
As all HTF's are in bearish pullback phase it would be viable if price targeted strong internal low, printing a bearish iBOS.
Note:
With the Federal Reserve maintaining a dovish stance and ongoing geopolitical tensions, volatility in Gold prices is expected to remain elevated. Traders should exercise caution, adjust risk management strategies, and stay prepared for potential price whipsaws in this high-volatility environment.
M15 Chart:

XAU/USD 11 February 2025 Intraday AnalysisH4 Analysis:
-> Swing: Bullish.
-> Internal: Bullish.
As mentioned in yesterday's analysis dated 10 February 2025 that it is highly likely price will print a bullish iBOS is how price printed.
Price is currently trading within an internal low and fractal high.
ChoCH positioning to indicate, but not confirm bearish pullback phase initiation is denoted with a blue dotted line.
Intraday Expectation:
Price to continue bearish and react at either discount of internal 50%, or H4 demand zone, before targeting weak internal high, priced at 2,942.780.
Alternative scenario:
Given HTF (Daily and Weekly) have also printed bullish iBOS' it would not come as a surprise if price printed a bearish iBOS.
Note:
With the Federal Reserve's dovish stance and persisting geopolitical uncertainties, heightened volatility in Gold is expected to continue. Traders should proceed with caution and adjust risk management strategies in this high-volatility environment.
Price could also be driven by President Trump's policies, geopolitical moves and economic decisions which are sparking uncertainty.
H4 Chart:
M15 Analysis:
-> Swing: Bullish.
-> Internal: Bullish.
Price printed as per yesterday's analysis whereby it was mentioned price to print bearish CHoCH to indicate bearish pullback phase initiation.
Price is now trading within an established internal range.
Intraday Expectation:
Price to trade down to either discount of 50% internal EQ or nested H4/M15 demand zone before targeting weak internal high priced at 2,942.780.
Alternative Scenario:
As all HTF's are in bearish pullback phase it would be viable if price targeted strong internal low, printing a bearish iBOS.
Note:
With the Federal Reserve maintaining a dovish stance and ongoing geopolitical tensions, volatility in Gold prices is expected to remain elevated. Traders should exercise caution, adjust risk management strategies, and stay prepared for potential price whipsaws in this high-volatility environment.
M15 Chart :
