XAU/USD Breakout Playbook – Rob the Market!🚨💰 GOLD HEIST IN MOTION! | XAU/USD Thief Trading Strategy (Breakout Edition) 🏴☠️
🧠 Strategic Mindset | Not Your Average Chart Talk
Yo Market Bandits & Pip Hunters – welcome to the underground playbook!
This isn't your grandma’s chart breakdown – it’s a Thief Trading Takedown on XAU/USD (Gold), where we’re not chasing the market… we’re outsmarting it.
THE MASTER PLAN: Enter Like a Ghost, Exit Like a King 👑
📍 ENTRY POINT – The Break-In Begins!
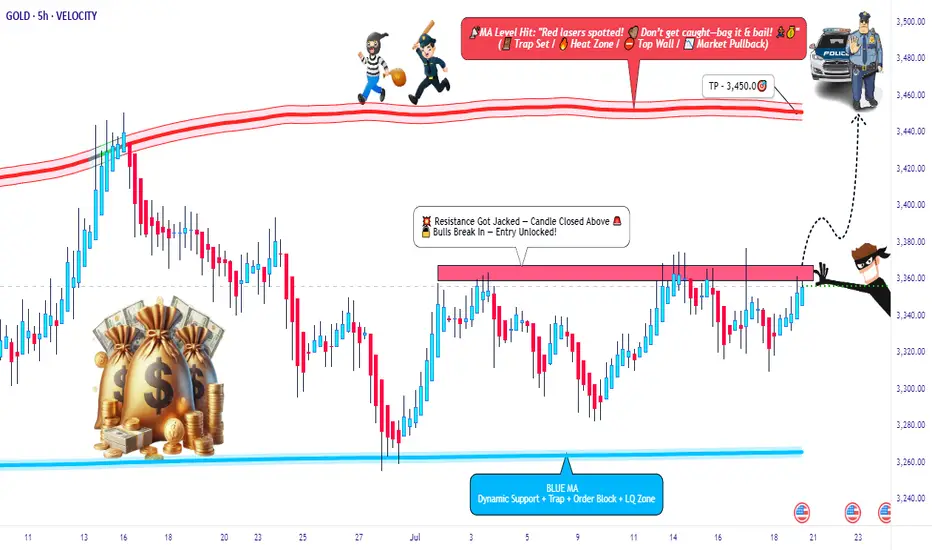
💥 Breakout Level: Watch for 3370.00 resistance to crack – this is our green light.
🕵️♂️ Entry Style:
• Buy Stop above MA resistance zone (fast & clean)
• OR Buy Limit near swing low zones after confirmation pullback (sniper entry)
🧠 Thief Tip: Wait for the breakout to happen. No orders, no SL before it. Patience is profit.
🔄 Layer the Entry:
• Deploy DCA (Dollar Cost Averaging) or scaling entries with precision
• Build positions like stacking cash bags — smart, silent, and calculated
🛡️ PROTECT THE LOOT – Stop Loss Logic 💣
📍 SL Guide: 3310.00 (4H swing low – update as price structure evolves)
🔥 SL ONLY comes after breakout. Set it too early? That’s how you get caught.
⛔ No pre-breakout orders. No early SL. Stay invisible till it's go time.
🎯 THE ESCAPE – Profit Like a Phantom 🚀
💸 Take Profit: 3450.00
📉 Scalpers: Trail SL as price pushes – never give back stolen pips
🌀 Swing Traders: Monitor resistance layers – don’t let the bulls turn on you
🧭 CONTEXT – Why This Setup?
🔍 Macro Snapshot:
• Trend: Neutral/Bullish Lean
• Influencers: COT reports, geopolitical tension, dollar flows
• Sentiment Shifting – watch the herd, but don’t run with it
🗞️ News Risk: Don’t get wrecked by events! Avoid entries during high-impact news.
🚨 Trailing SL is your best weapon during volatility.
⚡ POWER UP THE CREW – Support the Movement
💬 Drop a comment, hit the 🔥 like button, and share with your trading gang
More Thief Trading blueprints coming soon – bigger breakouts, cleaner setups
⚠️ STAY SHARP, THIEVES!
This ain't financial advice – it’s an outlaw’s edge on the market.
Trade smart. Risk well. Protect the bag.
🏴☠️ XAU/USD GOLD HEIST IN PROGRESS... Join the Movement. Let’s Rob the Market.
Xauusdprediction
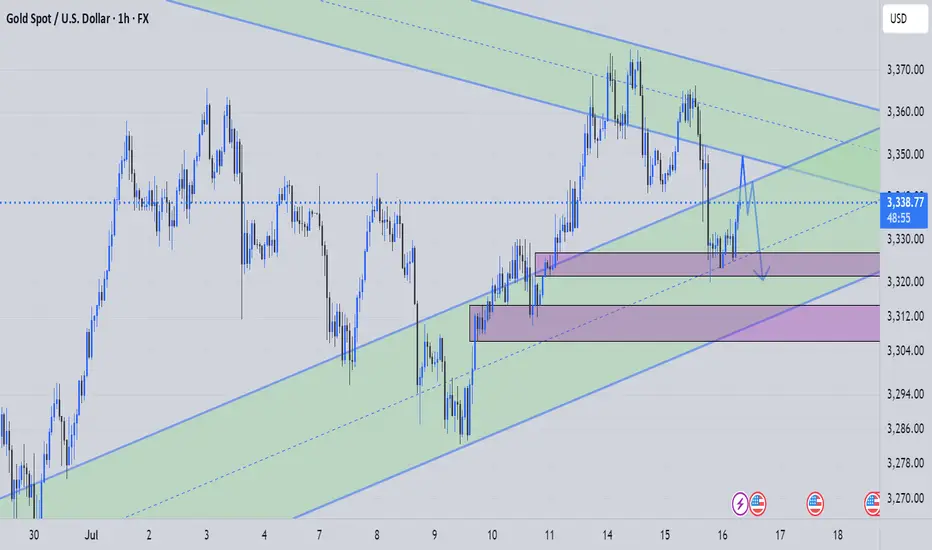
XAUUSD (1H Time frame) Read the captionXAU/USD Analysis (1H Timeframe )
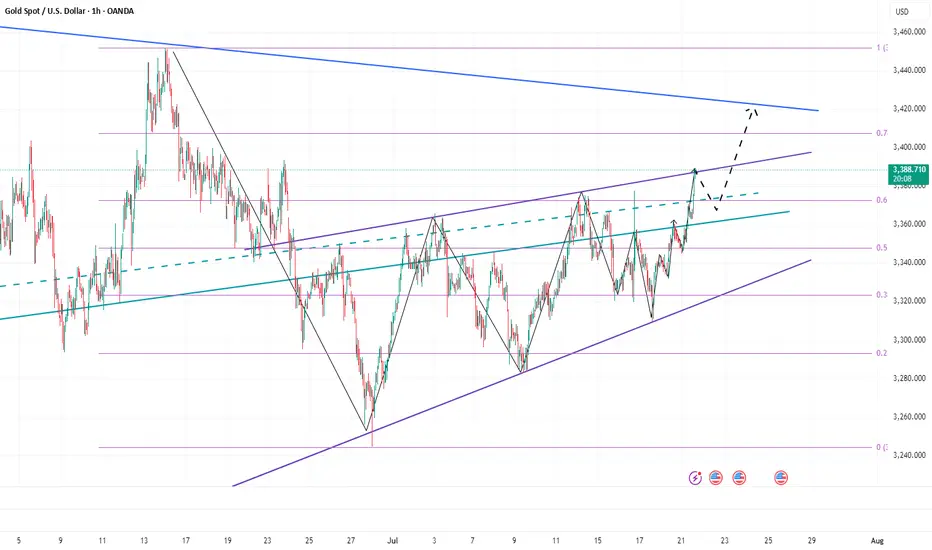
This chart represents the XAU/USD (Gold vs US Dollar) price movement on a 1-hour timeframe, showcasing a well-defined ascending channel. The analysis highlights three critical zones:
1. Resistance Level (Upper Blue Zone):
This zone, located around the $3,440 - $3,450 range, marks the potential upper limit of the current bullish channel. A breakout above this level could indicate strong bullish momentum continuation.
2. Key Support Breakout Zone (Middle Purple Zone):
Around the $3,390 - $3,400 range, this area previously acted as resistance and now serves as a key support level. A price retest and bounce from this zone could confirm it as a new support base, potentially triggering a move toward the resistance zone again.
3. Support Level (Lower Purple Zone):
Found near the $3,320 level, this is the broader trendline and horizontal support zone that would be critical if the price breaks below the key support area. It acts as a major demand zone within the ascending channel.
Observations:
The price is currently in a strong uptrend within the rising channel.
A retest of the key support breakout zone is anticipated before potentially pushing higher toward resistance.
A breakdown below the key support could trigger a move toward the lower support level.
Technical Bias:
Bullish as long as the price remains above the key support level.
Bearish reversal may occur on a confirmed breakdown below the ascending channel and lower support zone.

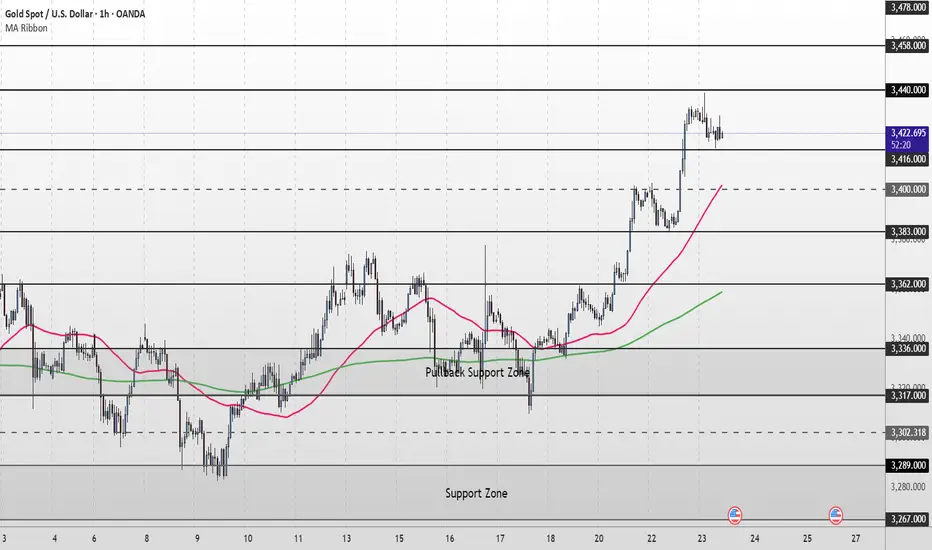
XAU/USD Intraday Plan | Support & Resistance to WatchGold has continued its rally, breaking through the 3,416 resistance and pushing into the next upside zone.
Price is now trading around 3,421, just below the 3,440 resistance cluster.
The structure remains bullish with price holding firmly above both the 50MA and 200MA, which are acting as dynamic support.
A confirmed break and hold above 3,440 would open the path toward 3,458 and potentially the higher‑timeframe target at 3,478 if momentum extends.
If price fails to sustain above 3,416–3,440 and begins to fade, watch the initial pullback toward 3,400.
A deeper move below that would shift focus to 3,383 - 3,362 and then the Pullback Support Zone.
Failure to hold there could expose price to the lower Support Zone if bearish pressure builds.
📌 Key Levels to Watch
Resistance:
‣ 3,440
‣ 3,458
‣ 3,478
Support:
‣ 3,416
‣ 3,400
‣ 3,383
‣ 3,362
‣ 3,336
🔎 Fundamental Focus
⚠️Not much on the calendar today. Still, manage your risk and stay prepared for any unexpected volatility.
Warning Signs After Gold’s Sharp Rise — Is a Pullback Coming?Today, gold rebounded from around 3345, and has now rebounded to around 3389, which is only one step away from the 3400 mark. Gold has hardly retreated during the rise, and the rise is strong. However, we can see from the small-level candle chart that gold suddenly accelerated its rise after consolidating around 3365, and continued to around 3390, and is now oscillating near the recent high trend line.
After gold accelerated its rise and oscillated near the recent high trend line, this made me have to be more cautious, because we must be careful that the acceleration of gold's rise in the short term is a trap for buyers, so even if we are bullish on gold in the short term, we should not directly chase gold at a high level; according to the current structure of gold, I think it is necessary for gold to retest the 3370-3360 area support before continuing to rise and hitting 3400. Only after verifying that the support in this area is effective can it be conducive to a better rise in gold!
So for short-term trading, I think we can still try to short gold now, and then wait patiently for gold to retest the 3370-3360 area.
Xauusd Bullish 18 July 2025 $4085 Prediction📍Kuala Lumpur, Malaysia – 18 July 2025
GOLD (XAUUSD) INSIGHT – First Accumulation Entry Begins
Today marks the first leg of bullish territory for Gold (XAUUSD) as price begins its early accumulation phase ahead of the Federal Reserve’s rate decision in 11 days. Using a refined OHLC strategy alongside my proprietary Chrono Conditioned Trading (CCT) method, I foresee a strategic retest around $3357 to $3360, which could unlock the momentum needed to approach $3400 and eventually $3500 a key psychological resistance before price makes its way to the $5000 projection.
🧠 Technical Insight: OHLC Strategy
The OHLC (Open-High-Low-Close) method is vital for identifying precision entries:
Open shows the market’s first reaction;
High and Low define intraday volatility boundaries;
Close indicates market sentiment and real direction.
In today's setup, early accumulation begins near the previous daily open, and a break above yesterday's high signals that buyers are returning in strength.
⏱ CCT – Chrono Conditioned Trading Approach
My CCT method focuses on timing-based entries combined with price conditioning:
Entries are planned around event timelines like the upcoming FOMC rate release (FedWatch).
CCT waits for the “right time and right structure” not just price but when price moves.
Today fits that condition: early cycle, pre-news sentiment, and a clean OHLC break structure.
💡 Trading Tip:
“Never chase gold. Let the structure and time align. When OHLC confirms and CCT conditions are met only then, you strike.”
🗓 Fed Expectations:
Although rate cuts are projected for September and December 2025, it is unlikely the Fed will move in July. That uncertainty fuels speculative accumulation—making today a strategic entry point.
Stay sharp. Watch for OHLC rejections or continuation signals above $3360.
If bulls defend $3357 well, gold may reclaim the $3400 range soon setting the stage for the ultimate test at $3500.
#XAUUSD #GoldTrading #OHLCstrategy #ChronoConditionedTrading #FedWatch #GoldAnalysis #CCTMethod
Regards,
Zezu Zaza
2048

Gold Analysis – Why I’m Targeting $4,085Friday July 18 2025. Malaysia, Kuala Lumpur - Gold analysis done by Zezu Zaza to see the potential upcoming upside starting today this Friday.
I am using a CCT (Chrono Conditioned Trading) technique for my trading based analysis with mathematical strategy in the Xauusd pricing. We will cover the technical, fundamental and sentiment aspect as these are the three components pillars in trading before making any decision and movement trend.
1. Technical Setup (Daily Chart)
Gold is currently consolidating between the $3,300 to $3,375 range after a strong rally earlier this year.
The RSI sits near the neutral 50 level, while the MACD shows signs of a potential bullish crossover.
A confirmed breakout above the $3,375 to $3,400 resistance zone may lead to a surge toward $3,600 to $3,650, and possibly much higher.
Market structure remains bullish, with higher lows forming a solid base around $3,300.
2. Federal Reserve Outlook – 2025 Rate Cuts Expected
The market is now pricing in at least two interest rate cuts from the Federal Reserve by the end of 2025. A 25 basis point cut is expected in September, with another potentially coming in December. Recent CPI and PPI data indicate cooling inflation, giving the Fed more room to ease without reigniting price pressure. Labor market strength is weakening, wage growth is decelerating, and tighter credit conditions are emerging. Fed Chair Jerome Powell recently stated that the risks of over-tightening are now balanced, signaling a shift to a more dovish stance. Lower interest rates reduce bond yields and weaken the dollar, which historically fuels gold’s bullish momentum. If trump fired or Powell decision to step down, this will fire the gold even higher for the catalyze.
3. Market Sentiment (Speculative Positioning)
As of July 11, 2025, the latest CFTC Commitment of Traders report shows speculative net long positions on gold have surged to 203,000 contracts, the highest level in several months.
This signals a strong bullish sentiment among hedge funds and large traders.
In addition, gold ETFs saw over $38 billion in inflows in the first half of 2025, highlighting strong institutional demand as investors seek safety in uncertain times.
The positioning supports further upside as traders bet on a softer dollar and increased market volatility.
4. Macro Fundamentals and Hedge Fund Sentiment
Central banks around the world, especially in the BRICS nations, continue to increase their gold reserves in efforts to reduce reliance on the US dollar.
China has been actively accumulating gold for more than eight consecutive months, with unofficial estimates suggesting holdings of up to 5,000 metric tons.
Several hedge funds and institutional managers now classify gold as a core asset class due to rising fiscal uncertainty, geopolitical risk, and the deterioration of confidence in monetary policy. David Einhorn of Greenlight Capital emphasized that gold is not just about inflation but about the credibility of monetary and fiscal policies. His fund maintains a long gold position and expects higher prices as global deficits and structural imbalances persist.
5. Institutional Forecasts and Speculator Targets
Goldman Sachs has raised its end-of-2025 target to the $3,700 to $3,950 range, citing rising ETF inflows and a softer Fed stance. JPMorgan expects gold to average around $3,675 in the fourth quarter of 2025. Citi, in a bull case scenario, believes gold could trade well above $3,300. The World Gold Council has outlined a high-conviction scenario in which gold could reach $4,000 within the next six to nine months, driven by stagflation and global monetary instability. Greenlight Capital is reportedly aiming for the $3,500 to $3,800 range, though David Einhorn noted that he does not want prices to rise excessively too quickly.
Target Price: $4,085 first before turn the bullish sooners to $5000 price make this same year.
My target of $4,085 is supported by the convergence of multiple factors:
- A bullish technical structure with a potential breakout
- Fed interest rate cuts reducing yields and weakening the dollar. Fed will reduce the rates for the first time this year (12 more days) after this article is published today 18 July 2025.
- Strong speculative positioning and ETF demand
- Aggressive central bank accumulation
- Hedge fund sentiment aligned with rising gold exposure
- Persistent geopolitical and macroeconomic uncertainty
If these conditions hold, $4,085 is a realistic medium-term objective within six to nine months.
Trading Plan Summary
Component Strategy
Entry Zone Breakout above $3,375
Stop Loss $3,300 to $3,320 (below key support)
Take Profit Partial at $3,600 to $3,650, trail remainder to $4,085
Risk Triggers Dollar strength, unexpected Fed hawkish turn, resolution in geopolitics
Key Catalysts CPI done, PPI done, FOMC statements, nonfarm payrolls, war developments
Final Takeaway
This gold analysis blends a bullish technical pattern with the macroeconomic backdrop of an approaching Fed pivot, rising speculative positioning, and ongoing central bank purchases.
Hedge funds and institutions are increasingly viewing gold as an essential defensive asset, especially in the face of deteriorating fiscal credibility and geopolitical tensions.
If gold breaks and holds above the $3,375 level, the path toward $4,085 becomes significantly more probable.
18 July 2025 Friday is a starter ignition trend will born today. I will place some test lots today and will accumulate after from time to time.
Let me know if you what is your opinion or send email to me to reach me for the insitutional analyst or want to see live trade.
Regards,
Zezu Zaza
2048
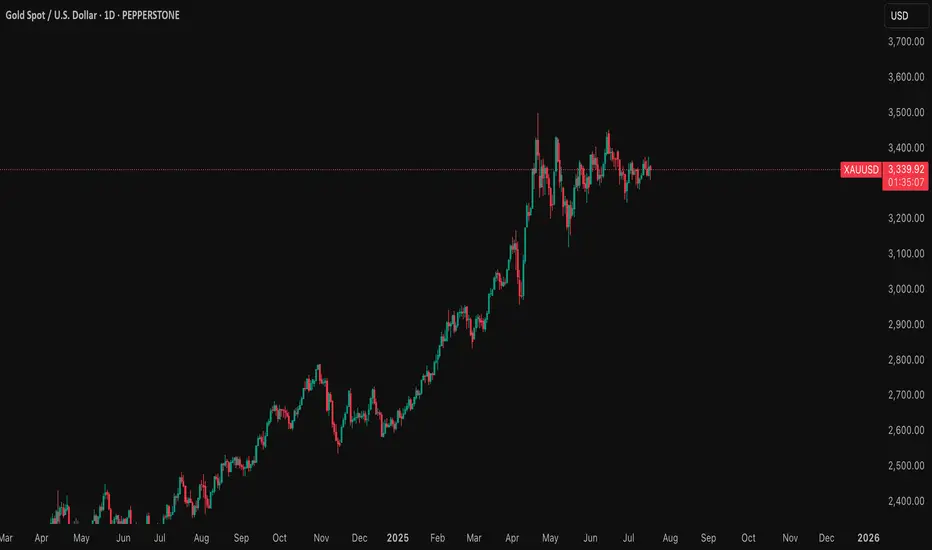
Expectations On GoldPEPPERSTONE:XAUUSD Looking at the daily Range, The market has reached the equilibrium level, is that a sign to go short? no, we could still see a drive to the upper side, but ultimately, the relative equal lows which are close to 3,245.00 big figure should likely be the draw.
I would love to see a drive below the 3,282.00 mark for perfect show to prove the obvious move below the 3,245.00, or seeing a consecutive break below each previous days low would also confirm the directive.
Seeing higher prices would of course negate this analysis, seeing a run into the 3,375.00 big figure yesterday makes me skeptical as this has also left some area of relatively equal highs, so I would give in to the idea of higher prices at least to that level to see what would like occur, but I strongly doubt that this would be the scenerio.
Generally, I am bearish on Gold till I see a run below that 3,245.00 big figure or prices closer to that level.

xauusd setup"🌟 Welcome to Golden Candle! 🌟
We're a team of 📈 passionate traders 📉 who love sharing our 🔍 technical analysis insights 🔎 with the TradingView community. 🌎
Our goal is to provide 💡 valuable perspectives 💡 on market trends and patterns, but 🚫 please note that our analyses are not intended as buy or sell recommendations. 🚫
Instead, they reflect our own 💭 personal attitudes and thoughts. 💭
Follow along and 📚 learn 📚 from our analyses! 📊💡"
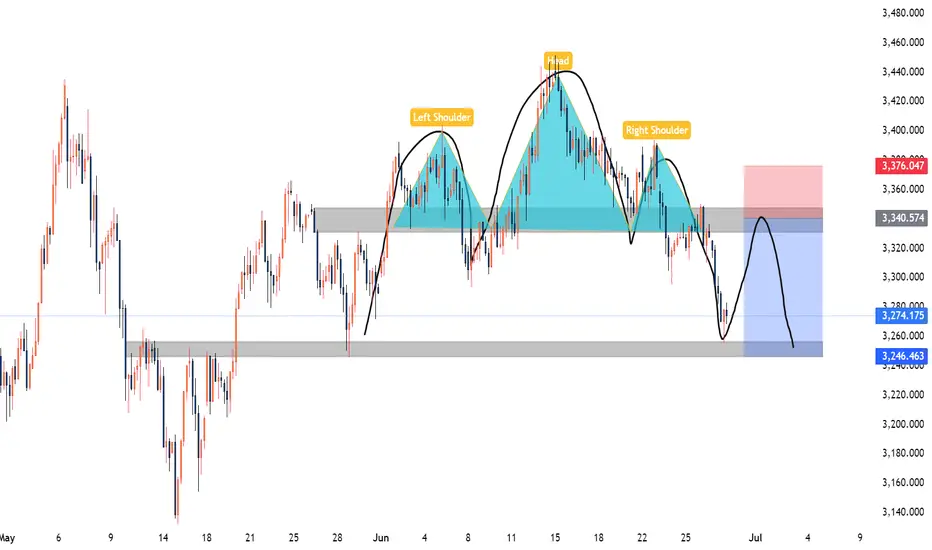
XAUUSD Weekly Analysis 30 June 4 July 2025Gold has formed a Head and Shoulders (H&S) pattern on the H4 timeframe. While the pattern is not perfectly symmetrical, it is still valid and clearly recognizable. The price has broken below the neckline, confirming a potential shift in market structure to the downside.
Analysis Insight:
The 3340–3350 area, previously a support zone, is now acting as resistance following the neckline break. A pullback to this zone may present a high-probability short opportunity for swing traders, especially if price shows rejection or bearish structure in that zone.
Trade Type: Swing
Trade Setup – Sell on Retracement:
Bias: Bearish on confirmation of retracement rejection
Entry Zone: 3340 – 3350
Stop Loss: 3376 (above right shoulder/high)
Take Profit: 3320/3300/3285/3260
Risk-Reward Ratio: Approximately 1:2
Kindly follow, share, like, support and comment.
Trade Idea: XAUUSD Short (SELL LIMIT) 1. Trend Alignment: H1 shows a clear down-trend — lower highs at 3446 → 3397 → 3347. SMAs on H1/M15 have turned down.
2. High-Probability Pullback: Price has broken the 3340 support twice and pulled back. Resistance here is offering a tight stop and plenty of room to TP.
3. Structural SL: Stop sits just above the prior swing high (~3350–3352)
Entry
Sell Limit @ 3340.37
Prior day low (now resistance) on H1 & M15
Stop Loss
3352.00
Just above the swing high around 3350–3351
Take Profit
3293.07
Invalidation
15 min candle close < 3310
Time Expiry
8:30 AM PST
Cancel if not triggered by then
FUSIONMARKETS:XAUUSD

Trade Idea: Long XAUUSD (BUY STOP)1️⃣ Multi-Timeframe Structure
• 1 Hour (Macro):
• Trend: Bullish. 20 SMA is riding above the 50 SMA .
• Price has broken above the prior resistance at 3374.50 and is now retesting it as support.
• 15 Minute (Tactical):
• After a clear push down into 3340.37, price rallied back above 3374.50.
• SMAs have flipped back bullish, and volume during the retest shows absorption of selling pressure.
• 3 Minute (Entry Precision):
• Micro-green candle wicks show a small scratch of buyers stepping in just above 3374.50.
• Momentum is picking up to the upside, but we want confirmation of strength before committing.
⸻
2️⃣ Trade Execution
▶️ Entry: Buy Stop at 3379.50
• Wait for a clean 3 m/15 m push above the short-term swing high (~3379) to confirm buyers are in control.
✂️ Stop Loss: 3374.50
• Just below the broken resistance-turned-support level.
• True structural invalidation of this bullish thesis.
🎯 Take Profit: 3394.50
• Targets the next logical resistance cluster (round number area and prior swing highs) for ~15 pt gain.
Risk-Reward ≈ 1:3 (SL = 5 pts, TP = 15 pts)
⸻
3️⃣ Invalidation & Expiry
❌ Cancel the pending Buy Stop at 3379.50 if either:
1. A full 15 m candle closes below 3374.50 before entry.
2. It’s not triggered by 8:30 AM PST.

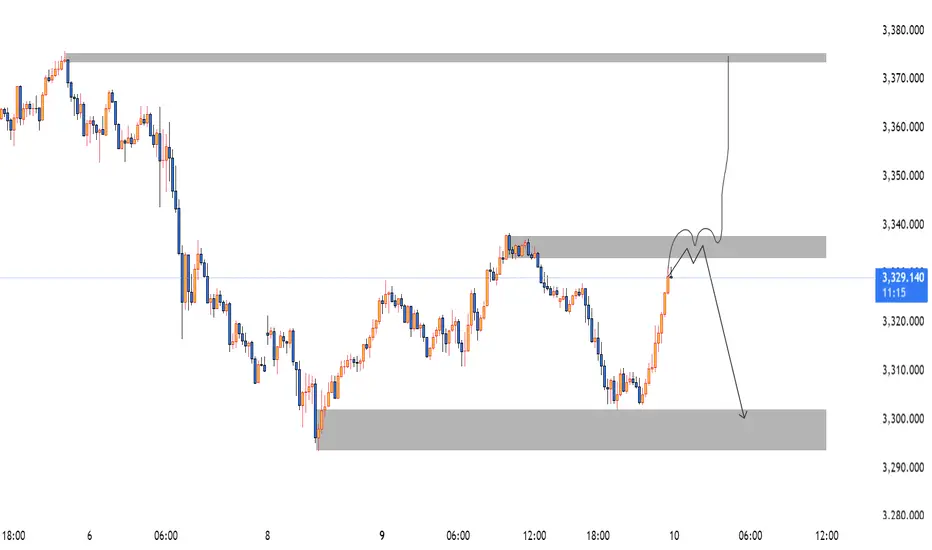
Gold XAUUSD Move 18 June 2025Don't buy/sell this messy gold setup unless there's a clear, confirmed, and clean break— either above 3395 or below 3375.
Too many wicks = too much uncertainty and manipulation.
Investors clearly have no conviction right now.
👉 Wait for a solid candle close above 3395 for longs, or below 3375 for shorts.
Anything in between is just noise — stay out and stay safe.

Gold fluctuates repeatedly, and opportunities emerge!Gold was under pressure for the second time during the day, and the pressure at the 3349 line fell back. It continued to be treated with a fluctuating mindset. The 4H cycle observation showed that the Bollinger Bands were closing, and the K-line repeatedly interspersed around the middle track. The short-term structure tended to fluctuate upward. Pay attention to the 3348-3350 and 3362 pressure zones above, and the support below is located in the 3315 and 3302 areas. In terms of operation, the main long and auxiliary short ideas are maintained, and the guidance of CPI data is paid special attention.
Operational suggestions: Gold retreats to the 3315-3305 area and tries to arrange long orders, with the target looking at 3338 and 3349. A strong breakthrough can look up to 3360. If the 3350-3360 pressure zone above is not broken, short orders can be tried in the short term.
All recent trading strategies and ideas have been realized, and the point predictions are accurate. If your current gold operation is not ideal, we hope to help you avoid detours in your investment. Welcome to communicate with us!

Gold/XAUUSD Move 9th June 2025🔍 XAUUSD Analysis – June 10, 2025
Market Structure:
Market remains in a bearish sequence, with lower highs and lower lows intact on the HTF.
The current bullish leg is corrective, retracing into a well-defined supply zone at 3333–3338.
This zone previously triggered strong selling pressure, marking institutional activity.
Key Supply Zone:
3333–3338: Strong supply zone aligning with previous bearish OB and unmitigated FVG.
Expecting a liquidity grab above intra-day highs, followed by rejection from this zone.
Invalidation Level:
If price closes above 3340 with strength (especially on M15/H1), the bearish bias is invalidated, and we may shift toward the upper supply zone around 3375–3380.
Target Zone:
3295–3305: Strong demand area from which the last impulsive move originated.
Also a logical draw for liquidity resting below prior lows.
💼 Trade Idea:
Type: Sell Limit
Entry Zone: 3333–3338
Stop Loss: Above 3344 (structure break buffer)
Take Profit 1: 3310
Take Profit 2: 3300
Risk-to-Reward: ~1:2+
🧠 Execution Plan:
Wait for price to enter the 3333–3338 supply zone.
Look for LTF confirmations: bearish engulfing, BOS, or CHoCH (M1/M5).
Enter short on confirmation with SL above zone and scale out at each TP level.
Perfect prediction of Monday's opening trendGold opened near 3310 today, and fell under pressure after reaching a high of 3321, which was in line with our previous prediction of the short-selling layout in the 3320-25 area. We successfully entered the short order and successfully stopped profit at 3305. Then the market was supported and stabilized near 3296. We decisively went long and also realized profit.
From the current trend, the short-term suppression during the day is still focused on the 3320-3325 line, and the key suppression area is around 3338-3345. Gold closed in an inverted hammer shape last week. From a technical point of view, the rebound is still mainly short-selling. If you are not in a good rhythm in gold trading recently, welcome to communicate and reduce unnecessary trial and error.
【Short-term technical analysis】
The upper short-term pressure focuses on the 3320-3325 area. If it rebounds to this point, it will be short first and look for a decline. If it rises strongly to the 3338-3345 range, it will still be the focus of short positions. The lower support focuses on the 3295-3285 area. The overall strategy of "high-short-low-long" is maintained. It is not recommended to frequently chase orders in the middle position. Be patient and wait for key point signals. I will remind you of the specific entry and exit plan during the session. It is recommended to pay attention in time.
【Gold operation strategy】
1. Go short first at the rebound 3320-3325 line. If it touches the 3338-3345 area, you can cover your position and go short. The target is 3306-3295. If it breaks, continue to hold and look down.

Trade Idea: XAUUSD Long (SELL LIMIT)🔍 Technical Breakdown:
H1 (Primary Trend Context):
• Strong downtrend: clean lower lows and lower highs
• Price broke below previous day’s low, now acting as resistance
• 20 SMA below 50 SMA, both sloping downward
• Volume increased during selloff = strong participation
• Price currently retracing into prior broken support, now potential supply
M15 (Entry Zone Confluence):
• Micro bullish structure pushing into:
• Prior M15 demand turned supply
• Dynamic resistance (20/50 SMAs)
• Thin volume / inefficiency area
• Retrace remains within context of a bearish flag/pullback
M3 (Entry Precision):
• Price approaching clean M3 supply zone between 3326.0 – 3329.0
• Minor FVG and untested supply at 3327.50
• Good stop placement just above 3332 (above M3/M15 structure)
⸻
📌 Trade Setup Details
• Sell Limit Entry: 3327.50
• Stop Loss: 3333.00 (5.5 pts)
• Take Profit: 3302.00
• Risk-to-Reward: ~4.63R
⸻
🔁 SL to Breakeven Criteria
Move SL to breakeven only after:
1. A 15-minute candle fully closes below 3312.00, breaking current bullish microstructure
2. Price either:
• Bases under 3312 or
• Retests 3312–3314 as fresh resistance
FUSIONMARKETS:XAUUSD

Trade Idea: XAUUSD Long (BUY LIMIT)Entry Type: Buy Limit
Timeframe Alignment: H4 bullish continuation → M15 demand zone retest → M3 structure forming base at support
Session Timing: Aligned with London–New York overlap (between 4:30 AM and 6:30 AM PST)
⸻
🔹 Trade Setup
• Entry: 3376.10 (Buy Limit)
• Stop Loss: 3361.00
• Take Profit: 3412.00
⸻
🔹 Trade Logic
• Price is pulling back into a clear M15 demand zone around 3376, which aligns with prior consolidation and breakout zone.
• Trend remains bullish on the H4 and M15 with higher lows and sustained closes above the 50 EMA.
• 3376 area also marks a low-volume imbalance fill on lower timeframes (M3), suggesting institutions may defend this level.
• TP is just below prior H4 swing highs (~3415)
⸻
🚫 Invalidation Window
• cancel the trade entirely if not activated by 6:30 AM PST to maintain session alignment and volatility edge.
FUSIONMARKETS:XAUUSD

Trade Idea: XAUUSD Long (BUY STOP)Direction: Long
Order Type: Buy Stop
Entry: 3366.50 (above recent local resistance and reclaiming structure)
Stop Loss: 3352.00 (below M15/M3 structure and recent low)
Take Profit: 3402.00 (previous swing high zone and just under H4 resistance)
Risk-Reward Ratio: ~2.57R
⸻
🧠 Trade Rationale
H4
• Price bounced from a higher low around 3320–3330, still respecting the long-term uptrend.
• Price is now reclaiming the 20/50 SMA cluster, which could act as dynamic support.
• Momentum is neutral-to-positive with MACD poised for a bullish crossover.
M15
• Price reclaimed 20 SMA and is now curling back above the 50 SMA.
• Clean bullish engulfing structure forming, indicating buyer re-entry.
• RSI is mid-50s with room to expand upward.
M3
• Strong, steady micro uptrend forming higher lows and consolidating under resistance near 3366.
• Increasing volume on upward moves, suggesting healthy interest from buyers.
⸻
🛡️ Risk Management & Execution
• Entry confirmation: Only enter if price breaks above 3366.50 on strength — avoid premature triggers.
• Invalidation Window: Trade becomes invalid if price closes below 3350 on a 15-minute candle. This would break both M3 and M15 structure.
• SL to BE: Move SL to break-even after price reaches 3377 and forms a micro higher low on M3 or support-resistance flip.
FUSIONMARKETS:XAUUSD

Trade Idea: Long XAUUSD (BUY STOP)
Bias: Long
Order Type: Buy Stop
Entry: 3392.60 (above current swing high & clean momentum continuation)
Stop Loss: 3379.00 (below local support & M15 20/50 SMA)
Take Profit: 3430.00
Risk-Reward: ~2.7R
⸻
📈 Multi-Timeframe Breakdown:
H4:
• Structure remains bullish.
• Price is breaking out of a range with a clean reclaim of both SMAs.
• Momentum increasing, MACD histogram turning up, signaling trend continuation.
M15:
• Strong impulsive rally from ~3290s to ~3390.
• Higher highs and higher lows cleanly respected.
• Price consolidating at the highs—ideal for breakout continuation setups.
M3:
• Momentum is persistent with shallow pullbacks.
• Small flag forming near 3390 = ideal for a stop entry just above.
• RSI cooling off but still in bullish structure—no divergence yet.
⸻
🧠 Trade Logic:
This is a momentum continuation play after a clean intraday impulse. The market has shown strong upside commitment across all timeframes and is now pausing in a flag/pennant above the breakout zone. A buy stop avoids chasing and only gets triggered if the market confirms with new demand.
⸻
🛡️ Risk Management & Execution:
• Invalidation Window (SL-to-BE Zone):
Move SL to breakeven once price closes above 3401 on M3 with bullish structure.
→ This marks a clear micro higher high and exit from the current consolidation range.
• SL Placement Justification:
3379 is just below the M15 demand zone and SMA confluence—if price breaks below, momentum has failed.
• Entry Execution:
If the flag structure gets invalidated before entry (e.g., price dips sharply), cancel the buy stop.
FUSIONMARKETS:XAUUSD

Gold (XAU/USD) – Inverse Head & Shoulders Breakout Setup🧠 Chart Pattern Identified: Inverse Head & Shoulders
🟡 Left Shoulder ➡️ Formed at a local dip.
⚫ Head ⬇️ Deepest low around 3,274.103.
🟡 Right Shoulder ➡️ Bouncing near the same zone.
🔁 This is a classic bullish reversal pattern — a break above the neckline could signal a strong upside move.
📊 Key Levels & Zones
🔵 Support Zone:
🟦 Area: 3,274 – 3,294
✅ Strong bounce seen here (highlighted by the head and shoulders base)
🔵 Resistance Zone:
📏 Just below 3,305 (marked as neckline)
✋ Price must break this to confirm the reversal
🔵 Target Point:
🎯 3360 📈
📏 Based on the height from head to neckline
🔵 Stop Loss Zone:
❌ 3,274.526
🔻 Below the head for safe risk control
⚙️ Trading Setup Summary
🔹 📍 Entry Point:
📌 Around 3,294.449
🚪 Enter on breakout above neckline
🔹 🎯 Target Point:
🏁 3360
🔹 🛑 Stop Loss:
🚫 3,274.526
🔹 Risk-Reward Setup:
🔍 Targeting a move of ~65 points
⚖️ Risk of ~20 points → solid R/R ratio
📈 Indicator:
🧮 EMA 70 ➡️ 3,305.005
⏳ Price currently testing it — a break above EMA would boost bullish confirmation.
📅 Economic Events:
📆 Multiple event icons suggest upcoming news — expect volatility!
⚠️ Be cautious during these times.
✅ Final Thoughts:
📊 Pattern suggests a bullish breakout is near 🚀
🔒 Use stop-loss and enter after breakout to manage risk effectively
🎯 Keep an eye on volume during breakout — it confirms strength

Trade Idea:XAUUSD SHORT ( SELL STOP )🔍 Multi-Timeframe Analysis
📉 H4:
• Price is compressing below the 20 and 50 SMAs.
• Recent attempts to break higher failed to sustain; MACD is slightly bearish, hinting momentum is fading.
• Consolidation after the big push suggests potential for another leg down if support breaks.
🕒 M15:
• Strong bounce into resistance, now stalling at the underside of the previous structure (~3315–3320).
• 20 SMA is curling down and converging with the 50 SMA, signaling a potential momentum shift.
🕒 M3:
• Price just lost short-term bullish structure after failing to break 3318.
• Flattening and slight downward curl in the 20 SMA.
• Volume shows a slowdown on the bounce and heavier selling earlier in the day — signs of weakness.
⸻
✅ Trade Idea
Type: Sell Stop
Entry: 3308
Stop Loss: 3322
Take Profit: 3273
———
🧠 Why This Setup Works
• This is a momentum breakdown trade: placing a sell stop just below short-term support (3308) to catch the shift in momentum if price breaks lower.
• Price already rejected the high around 3318; if it pushes below 3308, it confirms that sellers have taken back control.
• There’s clean room down to 3273 — a previous reaction zone and recent demand level — offering a good risk-to-reward.
⸻
🛡️ Risk Management & Execution
• SL to BE Rule: Move stop loss to break-even once price reaches 3293 (15 points in your favor, 1R). That’s the halfway point to target and right above a small reaction zone that could cause a pullback.
• Invalidation Window: If price moves above 3325 before activating entry, cancel the trade idea. That would invalidate the lower-high structure and suggest momentum has shifted bullish again.
⸻
⏱️ Session Timing & Considerations
• NY session opens at 6:30 AM Pacific (PT).
• Ideally, this trade should activate and move by pre-New York to early NY session. If price stalls or consolidates near the entry level for too long into the session (after 9:30–10:00 AM PT), consider canceling or reassessing.
FUSIONMARKETS:XAUUSD

Trade Idea:XAUUSD Short ( SELL LIMIT )📉 Multi-Timeframe Breakdown
🔹 H4 Chart (Macro Bias)
• Trend Context: Price is still broadly in an uptrend on the H4, but it’s testing the 50 SMA from above.
• MACD: Bearish crossover below the signal line suggests waning bullish momentum.
• Volume: Slight uptick in bearish volume as price pulls back from the recent highs.
• Bias: Neutral to Bearish Short-Term (H4 trend remains up, but weakening).
🔹 M15 Chart (Setup Zone)
• Structure: A sharp selloff broke both the 20 SMA and 50 SMA.
• Momentum: RSI ~16, oversold—but that can persist in strong trends.
• Volume: Large spike on the breakdown candle = strong bearish interest.
• ATR: 7.97 = elevated volatility.
• Bias: Bearish momentum, potential pullback retest opportunity.
🔹 M3 Chart (Execution Focus)
• Price Action: Freefall with clean rejections at the 20 SMA.
• Volume Spike: Bears in control, RSI also confirms momentum exhaustion but no reversal confirmation yet.
• Bias: Bearish with potential for bounce/pullback retest entry.
⸻
✅ Primary Trade Setup
Type: 🟥 Sell Limit
Rationale: Let price retrace into resistance before fading it, using structure for confirmation.
Entry Zone: 3270–3276 area (prior support becomes resistance near 20 SMA on M15 and 50 SMA on M3).
Stop Loss: Above structure high → 3283
Take Profit: Next key support zone ~3245–3250 (measured move + demand zone on M15/M3).
📌 Sell Limit Order
• Sell Limit @ 3273
• SL @ 3283
• TP @ 3248
FUSIONMARKETS:XAUUSD

Gold XAUUSD Move 27 May 2025Price is currently hovering around the 3300 level after a sharp decline from the recent highs near 3360. The market has now entered a crucial support zone at 3280–3290, which previously acted as a strong demand area.
This zone is expected to act as initial support. However, if this area fails to hold, the next major support lies in the 3240–3250 region, which aligns with historical demand and a previous accumulation zone.
Key Levels to Watch:
Resistance: 3320–3324 (possibly a short position)
Support 1: 3280–3290 (current zone)
Support 2: 3240–3250 (next demand area)
The market is currently at a decision point. Watch for a reaction at 3280–3290 — a bounce may signal short-term relief, while a break lower could open the path to deeper downside toward 3240.
