WILL GOLD HIT 3000 ?As we can see on weekly timeframe xauusd making Cup&Handle Pattern
an also if we breakdown to lower timeframe especially on Daily timeframe he just making descending channel
which mean he would continuation bullish as soon as possible
We just waiting for clear flag on timeframe 1H-4H to execute long
However this plan can be false if xauusd making new pattern
share your idea below
thankyou friends
Xauusdprediction

XAUUSD Weekly Analysis Nov 29 - Dec 5So We saw a very strong movement on gold this last week. And once gold reached 1780 price, it has started to pullback since then.
By just looking at the last strong impulsive movement to the down, there is a high probability that we will be seeing some correction movement in this upcoming week, there will be some buyers towards the price of 1840 (very likely to go there) and then we might find a trade opportunity to scale few hundred pips from a single trade.
Potential targets:
First Take profit should be 1780 price levels where market developed a support level this week. And if market crosses that level and go below.
TP 2 will be 1760 price levels
TP 3 will be 1725 price level if we break below 1760

XAUUSD Movement for Weekly (24-31 August 2021)Hellooo...My Dragon Friends
I see XAUUSD possible go to 1830-33 the resistance.
couse the COVID case still UP, Risk On
Lets See
Happy Trading
Smart Trading
Money Management
Risk Management
Disclaimer On

XAUUSD Movement for Weekly (10-17 August 2021)Hellooo...My Dragon Friends.
I see that have PINBAR candle Stick at GOLD.
and finish it going down.
Lets See
Happy Trading
Smart Trading
Money Management
Risk Management
Disclaimer On

XAUUSD bullish for target 1940#xauusd, monthly and weekly chart forming higher high and higher low, monthly bar of April did not make lower low and broker high of the month of March, similarly May monthly bar broke April monthly high. 1855 initial demand zone for long, if breaks this level then next high demand zone for buy 1840-30 area. 1888 is hurdle where sellers may attempt to involve in market mean expecting some retracement by this level.

Gold Spot- XAUUSD- short Gold spot loosens its shine! An elevated NFP stats moves the instrument lower and starts accumulating net positions lower to the downside.
Historically it performs well either bullish or bearish but an area of consolidation is taking place with an accumulation of liquidity at play until it breaks either way. My bias is still bearish before a return to bullish territory.
Comments are welcome! Have your say.

XAUUSD FLY TO THE MOON UPDATEAs we can see
Gold has made Higher High and Higher Low consistently
and also he respected Golden area fibo 0.618
i expected gold stil running as my forecast
now im gain 600 Pips since my previous forecast uploaded
so guys , if you want to execute gold currently don't forget to waiting for bullish flag
However gold could FAIL to Bullish if he can't break the near resistance as well
thankyou
if you have some idea
please comment below !

XAUUSD REVERSAL GOLD MOMENT TO BUYAs we can see xauusd making clear structure on 4H timeframe (Falling Wedge)
and also we can see on higher timeframe xauusd has been hit the most important trendline
my opinion for this trade will be looking for bullish momentum , which is i was took trade on 1675 before
my expectation for gold , he will hit trendline on 1877 for long term
so if you guys follow my plan
dont forget to watch your money management
risk maximum 2% from your balance
thankyou
you also can share your idea below

Gold – Formation of the first wave from the point of 5In the daily chart and by price crossing the trend line, the uptrend is confirmed. In the 240-minute chart, according to the wave count, the price is in sub-waves of the 3rd wave from “ i “ point , which can be extended up to the range of $ 1967.

Gold - The first ascending wave in the V waveAn uptrend that starts at $ 1764 and ends at $ 1875 can be a 5-wave movement.
The price is currently in the corrective phase of this trend, which can be extended up to $ 1805. The main confirmation for the uptrend will be received when the price crossing the range of $ 1965
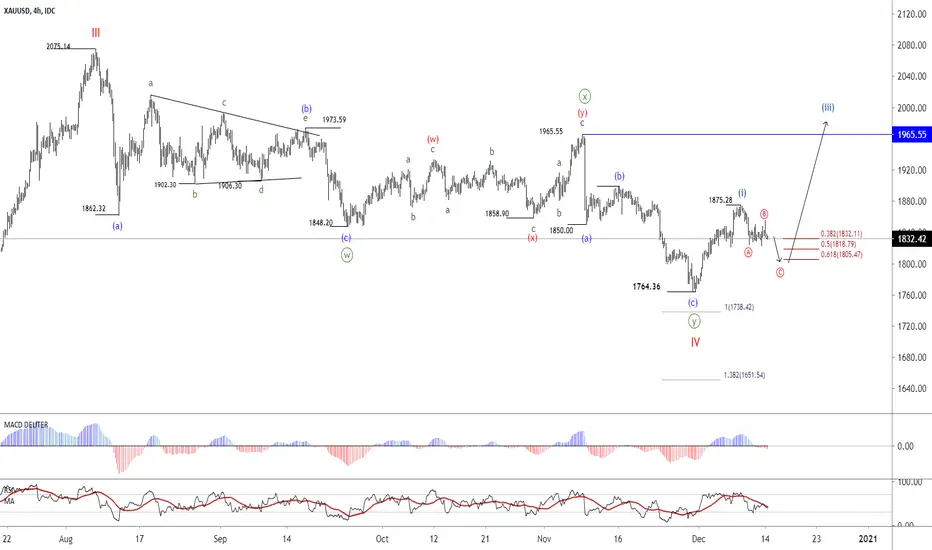
the Possibility of completing IV Wave in the range of $ 1764In the 240-minute chart, with the price increase, we should consider the end of the downtrend in the range of $ 1764. If the price can cross the range of $ 1898, the first confirmation will be received. In order to get the main confirmation for the advent of the V wave, the price must cross the range of 1965.55, with 5 ascending waves.

Gold –The change of downtrend target to $ 1597By monitoring the 240-minute chart, the existed scenario is that the price located in the sub-waves of 3rd wave, which can be extended up to the range of $ 1651, and in continuation with the corrective movement in the 4th wave, the 5th wave will be ended in the range of $ 1597.

XAU/USD: TRADE setup LONG/BUY buy now
leave T/P limit as mentioned
check again in 8 hours time
let's see if this one works
good luck !

GOLD- 100PIPS. If you want to be safe, you can take a profit.If you want more, help me with a like and a comment.
If you want to be safe, you can take a profit now. The trade is still activ.
100PIPS In a few hours.
Enjoy the profits!

Xauusd prediction We can see the resistance in red is a strong resistance and has been test more then two time so a short position a can be created.
TP and SLare shown in the diagram
Do always use trailing profit
If you like my analysis do like and comment below whether you agree or disagree from my analysis and do follow me. As I regularly post the prediction on all major forex currency pairs,gold,bitcoin,and stocks like Tesla
Note this is not a trading advice and I am wrong 100%

Xauusd prediction We can see that the price is testing the support and resistance if it breakupward this the short term downturn has finished however if the market breakout downward thus the down wards trend continues tp and all are show
If you do like this idea do like and comment below whether you agree or disagree and do follow me
Note this is not a trading advice and I am wrong 100%

Xauusd predictionHere we are seeing that the market is currently test the support and resistance however a breakout upward can lead to the trend change upwards however we could mostly see a breakout downward as US is willing to reopen its economy which means that the risk factor is on.
If you do like this idea do like and comment below whether you agree or disagree and do follow me
Note this is not a trading advice and I am wrong 100%

GOLD (XAUUSD) is ready to resume SELLReasons to sell
A correction pattern according to Elliot wave theory has been counted vividly as shown on the chart
We also have a complete harmonic pattern at the 50% fib. level of the whole impulse swing.
Expecting Gold to fall for Wave 3 or wave C as long as the invalidation level is not broken
Therefore we are trading either wave 4 correction or we are trading anew impulse wave
Write in the comments all your questions and any instruments you want me to analyze .
Kindly push the like button if you think the idea is useful - that would be the best THANK YOU.
Thank you.

XAUUSD | Will the Uptrend finally move again? - English StudyInstagram : @GoldenScaleTrading | After the respect of a great Trendline that works as a new support, we have the difficulty of the Bears to push the price even lower. We also have EMAs showing that the rise should be close on the daily scale and, to confirm my theory again, the RSI is showing great buying potential today. The increase will also happen due to the price of raw material increasing in the long run.

GOLD Pullback to 1625.25| Downtrend in the making| 3March2020GOLD IS DEVELOPING A NEW BEARISHNESS DOWNTREND
1586.55 start with a new robust demand towards 1625.25 after a 'selling climax'. Is this is a new beginning of a Gold downtrend? Most of the trader selling Gold due to cover their margin lost at Dow Jones market crash. The coronavirus is in the critical first wave development. The market crash has send down to Gold due investors selling. China try to cover the pandemic to not let the world know how bad it is. The pandemic is now spreading faster and penetrated to the South Korea, Iran, Japan and some of Europe countries like Italy.
Investors dump stocks as fears mount that outbreak has not been contained and investors scramble to reassess impacts. As investors punished stocks and oil, they fled towards safe-haven assets like gold, government bonds and select currencies. Gold, which is historically seen as the safest of bets in troubled and uncertain times, was sent on a roller coaster on Friday.
While the Gold set low to 1586.55, this would be the very good from all of the investor to start to pump up gold again as asset in the future. Benefit from the coronavirus was the GOLD will pushed lower thus the lower price in GOLD would be the discounted price to buy from below intrinsic value at the cheapest price. It is an odd moment for gold to be tumbling. One of the oldest and most-trusted safe havens in times of crises, gold typically rallies amid nasty stock sell-offs like the one that has gripped the world this week. So its plunge Friday -- it fell as much as 5%, the most in almost seven years -- caught many traders flat-footed and scrambling for explanations as to what had just happened. The most often heard of them: Gold investors don't want to sell but are forced to cover the losses in other asset classes. It first started with forced selling from equity investors who also sold their gold positions to cover their losses in equities and also to cover margin calls.
For me, selling price is much more easier to happen rather than to push upward. The historical gain on the past last month February 2020 has been erased within 1 week period. The buying plan to get the GOLD push forward higher will take sometimes gaining periodically when there is nothing major event impacted the gold and more lowest interest rate could help. Looking forecast 1.75% to go 1.50% on 17-18 March 2020 Fed FOMC plan.
Gold is forming a bearish downtrend for the first time in history will to be continue. Robust demand to 1625.25 before GOLD will pushing downward to cover the economy from fear of margin call stock from investor will be continue.
Dont forget to subscribe if you like the post. Thumbs up.
By Zezu Zaza

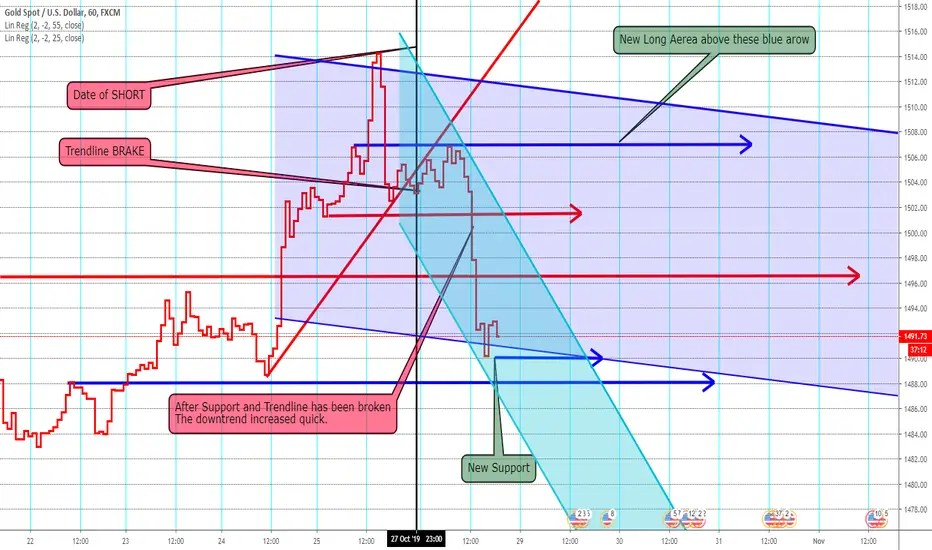
XAUUSD UPDATE SHORT since Trendline and Support BrokenHello to all watching my charts.
Here we are able to watch a trendchange as is showed
in other currecncy the last week.
Here is how it works in reality:
1. Brake of a trendine ( Long trend here ends at brake
27.10. BLACK LIne
2. Brake of 1 or 2 supports (in addition to a trendline brake
that a sign of TRENDCHANFGE.)
here it is a change from LONG to SHORT
at brake of 1502 as support line.
Than as in other currencies also
"The stone starts to roll"
as we here call it.
Look at the quick fall
Marked with a red Callout.
No we are below these supports and next hold is
1490
after that
1488
as you will see with the blue trendline.
I do hope my picture tells all

Bear Flag on XAUUSDBear Flag forming on XAUUSD, remember to wait for a clear break for confirmation!
Follow for more ideas like this one! :D
