Gold Hits Target Zone — Uptrend May Continue if Support HoldsGold broke below the 3326–3316 support zone earlier today,
but found strong buying interest near 3300, rebounding into the 3340–3350 target range.
Despite facing resistance here, the 2-hour chart still shows an incomplete bullish formation,
suggesting potential for further upside.
—
📌 Key Technical Zones to Watch:
🔸 If price pulls back from the 3340–3350 resistance, monitor 3326 as the key support
🔸 If 3326 holds, bulls may regain control and push the price swiftly toward
→ 3358–3368 resistance zone
🔸 3352 is a critical bull/bear pivot point — a breakout above it could signal a renewed bullish breakout
—
🎯 Trade Strategy:
✅ Long positions may consider partial profit-taking near resistance
✅ If price pulls back and holds above support, re-entry opportunities may arise
⚠️ Watch volume closely and avoid chasing high if momentum stalls
Xauusdsell

XAUUSD:Wait for a short near 3330
Last week's data was negative for gold and silver. However, it should be noted that the actual announced value is lower than the previous value, in essence, the economic end did not release good, but the contraction speed is lower than the market expectation.
In terms of the large cycle, June is the continuation of May's wide shock, long rest storage stage, but also up and down back and forth pull, the main trend is still more, pay attention to seize the next wave of unilateral rise opportunities.
Now the fluctuation is still large, need to be patient and wait for the right position, short-term attention to 3330 resistance near to short, back to step near 3300 and then consider more.
Trading Strategy:
SELL@3330
TP:3310
↓↓↓ More detailed strategies and trading will be notified here ↗↗↗
↓↓↓ Keep updated, come to "get" ↗↗↗

Sell@3335Technically, the first key support range is at 3,240-3,260. If this area holds as effective support, it may trigger a short-term rebound. Close attention should be paid to updates on U.S. tariff policies and the evolution of the situation in war-torn countries, as geopolitical risks may exacerbate market volatility ⚠️
⚡️⚡️⚡️ XAUUSD ⚡️⚡️⚡️
🚀 Sell@ 3360 - 3240
🚀 TP 3310 - 3290
🚀 Buy@ 3250 - 3260
🚀 TP 3290 - 3310
Accurate signals are updated every day 📈 If you encounter any problems during trading, these signals can serve as your reliable guide 🧭 Feel free to refer to them! I sincerely hope they'll be of great help to you 🌟 👇

Gold: Market Analysis and Trading StrategiesSo far, although the price has risen, it has not yet broken through the upper resistance, and the lower support remains intact. Overall, the market is still in a narrow range of consolidation. From a technical perspective, the 2-hour chart shows a bullish bias, indicating a potential for continued upward movement in the short term.
However, if during this consolidation phase the price breaks below the key support at 3309, it is likely to further test the support zone around 3296–3288.
At this stage, traders can consider entering light long positions and gradually add to them on dips to reduce the average entry price. For more conservative traders, it's advisable to wait until a clear breakout occurs before taking action.
Watch the 3338–3352 area for potential short opportunities as it's a key resistance zone, and the 3303–3288 range for long entries as it offers strong support. Trading near these levels generally carries lower risk and a higher probability of profit.

Gold May Rebound After Monday Dip; Watch Tariffs & GeopoliticsGold may continue to decline before rebounding on Monday📉. The first support level is currently near 3,240-3,260. When approaching this support area, considering going long is advisable👍. It is still crucial to closely monitor the latest developments regarding U.S. tariffs and the situation in war-torn countries, as significant volatility may occur at any time⚠️. If a rebound reaches 3,350-3,360, considering going short is an option📉
⚡️⚡️⚡️ XAUUSD ⚡️⚡️⚡️
🚀 Buy@ 3250 - 3260
🚀 TP 3290 - 3310
🚀 Sell@ 3360 - 3240
🚀 TP 3310 - 3290
Accurate signals are updated every day 📈 If you encounter any problems during trading, these signals can serve as your reliable guide 🧭 Feel free to refer to them! I sincerely hope they'll be of great help to you 🌟 👇

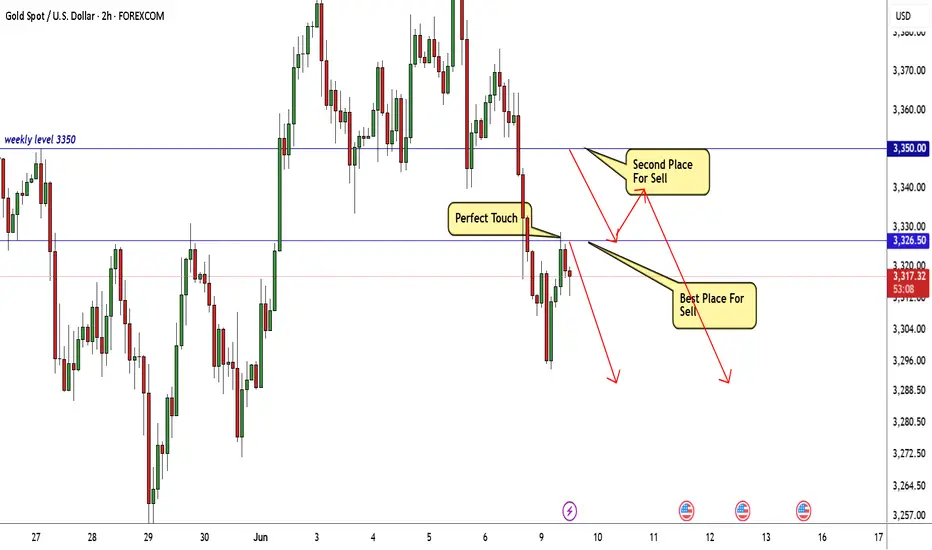
GOLD Best 2 Places For Sell Very Clear , Ready For 500 Pips ?Here is my opinion on gold on 2H T.F , we have a very good bearish price action and we have a very good retest for broken support and new res , so i think 3326.00 will be a very good place to sell and targeting 250 pips at least , also if the price go up a little 3350.00 will be the last place we can sell from it and targeting 500 pips .
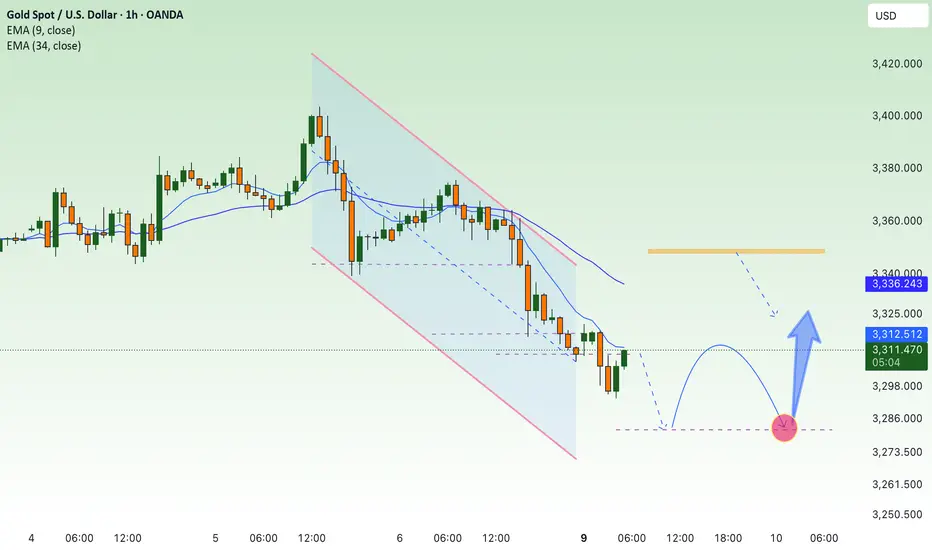
GOLD: Bullish Bias Holds, But Mind the Unfilled GapGold dipped below 3300 today and bounced back, though the gap near 3289 remains unfilled.
This shows buying interest is active, but also reveals that some sideline capital is still waiting for a full retest.
Combined with selling pressure on the rebound, it’s clear that bullish strength is currently limited.
—
🔍 Two Possible Scenarios from Here:
1️⃣ If support proves firm during consolidation, bulls may regain momentum and push higher
2️⃣ If support fails, price is likely to fill the 3289 gap before launching the next leg up
📌 Current Trade Outlook:
✅ Bullish trend remains intact
✅ Regardless of the short-term path, the direction is upward
✅ Watch resistance at 3331, with a key zone near 3348
—
⚠️ Note: The daily chart structure still needs further correction.
If volume remains weak after a second dip and a failed bounce follows, bears may take over again — in that case, the next downside target would be around 3258–3228
📩 Conclusion: Stay long-biased, but react flexibly to support strength and volume shifts.
XAUUSD Analysis today : Drop to monthly support?XAUUSD with NFP breakdown from significant daily support price has dropped nearly to monthly support and may continue to drop to retest the monthly support? As there is a rejection from the monthly high and the market is almost nearly to monthly gap open, it is highly likely price may retest the monthly support.
As with new monthly open, we see price has retraced to the significant intra day resistance to retest the level 3328.00
As the market started to reject back to the major direction of the trend, it is mostly probable that the price may continue to drop to this long term support level
3289.32

I am waiting for SELL here with wave 5 catching strategy In the Kitco survey, Wall Street analysts were divided on the direction of gold prices this week. Fifty percent of experts expect prices to rise, 43 percent expect prices to fall, and 7 percent believe gold will move sideways. This reflects a generally cautious sentiment as there is no clear factor to promote a new trend.
Some experts still lean towards the uptrend as gold holds important support levels and remains a safe haven amid geopolitical uncertainty. Others predict a correction in gold prices due to positive signals from the White House about the possibility of reaching trade agreements and the recovery of US stocks.
In addition, there are also neutral opinions that gold is unlikely to continue to rise sharply without further momentum, especially when stock indexes are more attractive to investors.
James Stanley, senior strategist at Forex.com, remains optimistic, saying that gold is making a technical correction to continue the larger trend. He believes that the $3,300 and $3,280 zones will be important boundaries to watch.
What do you think about this strategy?
Best regards, StarrOne !!!

6/9 Gold Analysis and Trading SignalsLast Friday, gold experienced a sharp drop, briefly testing the 3300 level. From a technical standpoint, the market has started to show early signs of bottom formation, which could materialize either as a double bottom / multiple bottom pattern, or through a direct upside breakout.
If the former unfolds, we expect a stronger and more sustainable rebound.
If it turns into a straight bullish leg, traders should be cautious of potential exhaustion in the rally, which may invite a renewed bearish attack.
📊 Key Macro Focus This Week:
Markets will be primarily influenced by data releases on Wednesday through Friday, including:
Monthly CPI
Initial Jobless Claims
Inflation Expectations
As a result, Monday's trading will be dominated by technical patterns, with a bias toward a corrective rebound. The strategic focus should be on buying near support, with short-term opportunities to sell near key resistance.
📌 Monday Trading Plan:
✅ Buy in the 3303–3286 zone (early base-building area)
✅ Sell in the 3343–3353 zone (overhead resistance)
🔄 Intraday pivot levels for tactical entries:
3338 / 3326 / 3317 / 3309

Gold price recovers, accumulates new week⭐️GOLDEN INFORMATION:
Gold prices (XAU/USD) hold steady near $3,310 during the early Asian trading hours on Monday, with the precious metal struggling to gain traction amid renewed strength in the US Dollar (USD). While a firmer Greenback poses headwinds for gold, lingering uncertainty surrounding President Donald Trump’s tariff strategy continues to offer some support.
On Friday, upbeat labor market data bolstered the dollar, pressuring dollar-denominated assets like gold. The US Bureau of Labor Statistics (BLS) reported that Nonfarm Payrolls rose by 139,000 in May, outpacing expectations of 130,000 and surpassing the previous month's downwardly revised figure of 147,000 (from 177,000). The stronger-than-expected jobs report has dampened hopes of near-term Fed rate cuts, weighing on bullion’s appeal.
⭐️Personal comments NOVA:
Gold price takes liquidity 3294, below 3300 GAP zone last week. Accumulate and react at lower support zones
⭐️SET UP GOLD PRICE:
🔥SELL GOLD zone : 3348- 3350 SL 3355
TP1: $3340
TP2: $3330
TP3: $3320
🔥BUY GOLD zone: $3281- $3279 SL $3274
TP1: $3292
TP2: $3300
TP3: $3315
⭐️Technical analysis:
Based on technical indicators EMA 34, EMA89 and support resistance areas to set up a reasonable sell order.
⭐️NOTE:
Note: Nova wishes traders to manage their capital well
- take the number of lots that match your capital
- Takeprofit equal to 4-6% of capital account
- Stoplose equal to 2-3% of capital account
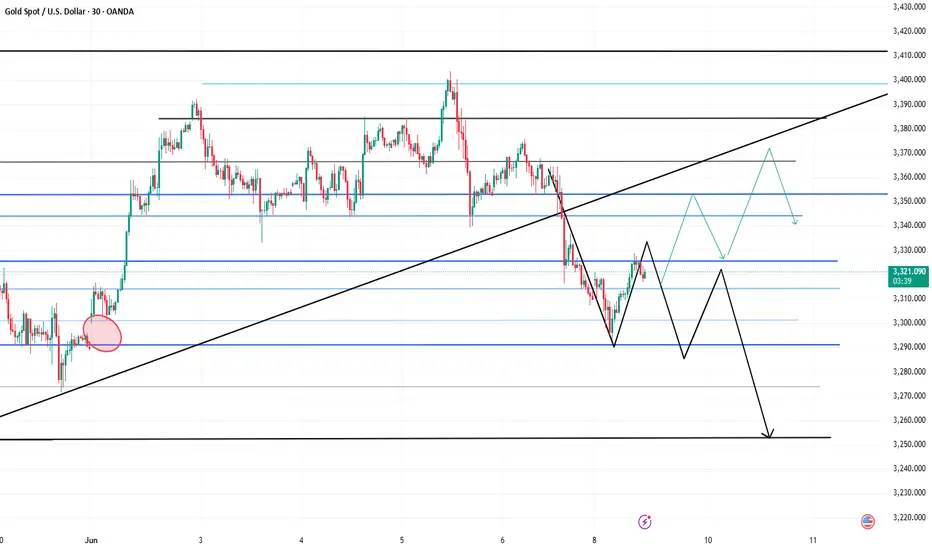
H4 swing order analysis for traders, Trade Swing H4 GoldH4 swing order analysis for traders, pay attention to wave 5 to confirm Long-term Sell
James Stanley, senior strategist at Forex.com, said: "I remain bullish on gold and will look for new support for the broader trend to continue.
Gold has made a new short-term high, with the price rising above $3,350/oz. Therefore, I do not rule out the possibility of this uptrend continuing and will look for new support, especially at $3,300/oz and $3,280/oz," he said.
Rich Checkan, Chairman and CEO of Asset Strategies International, said: "The current momentum favors gold and silver. While there may be some profit-taking, I expect gold to continue to rise next week thanks to the weakness of the US dollar, political tensions in the Middle East and Ukraine, the impact of tariffs and the passage of a major bill in the US that will increase public debt, leading to consumer inflation. These factors will continue to drive demand for gold as a safe-haven asset."
Adrian Day, Chairman of Adrian Day Asset Management, shared: "There are signs that North American investors are increasing their purchases of gold, although not a strong wave, but I believe this trend is gradually changing. This is a positive signal for the gold market in the future."
Best Regards StarrOne !!!

XAUUSD: $3100 is the next target, Get Ready For the Big Move!Gold is currently making a small correction and looking at how the price is behaved. We are expecting how the price is likely to develop next. Use accurate risk management.

Geopolitical Undercurrents Support Gold as NFP LoomsTVC:GOLD OANDA:XAUUSD Gold hovers near $3,370 after failing to hold above $3,374, where previous support has turned into resistance. Price remains trapped between TL2 and TL3, with short-term direction hinging on tonight’s U.S. NFP data (130K jobs expected, 3.7% YoY wage growth). A strong report may trigger a drop toward the $3,342–$3,325 support zone, while weaker data could spark a bullish breakout toward $3,402.
Although Trump and Xi agreed to restart trade talks, deep fractures remain over export controls, Taiwan, and rare earth supply. These unresolved issues suggest geopolitical risk is far from over, offering medium-term support for CAPITALCOM:GOLD gold despite recent risk-on flows.
Resistance : 3,374 , 3,402
Support : 3,342 , 3,325

Gold Drop Fully Expected — Now It's Bulls?This recent decline in gold was well within our expectations. Since Monday, I’ve been highlighting the following:
The 3400 zone is a strong historical resistance, with heavy supply pressure;
A gap remains open at 3289, creating downside risk.
Today's drop is a deep flush of selling pressure near the 3400 zone.
Although the 3289 gap is still unfilled, this move may trigger dip-buying activity, giving bulls some room to work with.
📌 The first rebound resistance is likely near 3343, but because the gap is still a threat, most funds remain cautious. This could result in:
Weaker-than-expected rebounds;
Even possible bull traps followed by renewed downside.
✅ Long strategy reminders:
Keep position size moderate;
Set realistic targets;
Adjust your approach in line with market development.
Stay sharp, stay flexible — profits favor the prepared.

Gold Is Likely to Break Below 3300 SoonYesterday, gold rallied up to near 3400 before pulling back, just as we had anticipated. We've repeatedly emphasized that 3400 is a strong resistance level, and those who followed through with short positions likely saw impressive profits.
Today, after a sharp drop, gold has rebounded again and is fluctuating near resistance. Support lies at 3352, and if that breaks, the next downside target is around 3333, followed by a possible move to fill the gap between 3300–3289.
🔍 Trading Logic:
There's still significant selling pressure above 3300, with the gap remaining unfilled.
Once the gap is filled, bulls may regain confidence to push higher — though they still face dense resistance above.
📌 Clear Profit Opportunities:
✅ Short toward the 3289 gap fill
✅ After the gap is filled, consider buying into the bullish rebound
The setup is clear — the key now is timing your entries and managing your positions wisely.

6/5 Gold Analysis and Trading SignalsGood morning, everyone!
Gold surged above 3380 yesterday but faced strong resistance, pulling back before testing the critical 3400 level. Despite multiple attempts, price failed to break through, highlighting a clear lack of bullish momentum near historical highs.
From a technical perspective, a potential M-top (double top) pattern is forming on the 30-minute chart. If confirmed, we can expect a deeper retracement, with an initial target around 3330, and possibly 3300 in case of further downside. Under this structure, today’s primary trading bias should favor short positions.
That said, if gold breaks above 3400 with strength, the 3416–3438 target zone becomes viable. However, any such breakout is likely to be followed by a pullback. In that scenario, we’ll closely monitor the 3392–3368 support range before executing follow-up trades.
📉 Technical Notes:
Price remains near a historical resistance zone, and buyers are showing hesitancy at these levels;
While yesterday’s Beige Book report provided short-term bullish sentiment, we need to observe whether the Asian and European sessions digest and extend that move.
🗞 Fundamental Outlook:
The key event today is the U.S. Initial Jobless Claims report, which may trigger volatility;
Gold remains supported by risk-aversion flows, but traders should be mindful of potential corrections at elevated levels.
💡 Risk Management Tip:
In such conditions, it is highly recommended to scale into positions with reduced lot size, and use tight risk controls to guard against unexpected reversals.
📌 Trading Recommendations for Today:
Sell near 3423–3436, targeting short-term pullbacks
Buy near 3312–3298, if deeper correction materializes
Pivot levels for tactical trades:
3416 / 3403 / 3392 / 3386 / 3367 / 3352 / 3343 / 3328
Strategy Summary:
Favor short setups on rallies unless 3400 is decisively broken. If support at 3362-3358 fails, expect the bearish trend to gain further momentum.

6/6 Gold Trading StrategyAfter a short rebound, gold is now hovering near key resistance levels.
The critical zone is around 3366 – if price breaks above this, the next upside targets are 3378–3388.
However, from a broader perspective, the 4H chart still shows an uncorrected bearish setup.
Without strong buying volume, the price may drop again — potentially below 3330, or even breach the 3300 level.
—
📅 Key Data Releases Today:
🔹 NFP (Non-Farm Payrolls)
🔹 US Unemployment Rate
Both events are expected to bring high volatility, so manage your risk carefully.
—
📊 My Intraday Trade Plan:
✅ Sell on rallies
🎯 Target: around 3330-3290
📌 Only if price reaches that support zone will I consider shifting to a bullish bias

Gold Analysis – Likely Scenario📍 Gold is currently trading around 3375 USD and gaining bullish momentum with the London session opening.
🔸 Key Zones:
🟨 Critical Resistance (Orange Zone):
📍 3378 – 3384✅ Price consolidation zone – if broken with strong volume, a bullish continuation is likely.
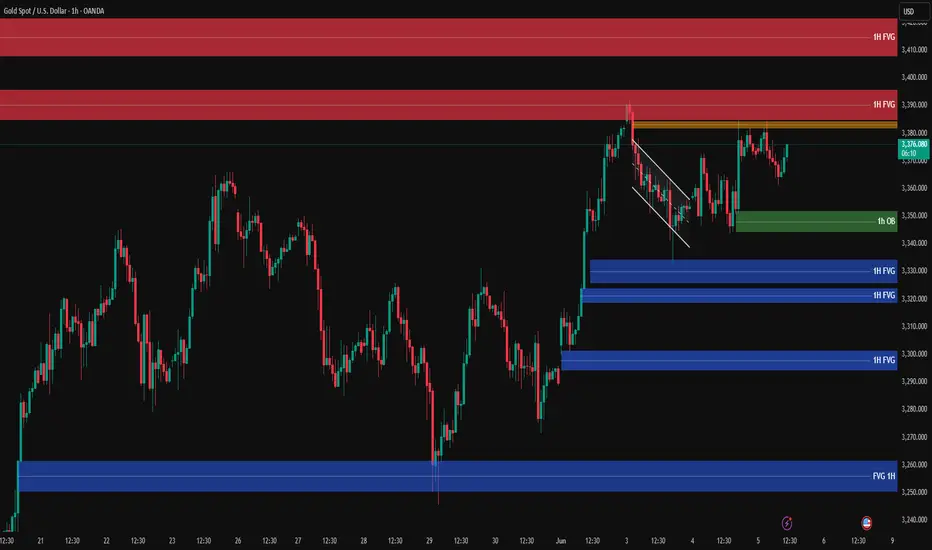
🔴 Supply Zones (FVG):
1️⃣ Upper FVG 1H:📍 3386 – 3397
2️⃣ Main Supply Zone FVG 1H:📍 3405 – 3422
🟢 Demand Zone (1H OB):
📍 3345 – 3350✅ Strong buy zone after the breakout of falling wedge structure.
🔵 Lower Demand FVGs:
3330 – 3335
3315 – 3325
3290 – 3300
3260 – 3270
✳️ Likely Scenario:
If the orange resistance zone breaks, price is likely to rally toward the 3386 – 3397 FVG, and potentially 3405 – 3422.
If price gets rejected, watch for reactions at the 3345 – 3350 OB for potential long entries.
🔍 Insight by ProfitaminFX
If this outlook aligns with your bias, or if you see it differently, feel free to share your perspective in the comments. Let’s grow together 📈
XAUUSDThe trend of XAUUSD is fluctuating.
Wednesday: XAUUSD in the Asian market rose sharply to 3372 and then quickly dropped to 3348. The current quotation is 3360.
It is a good trading opportunity for traders who bought low yesterday. The lowest yesterday fell to 3333. The operating space fluctuates by about $40/ounce. Many people have no idea. The profit of trading 1 lot of buy orders is 4. The profit of trading 5 lots is 20k.
This week is the monthly data news week. Including ADP. ECB interest rate decision, big non-agricultural data that have a significant impact on the economy.
Trend observation. There is still an intention to continue to rise. In terms of operation, you can focus on buying at low levels.
Pressure range: 3400-3390
Support range: 3340-3350
Under the influence of news. Many trends will be distorted due to the influence of data news. So I have been reminding you not to trade alone. If you want to follow good swing trading instructions to make reasonable trades and expand your profits, please leave us a message.

Gold:Go short before you go long
Gold is currently volatile upward trend, here can not avoid repeated retracement. Now the performance is relatively strong break 3884 short - term high, then the United States is expected to attack twice, then can participate in the long again. Note: long is the main, short is the auxiliary
You can go short now, and then go long. Below is support around the 3365-70 zone
Trading Strategy:
SELL@3385-90
TP:3370-65
BUY@3365-70
TP:3390-3400
↓↓↓ More detailed strategies and trading will be notified here ↗↗↗
↓↓↓ Keep updated, come to "get" ↗↗↗

Safe-Haven Demand May Drive Gold Prices Higher✅ Today’s ADP report came in bullish for gold,
✅ Meanwhile, the Federal Reserve’s Beige Book reveals:
A slight slowdown in economic activity
Increased policy uncertainty and price pressures for businesses and consumers
An overall pessimistic economic outlook
📌 Combined with ongoing geopolitical tensions, this creates a supportive backdrop for safe-haven buying in gold.
🔍 Technical Outlook (1D Chart):
Gold is still facing a bearish divergence on the daily chart. For this to resolve, the market must choose between:
1️⃣ A strong breakout with volume, pushing toward 3430–3450
2️⃣ A pullback to repair structure, including filling the gap below 3300, which may later fuel a rally toward 3500+ if bullish catalysts arise
📅 Key Events to Watch This Week:
Thursday: Initial Jobless Claims
Friday: NFP (Nonfarm Payrolls)
⚠️ Also monitor developments on trade tariffs, which may affect market sentiment
📊 Short-Term Trade Plan (Range Strategy):
🎯 Key levels to watch:
Resistance: around 3400
Support: near 3366
📌 Consider range trading between 3408–3358, selling highs and buying dips with strict risk control.

Continue to short goldTechnical aspect:
Although the ADP data release is a big positive for gold, the trend of gold is quite different. It only rebounded to around 3362 and then gradually fell back, which to a certain extent strengthened the effectiveness of the short-term resistance area of 3365-3375. For the time being, technical indicators alone cannot support gold to continue to rebound. After consuming a certain degree of bullish momentum, gold will continue to retreat. And I think 3340 will be broken, and even continue to the 3330-3320 area. So in terms of short-term trading, I still prefer to short gold.
Trading strategy:
Consider shorting gold in the 3360-3370 area, TP: 3345-3335.
