XAUUSD Gold in Overdrive: Awaiting a Critical Pullback for a BuyDaily Chart Analysis
On the daily chart, XAUUSD has surged to new highs, signaling an overextended market as gold rallies far above previous price swings. The price is now trading at a premium, which indicates that much of the bullish momentum may already be priced in. As a result, there is potential for a pullback toward a more attractive entry area. Specifically, a retracement into a discounted zone—ideally below the 50% level of the previous swing—may offer a better long opportunity rather than entering at these extended levels. 📈⚠️
4-Hour Chart Analysis
Examining the 4-hour timeframe reveals more granular price action that aligns with the daily trend. Here, gold displays signs of potential exhaustion with the recent impulsive moves. The market structure hints at the possibility of a short-term setup if the price begins to reverse, aligning with basic Wyckoff theory principles. This suggests that while there might be an interim short play if the reversal is confirmed, the expectation remains that a healthy pullback will eventually pave the way for a new long opportunity once the price finds support. 🔻🤔
Integrating Price Action, Market Structure & Wyckoff Theory
Using elements of Wyckoff theory, it's clear that the current rally has pushed the market into an overbought state.
• The price action indicates a likely initiation of a distribution phase, where selling pressure might temporarily take over.
• A pullback into the discounted zone (particularly under the 50% retracement of the prior range) would be an ideal opportunity to look for a buying setup.
• On the flip side, if the shorter-term setup solidifies, a conservative short play could be considered until signs of accumulation emerge.
This dual perspective underscores the importance of disciplined risk management and monitoring short-term reversals while keeping an eye on the broader trend. 🔍📉💡
Summary of Key Takeaways
XAUUSD is currently overextended with a strong rally to new highs. While the momentum is robust, the premium pricing compared to previous swings suggests caution. A pullback into a discounted zone, specifically below the 50% retracement level, could provide a more enticing entry point for those looking to go long. Concurrently, the 4-hour chart offers potential setups for a short play should price action indicate a reversal. Coupling these observations with Wyckoff theory fundamentals can allow for a balanced, dynamic trading strategy. 🔄
Disclaimer: This analysis is for informational purposes only and does not constitute financial advice. Always conduct your own research and consult with a professional before making any trading decisions.
Xauusdsell

Gold: Directional Break ImminentYesterday’s market remained calm without any significant swings, unlike the strong movements we’ve seen previously. Today, however, appears to be a critical turning point as the market prepares for a directional breakout.
📊 Technical Overview:
Gold is showing signs of retesting the resistance around 3240, while short-term support lies at 3194–3188. If this resistance holds and the price fails to break above, a double-top pattern may form—potentially triggering a major drop between Wednesday and Thursday.
If the price breaks above 3240, there may be around $30 of additional upside, but this is likely to mark the formation of a short-term top, followed again by a decline.
🎯 Key Bearish Target Zones: 3137-3106
Whether it breaks upward or downward, a bearish opportunity is building. Stay patient, follow the price action, and avoid emotional decisions to catch the move at the right moment.

Gold: It may Fall below 3180 todayOver the weekend, Trump announced a pause on tariffs for popular consumer electronics, prompting gold to gap down to 3210 at today’s open;
✅ Our recommended short entries at 3230–3260 are already in profit;
New semiconductor tariff announcements are due during the U.S. session today — the key driver for gold’s next move;
Given the fragile U.S. political/economic backdrop, escalating tariff conflict is unlikely, increasing the chance of bearish impact on gold;
With gold already trading at a premium, any "tariff relief" narrative will likely trigger speculative sell-offs;
If you're holding short positions, consider being patient — avoid premature exits due to emotional reaction to minor pullbacks.
Maintain key short entry zone: 3230 – 3260;
Expect gold to test below 3180 if market sentiment shifts

4/14 Gold Trading StrategiesLast Friday, gold showed a strong unidirectional rally followed by tight-range consolidation at high levels. Our bearish-biased strategy yielded limited profits, and some traders may still be holding trapped positions due to delayed exits. However, structurally, gold’s current posture signals early signs of exhaustion, and a pullback remains likely.
🔥【Key Headlines to Watch】
🇺🇸 The U.S. has suspended tariffs on popular consumer electronics, causing gold to gap down by $30 at today’s open.
🛠️ Trump is expected to unveil details on semiconductor tariffs — a reduction or pause will likely pressure gold lower.
💬 Two Fed officials speak today:
Barkin: Speech on “Navigating Through Economic Fog”
Cook: Remarks on the Fed’s evolving role in the economy.
📊 The NY Fed 1-Year Inflation Expectations report will be released — market expectations are bearish for gold.
🔍【Technical Outlook】
Gold remains near historic highs, trading at an extended premium;
The recent rally has been largely driven by speculative inflows, not solid demand;
If sentiment flips or profit-taking begins, a sharp sell-off could follow;
Structurally, gold appears to be forming a top — favor short setups at elevated levels.
🎯【Trade Setup for Today】
🔻Sell Zone: 3230 – 3250
Look to short near resistance on failed breakouts
🔺Buy Zone: 3128 – 3104
Consider long entries only on healthy pullbacks to strong support
🔄Range Zones:
3220 – 3195
3158 – 3206
Tactical range trading — adapt to intraday momentum shifts

ONGOING TRADE IN XAUUSD(GOLD)🚨 **XAUUSD – Major Rejection Incoming?** 🚨
📉 *Golden Setup Alert – April 14, 2025*
Gold (XAUUSD) is currently showing **clear signs of exhaustion** at the top of a well-respected ascending channel on the 4H chart. After a sharp bullish rally, price is now facing **resistance near $3,235**, failing to break higher and showing early signs of a potential reversal. 👀
### 🔍 Technical Breakdown:
- 🔺 **Ascending Channel:** Price has been respecting the rising channel structure — higher highs & higher lows.
- 📌 **Rejection at Upper Boundary:** The latest candle suggests **bearish pressure** right at the top of the channel.
- 📉 **Expected Retracement:** The projection indicates a move toward **$3,135**, then potentially **$3,100** — a key demand zone and midpoint of the channel.
- 🔄 **Break Below $3,135** would confirm bearish momentum.
---
### 📲 *Trader’s Takeaway:*
Now is the time to **watch closely for confirmation** of a reversal. If bearish momentum kicks in, we could see a clean short opportunity all the way to the mid-channel zone. Great R:R setup loading!
💡 *Risk Management is key — patience pays profits!*

Risks gradually accumulate, and short gold in batchesAt present, the highest price of gold has reached around 3244, but it soon fell back to below 3240; and the PPI data is obviously bullish for gold, but gold has not shown a significant upward fluctuation, indicating that as gold rises sharply, market sentiment tends to be more cautious, so that liquidity is insufficient. So from this point of view, gold still has a need for a correction!
In the past three trading days, the increase in gold has reached $270. So even if gold remains strong at present, we should not blindly chase more gold. On the contrary, we can still gradually establish short positions in batches. As long as we strictly control the number of transactions in the transaction, we don’t have to worry too much about the transaction risk!
Let us wait patiently for the market to gradually accumulate risk sentiment. Once it accumulates to the critical point, it only takes one opportunity for gold to collapse soon.

SHORT ON GOLD (XAU/USD)Gold has found a ceiling and has given a bit of a double top with a change of market structure from up to down.
Its currently retesting the supply area that provided the choc (change of character)
I will be selling gold to the next support level looking to make a $50 move which is 500 pips.

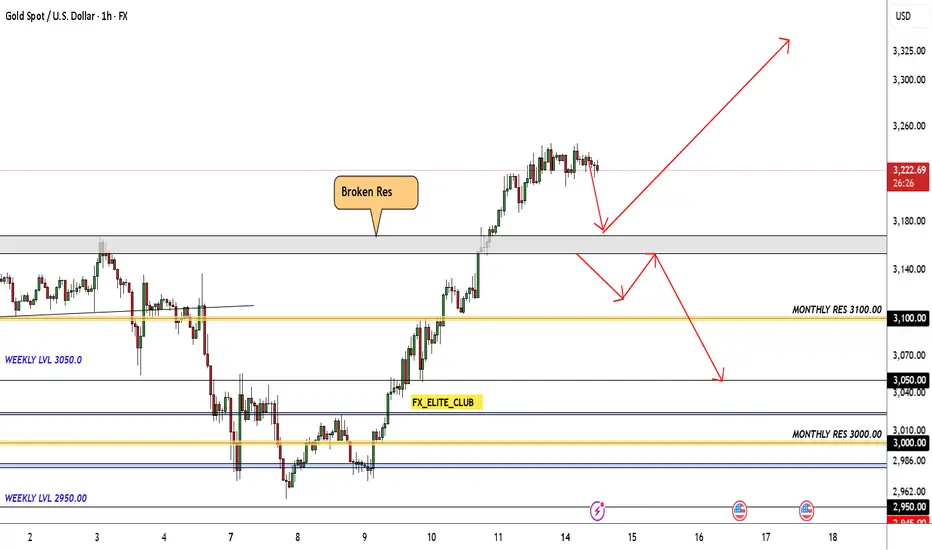
GOLD 2 Excepted Scenarios Very Clear , Which One You Prefer ? Here is my opinion on GOLD Chart , the price broke the highest Res , and continue to upside , so i think we have 2 ways in this pair right now , if the price go back to retest the broken res area and give us a good bullish Price Action we can enter a buy trade with smal lot size cuz the price at very high price , and if we have a clear closure below it , we can enter a sell trade with 500 pips target .
Gold's main rise is not over yet, long is still the core strategHeading into next week, we maintain a bullish medium-term outlook on gold, with a continued preference for trend-following long positions.
Although short-term bearish attempts persist, the broader upward structure remains intact, with pullbacks presenting tactical buying opportunities.
Key support is observed around $3,200/oz, which serves as a strategic level for initiating low-risk long entries within the ongoing uptrend.

XAU/USD is about to reach the 3300 - point level.The long-term upward trend remains unchanged. Tariffs are still a major variable causing significant fluctuations in gold.
U.S. Tariff Policies
Since April 9th, the United States has imposed tariffs ranging from 10% to 25% on goods from China, the European Union, Canada, and other regions, covering key sectors such as automobiles, steel, and semiconductors.😒
Countermeasures of Various Countries
China: On April 4th, China announced that it would impose a 34% tariff on U.S. goods starting from April 10th. On April 9th, the tariff rate was further increased to 84%, covering all U.S. goods.😠
The European Union: Announced that it would impose a 25% tariff on U.S. motorcycles, diamonds, and other goods starting from May 16th.😤
Canada: Imposed a 25% retaliatory tariff on U.S. automobiles on April 9th, but exempted auto parts.😏
At present, the rise of gold is still driven by the demand for a safe haven. It remains uncertain whether the 104% tariff will actually be implemented. Once relations deteriorate, it will truly be bullish for gold again. In the short term, this is definitely something that needs to be closely monitored.🤔
This upward movement has led to the clearing of many traders' accounts or significant losses 😫. You can follow my signals and gradually recover your losses and achieve profitability 🌟.
💰💰💰 XAUUSD 💰💰💰
🎯 Buy@3220 - 3230
🎯 TP 3270 - 3300
Traders, if you're fond of this perspective or have your own insights regarding it, feel free to share in the comments. I'm really looking forward to reading your thoughts! 🤗

Gold Shows Downward Correction, Short Strategy Timely EnteredIn the previous trading signal, it was advised to take profits around $3235. Based on the latest market analysis, gold prices are expected to experience a downward correction. Therefore, it is recommended to open short positions around $3230. Investors should closely monitor market trends and adjust stop-profit levels in response to price fluctuations to secure profits. Please remain flexible and responsive to market changes, capturing every trading opportunity with precision.

Gold Prices Decline, Short Strategy Successfully Captures ProfitCurrently, gold prices are showing a clear bearish trend, previously fluctuating around $3240. Based on market predictions, there is a potential for further downward movement in gold. A short position was suggested around the $3240 level, and as the market corrected, gold prices have indeed dropped, allowing short-positioned investors to lock in profits. Congratulations to those who successfully capitalized on this short opportunity and secured gains. Stay alert to market developments and carefully adjust your stop-profit levels to ensure the stability of your returns.

Gold's safe-haven demand surgesThis week, concerns over a global economic slowdown have swept across Wall Street, becoming the dominant market sentiment. In this context, U.S. President Trump's erratic messaging on tariff policies has triggered a panic sell-off in U.S. stocks, bonds, and the dollar, highlighting gold's position as a safe-haven asset. Gold prices have surged sharply, breaking through all previous resistance levels and maintaining an upward trend. Given the ongoing risk-off sentiment, the bullish momentum in gold remains strong, and the market may continue to trend higher in the near term.
In this market environment, it is recommended that investors take long positions near $3220 and consider taking profits around $3230 to fully capitalize on the current uptrend in gold. For additional trading signals, Please stay tuned.

Gold Breaks $3240, Shorting Opportunity EmergesGold prices have now surged to around $3240, continuing the recent strong upward momentum. Based on the previous trading signal, a long position at $3220 was suggested; however, due to the high volatility, many investors may have missed the opportunity to go long at that level. At this point, with prices approaching $3240, it may be an opportune time to establish short positions, with a target profit around $3225. Please note that this is just personal advice, and actual trading decisions should be made with attention to changes in key price levels.

4/11 Gold Trading StrategyFresh High Above 3170 – Momentum Continues, but Chasing Longs Is Risky
Gold delivered a strong one-sided rally yesterday, rising from around 3078 to above 3170, setting a fresh short-term high. While CPI and jobless claims data were modestly bullish, most of the rally occurred before the data release, suggesting that the move was primarily technically driven rather than fundamentally triggered.
As we anticipated yesterday, the price did reach above 3170 , and as clearly stated, we did not recommend chasing long positions at those highs. This view remains unchanged today.
🔍【Technical Insights】
The recovery from 2955 back to 3160+ took just 2 sessions, versus 4 sessions for the prior drop from 3167 — a clear sign of momentum dominance.
The daily chart shows two strong bullish candles, typically a sign of follow-through potential.
However, new highs reached under this structure tend to attract profit-taking and possible pullbacks.
If a technical correction occurs, look to 3143–3128 as a meaningful support zone for long opportunities.
🎯【Today's Gold Trade Setup】
🔻Sell Zone: 3188 – 3215
Look for short entries near resistance after overextension
🔺Buy Zone: 3134 – 3112
Wait for a healthy pullback to consider long positions
🔄Range Zone: 3178 – 3143
Flexible trading range — favor quick in/out trades in the zone

XAUUSD hit a new record high!calm downDue to the influence of various factors, the price of gold has reached a new high and has already set a new historical record. Will it make an attempt to break through the 3200 mark?
Perhaps we should step out of the madness of the gold price and observe the market calmly. I think it will fluctuate within a certain range in the short term, and we can make a profit by choosing to go long or short at the appropriate price points.
XAUUSD trading strategy
sell @ 3165-3170
sl 3180
tp 3155-3160
If you approve of my analysis, you can give it a thumbs-up as support. If you have different opinions, you can leave your thoughts in the comments.Thank you!

GOLD At Interesting Res Area , Should We Sell Now Or Wait ?Here is my GOLD Chart and this si 1H Time Frame , i`m looking to sell it if i have a bearish price action to confirm that the price will go down , i think the price will go up a little to make some wicks and take all stop losses before going down again maybe tomorrow, so i think we will see some stop hunts before the price going going down for 500 pips and then move again to upside very hard .

Gold: CPI Data Trading ViewsToday's signals for XAUUSD / BTCUSD / GBPUSD all hit their targets!
Congrats to everyone who followed—great profits all around!
🕒 Reminder: CPI data will be released in 1.5 hours.
Before that, we may see:
A quiet, ranging market, or
A pre-release pricing-in scenario that leads to sharp volatility ⚠️
Trading Suggestions:
✅ If you want to avoid unnecessary risk, it’s better to pause trading and wait for the data release
✅ If you're holding positions, please:
Manage your risk carefully
For large positions, consider partial closing or adding SL
Post-CPI Strategy Outlook:
Price has reached key resistance zones
If the data is bullish, further upside may be limited due to:
Proximity to recent highs
Remaining selling pressure in the market
Therefore, focus on:
High-level short entries or low-level long entries
Avoid blindly chasing the market—don’t go long at the top or short at the bottom
To sum it up:
Control your emotions, manage your positions wisely.
The 30 minutes after the CPI release will separate winners from losers!

Gold's Downtrend PersistsGold's Bearish Outlook Continues Despite Temporary Upside Spike
Market Overview:
The overall outlook for gold remains bearish, even though the market recently experienced a surprising and sharp upward movement. While a deep correction was anticipated and in line with prior expectations, the nature and timing of the recent surge raised some eyebrows among analysts and traders alike.
The unexpected bullish reaction came shortly after former U.S. President Donald Trump announced a 90-day suspension on reciprocal tariffs—a development that typically would not warrant such a dramatic price rally in gold. Normally, easing geopolitical or economic tensions would dampen safe-haven demand, causing gold to retreat. In this case, however, the opposite occurred, which suggests the possibility of non-fundamental drivers at play, potentially even artificial market influence or manipulation.
Technical Outlook:
Despite the sudden upward movement, gold’s larger technical structure has not changed significantly. The overall trend remains bearish unless we see a sustained breakout above the 3167 resistance level. A clean breach above that threshold would be uncharacteristic based on current fundamentals and could indicate external interference or speculative overreaction rather than a genuine shift in sentiment or macroeconomic conditions.
The price action continues to favor the bears, with lower highs and lower lows still forming on the larger timeframes. Until there’s clear evidence to the contrary, any rallies should be viewed with skepticism and treated as potential selling opportunities rather than the start of a new bullish trend.
Key Support Zones:
Looking at potential areas where gold may find some temporary footing, the following support levels should be closely monitored:
3054 – Minor support; could serve as a short-term pause point.
3000 – A psychological level and round number that often acts as a magnet for price action.
2925 – More significant historical support zone with prior buying interest.
2840 – Deeper support, aligning with the longer-term bearish trajectory.
Conclusion:
In summary, while gold has shown a sudden upward burst, the broader picture remains cautious. The technical indicators, market context, and recent price behavior all point toward a continuation of the downtrend unless key resistance levels are convincingly breached. Traders are advised to remain vigilant, avoid emotional reactions to short-term volatility, and refer closely to technical signals when making decisions.
The chart provides further clarity on this setup—feel free to review it for a more visual representation of the analysis.
Thank you for reading, and best of luck in the markets!

4/10 Gold Trading StrategiesGold maintained a bullish tone yesterday, with prices recovering steadily toward the 3100 level, offering smooth trade opportunities and favorable returns.
However, today presents a significantly more complex trading environment due to several high-impact events:
🇺🇸 US CPI (MoM + Core CPI)
📝 Initial Jobless Claims
🗣️ Fed speakers including Barkin and Schmid
Technically, gold is now at a crucial inflection point , where market interpretation diverges:
If this is merely a corrective rebound in a broader downtrend , the move may be near completion.
If instead it's a healthy retracement in an ongoing uptrend, we could be in the middle phase of a continued climb.
Given the mix of technical ambiguity and fundamental uncertainty, a neutral and reactive trading stance is essential today.
🎯【Recommended Strategy & Positioning】
Trade Against Emotional Swings
Avoid chasing price during high-volatility news. Look to sell after sharp rallies and buy after sharp dips , minimizing exposure to emotional trades.
Key Zone Analysis – Watch the Trapped Orders
3128–3158: Zone where many long positions may be trapped — watch for selling pressure.
3016–2978: Former short-entry zone — potential area for long-side reactivation if retested.
📌【Today's Key Trade Zones】
🔻 Sell Zone: 3143 – 3168
🔺 Buy Zone: 3013 – 2979
🔄 Flexible Zone 1: 3109 – 3058
🔄 Flexible Zone 2: 3045 – 3013
❗ Above 3170, focus only on short positions — avoid chasing long trades at elevated levels.

Gold: Watch for Selling OpportunitiesGold remains under pressure around the 3100 level, where previous trapped buyers are creating significant selling pressure. The heavier resistance zone lies between 3127–3146, so if you’re holding long positions, don’t be greedy — this is a crucial area to watch!
Tomorrow during the U.S. session, we’re expecting major economic data and headlines. The market will likely see high volatility, and instead of a clear one-way trend, there’s a higher chance of a two-way sweep (both up and down).
Trading Advice for Tomorrow:
Avoid chasing price or getting caught in emotional trades.
Control your position size — even if you end up holding during turbulence, a small and managed position won’t hurt you. You might even come out profitable.
But if you enter with full margin and no risk control, the result could be heavy losses or even blowing your account. This is my honest advice!
During the Asian and European sessions, the technical outlook favors short positions. Consider selling around the 3103–3123 zone, with support levels at:
3078 / 3066 / 3051 / 3027 / 3011
I will release updated strategies for the U.S. session tomorrow based on key data releases. Stay tuned and feel free to reach out if you have any questions.
Good luck and trade safe!

4/9 Gold Trading Strategies
Gold opened with a mild bullish tone yesterday but faced resistance near 3018 , pulling back briefly before attempting a second push toward 3023 . However, the rally failed to sustain, and price returned near the opening level. Compared to recent sessions, yesterday marked a clear contraction in volatility, suggesting either a bottoming formation or a setup for a directional breakout.
From both candlestick structure and indicator alignment, the market appears primed for a potential bullish push today. If momentum builds as expected, a test of the 3037–3043 resistance zone is highly probable.
On the downside, 2976 remains the key initial support , followed by 2952 , which was the previous local low.
On the fundamental side, no major data releases are scheduled today. However, updates related to tariff policies will likely be the main market driver, and could trigger intraday volatility.
🎯 【Trade Setup for Today】
🔻Sell Zone: 3047–3066
🔺Buy Zone: 2968–2942
🔄Flexible/Scalping Zone: 2978–3023

4/8 Gold Trading StrategyYesterday, gold dipped to the 2950 support zone, still under bearish pressure. However, the market did not enter into an extreme one-sided sell-off. Instead, an intraday rebound suggested that short-term buying interest is beginning to emerge.
Following last week's and yesterday’s sharp correction, the 1-hour technical structure has started to show early signs of a potential bottom. While a retest of the 2960–2950 area in the near term cannot be ruled out, the broader price action now supports the technical conditions for a medium- to short-term rebound.
Currently, gold is stabilizing around the 2980-2960 level. Even if additional bearish pressure emerges, the maximum downside support is expected in the 2919–2888 range. This suggests a likely transition into a low-level consolidation and base-building phase, rather than a continued steep decline.
From a technical perspective, the 3100 zone is a key corrective target for this pullback. The market may gradually move higher to complete a structure recovery, offering a limited-risk, clearly defined opportunity for the bulls.
📌 Key intraday resistance levels:
3018 → 3037 → 3058 → 3079
📌 Trading Strategy for Today:
🟢 Buy Zone: 2976 – 2948
🔴 Sell Zone: 3048 – 3062
🔁 Scalp/Range Zone: 3032 – 2998
