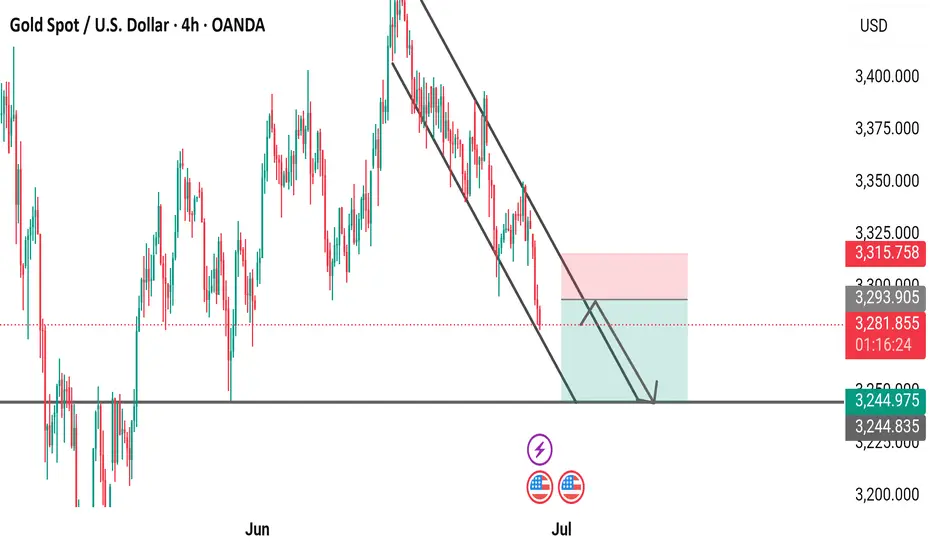
Gold Spot / U.S. Dollar - 4 Hour Chart (OANDA)4-hour chart from OANDA shows the price movement of Gold Spot (XAUUSD) against the U.S. Dollar, with the current price at 3,282.135, reflecting a decrease of 45.685 (-1.37%). The chart includes a descending trendline, support and resistance zones (highlighted in pink and teal), and key price levels ranging from 3,244.835 to 3,400.000. The analysis suggests a potential downward movement as the price approaches a support zone near 3,244.975, with indicators like the U.S. flag and lightning bolt possibly signaling significant market events or volatility.
Xauusdsell
6/25 Gold Analysis and Trading ViewGood morning, everyone!
Gold experienced a sharp decline yesterday. Technically, the conditions for a rebound are in place, but since a solid bottom structure has yet to form, a retest to the downside is likely during today’s session.
Key levels to watch:
Resistance zone: 3336–3348
Support zones: Primary support at 3313–3303, with additional support around 3296–3282
Today’s overall strategy remains buying on dips as the primary approach, with short opportunities near resistance as a secondary option.
Key scenario to monitor:
If the price drops to around 3280 but fails to rebound toward 3336, and the daily close ends below 3300, then the buy-on-dip strategy will likely continue into tomorrow.

Gold: Resistance Validated, Short at 3340-3350 Tomorrow📈 Gold Trading Recap & Tomorrow's Strategy: Resistance Holds, Short Opportunities Persist
💎 Today's newly updated live short strategy hit the TP target successfully! As mentioned earlier, when gold failed to break the support level, we anticipated it to range around 3330—today's trades were precisely centered on this logic. The 3350 resistance was also validated firmly during the session.
💎 Expect further upside in tomorrow's Asian session—recommend continuing short positions within the 3340-3350 range 🚀
🚀 Sell@3350 - 3345
🚀 TP 3335 - 3325 - 3315
Accurate signals are updated every day 📈 If you encounter any problems during trading, these signals can serve as your reliable guide 🧭 Feel free to refer to them! I sincerely hope they'll be of great help to you 🌟 👇

XAUUSD:Today's trading strategy
On Tuesday, the news that Trump announced a ceasefire between Iran and Israel dampened the risk aversion sentiment. Subsequently, the news that expectations of interest rate cuts had slowed down led to a further decline in gold prices. During the trading session, it once fell below the 3,300 mark. After the impact of the news weakened, it eventually rebounded to around 3,323, approaching the position where we first entered the market yesterday. Currently, there is no logic in the market. From a technical perspective, The resistance level above is at 3340-45, and the support level below is at 3305-10. We can conduct transactions around this range
Trading strategy:
SELL@3340-45
TP:3310-04
BUY@3305-10
TP:3335-40
More detailed strategies and trading will be notified here ↗↗↗
Keep updated, come to "get" ↗↗↗

XAUUSD:Short sell at 3340-45
Today's trading needs to narrow down the range. There are signs that the center of gravity below is gradually moving upward. During the Asian session, the highest point reached around 3343. Friends who have already bought short positions here can wait for 3320-25 to take profits and exit. Those who haven't bought can wait for 3340-45 to short, with the target also being 3320-25
Trading strategy:
SELL@3340-45
TP:3320-25
It can be considered to go long when it reaches around 3320-25
More detailed strategies and trading will be notified here ↗↗↗
Keep updated, come to "get" ↗↗↗

6/26 Gold Analysis and Trading ViewGood morning, everyone!
Yesterday, gold rose to around 3336 before pulling back, then revisited the same level again. The buy-on-dip strategy performed well, delivering solid profits.
At today’s open, prices have moved slightly higher but remain near resistance. Technically, there’s potential to test the 3350 area, and if the move is strong, a rally toward 3370 is also possible.
If gold reaches this zone, it may present a favorable short-term selling opportunity. Therefore, today's trading strategy should focus on range-based trading between 3326-3368, selling near resistance and buying near support.
Key levels to watch:
Resistance: 3348–3352
Support: 3326–3318
Lastly, be mindful: if a trending move emerges, adjust your strategy accordingly and avoid counter-trend trades. Stay flexible and manage risk wisely.

Gold Breakout Done New Short Entry Valid To Get 200 Pips !Here is my opinion on gold at he moment , in 15 mins T.F wr have a fake breakout but 3343.00 forced the price to go down which is a great res for this pair and we have avery good bearish price action and good closure below my res level 3341.00 so it`s my num 1 place to enter a sell trade if the price go back to retest it , and if not , 3383.00 will be my best place to sell it .

GOLD Made H&S Reversal Pattern , Chance To Sell To Get 200 PipsHere is My 15 Mins Chart On Gold and we have a very good reversal Pattern , Head & Shoulders , we have a 15 mins closure below neckline 3322.00 we can enter a sell trade and targeting at least 100 pips as scalping , we can enter after waiting the price to retest neckline and then enter . and the price can reach 3300.00 to 3296.00 again .

GOLD Made Double Top Reversal Pattern , Ready For Sell ?Here is My 15 Mins Chart On Gold and we have a very good reversal Pattern , double Top , if we have a 15 mins closure below neckline 3326.00 we can enter a sell trade and targeting at least 100 pips as scalping , we can enter direct if you are aggressive trader or if you not you can wait the price to retest neckline and then enter .

XAUUSDHello traders.
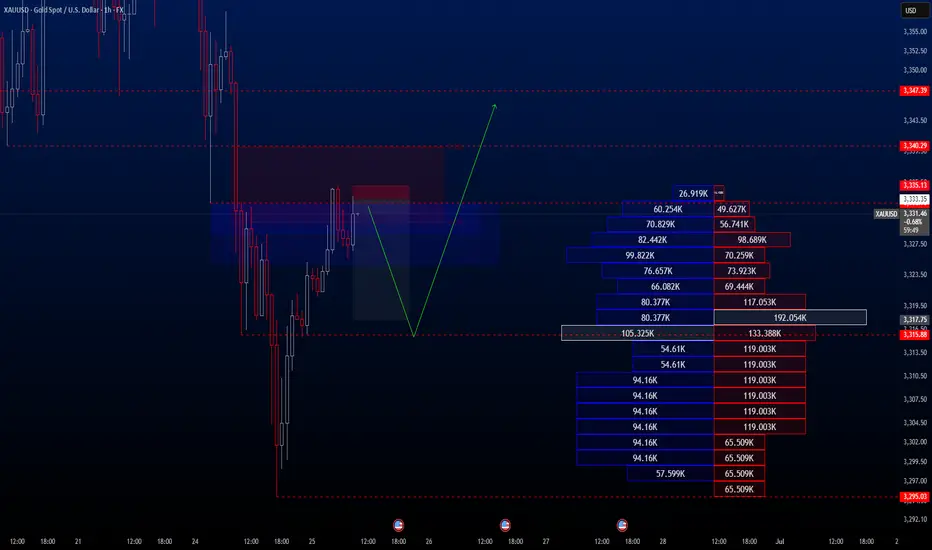
I’ve spotted an exceptional sell opportunity on the XAUUSD pair—one of those setups that come around once in a hundred years! The trade offers a Risk-to-Reward ratio of over 1:8, so I thought it would be valuable to share it with you.
Please adjust your risk parameters accordingly before entering the trade.
🔍 Trade Details
✔️ Timeframe: H1
✔️ Risk-to-Reward Ratio: 1:8.70
✔️ Trade Direction: Sell
✔️ Entry Price: 3333.35
✔️ Take Profit: 3317.75
✔️ Stop Loss: 3335.13
🕒 If momentum fades or the price consolidates in a tight range, I will keep this trade open only until 23:00 (UTC+4). After that, I’ll close it manually—whether in profit or loss—depending on how price action evolves.
🔔 Disclaimer: This is not financial advice. I’m simply sharing a trade I’ve taken based on my personal trading system, strictly for educational and illustrative purposes.
📌 Interested in a systematic, data-driven trading approach?
💡 Follow the page and turn on notifications to stay updated on future trade setups and advanced market insights.
Gold Trading Analysis and Strategies for Sideways Decline MarketAfter Trump announced a comprehensive ceasefire agreement between Israel and Iran, market risk aversion significantly cooled, and gold prices plunged by more than $30 in early trading. Although the stability of the ceasefire agreement remains doubtful, the rebound in risk appetite has dominated market trends, with stock markets rebounding, oil prices falling, and demand for safe-haven assets declining.
From a technical perspective, the moving average system on the daily chart of gold shows an intertwined state, indicating a relative balance between bulls and bears. The current key resistance above is near 3350, which is an important psychological threshold. If effectively broken, it may open up upward space; the lower support is focused on the 3285-3290 range, which is the lower edge of the May consolidation platform. A break below this level may intensify correction pressure. The loss of the midline in the 4-hour chart further confirms the short-term weak structure, providing technical support for the downward trend.
XAUUSD
sell@3330-3340
tp:3320-3310
buy@3285-3290
tp:3310-3320
Investment itself is not the source of risk; it is only when investment behavior escapes rational control that risks lie in wait. In the trading process, always bear in mind that restraining impulsiveness is the primary criterion for success. I share trading signals daily, and all signals have been accurate without error for a full month. Regardless of your past profits or losses, with my assistance, you have the hope to achieve a breakthrough in your investment.

Will the 3300 support hold today?Due to the sudden ceasefire agreement between Iran and Israel today, the gold market quickly flipped from bullish to bearish — when gold tested the 3300 support level just now, it rebounded near 3315 📈.
It may challenge the 3290-3300 support range again later: if it effectively breaks below, the next target is the strong support at 3265, and it may eventually dip to 3200 before starting a rebound 🔄.
If the breakout fails, it may consolidate near 3330, waiting for further market guidance 📊
⚡️⚡️⚡️ XAUUSD ⚡️⚡️⚡️
🚀 Sell@3330 - 3320
🚀 TP 3310 - 3305

XAUUSD Beginning of a Trend Reversal? Bearish Move IncomingGold is showing signs of potential downside pressure on the 4-hour chart. After a rejection from the upper volatility band and a failure to sustain bullish momentum above the dynamic EMA cloud, price has rolled over and is now trading below the midline support area.
🔻 Bearish Structure Developing:
Price rejected strongly from the upper gray zone (Resistance band).
A new lower high has formed, aligning with bearish market structure.
Candles are trading under the red-to-blue transition EMA ribbon, indicating increasing bearish sentiment.
🎯 Trade Setup:
Entry: Near 3,365
SL: Above the recent high near 3,406
TP: Targeting the lower band support around 3,300 – 3,323

GOLD 2 Best Places For Sell Very Clear , Don`t Miss 300 Pips !Here is my opinion on Gold at the moment after the price moved very hard to downside as i mentioned in the last update , now we have a very good 2 places to sell it again , the first one @ 3326.00 , it`s a very good place to sell it cuz it was a very good support and the price break it and now it will play as a good res so we can sell from it , and if the price go higher we can sell from area between 3350 : 3345.00 , it will be a great place to sell it also , and if the highest place who force the price to downside we can add another sell entry from 3326.00 if we have a daily closure below it .

Gold Take All Stop losses,Are You Ready To Sell To Get 300 Pips?Here is my 1H Gold Chart and this is my opinion , the price opened this week with massive wick to upside to take all stop losses and then moved to downside very hard and aggressive , we have a very good Res that we sell from it last week 3377.00 , it`s still strong and forced the price many times to respect it so it still my fav level to sell it again today if the price touch it and give me a good bearish price action to confirm the entry and we can targeting 300 pips at least . if we have a daily closure above my res then we will think about buying instead of selling , but until now i`m looking to sell it from the level i mentioned .

Gold is about to break through 3400! On June 21, 2025 local time, U.S. President Trump announced that the U.S. had launched strikes against three Iranian nuclear facilities—Fordo, Natanz, and Isfahan—using six B-2 stealth bombers 😲. This move marked the formal intervention of the U.S. in the Middle East conflict, prompting the UN Security Council to convene an emergency meeting immediately. This underlies the core logic of our sustained "long gold" strategy last week: the geopolitical situation in the Middle East harbors the risk of escalating at any moment 🤯. If the Security Council fails to roll out direct solutions, gold, as a safe-haven asset, may continue its upward trajectory driven by market panic 📈.
The UN Security Council meeting on June 23, 2025 failed to break the deadlock, and the Middle East situation remains highly fluid. Given that the U.S. is highly unlikely to implement any solutions proposed by the Security Council, the regional crisis may deteriorate further 🚨
Gold is about to break through 3,400! 🌟
Accurate signals are updated every day 📈 If you encounter any problems during trading, these signals can serve as your reliable guide 🧭 Feel free to refer to them! I sincerely hope they'll be of great help to you 🌟 👇

6/24 Gold Analysis and Trading OutlookGood morning, everyone!
Gold closed yesterday with a T-shaped candlestick. Although there was an intraday recovery after briefly breaching the MA20, the closing price remained below the MA5, indicating continued pressure on the upside.
Today’s opening saw a direct drop in price, suggesting a potential break below key support. Two important levels to monitor today:
Whether the closing price stays above 3355
Whether the intraday support at 3328 holds
If 3328 breaks down, the 3300 level may become the next major battleground between bulls and bears.
Driven by geopolitical news, gold has shown sharp volatility over the past two days. While this increases trading risk, it also presents more opportunities. From a technical perspective, today’s strategy should prioritize selling on rebounds, with buying at lower levels as a secondary approach. As always, stay disciplined and manage risk effectively.

GOLD Bearish Breakout!
HI,Traders !
#GOLD is trading in a
UPtrend and Broke our of the bearish
Wedge pattern then made
A retest and is going down
Now so we are bearish
Biased and we will be
Expecting a further move down !
Comment and subscribe to help us grow !

XAUUSD Technical Analysis – June 24, 2025On June 24, 2025, XAUUSD (spot gold) continues to face significant bearish pressure after failing to hold above the key resistance zone around 3,383 – 3,400 USD/oz. This area marks a confluence of the 0.5–0.618 Fibonacci retracement levels and a high-volume distribution zone, signaling strong supply dominance in the short term.
Technical Structure and Fibonacci Analysis
- The recent swing high was established at 3,451 USD, completing a bullish wave from the low of 3,223 USD.
- Price was unable to break through the 0.618 Fibonacci retracement at 3,399 USD, leading to a sharp pullback.
- The current structure suggests the formation of a potential head and shoulders pattern, which would confirm if the market breaks below the 3,300 USD support zone.
Key Support and Resistance Levels
- Major resistance: 3,383 – 3,400 USD (Fibonacci 0.5–0.618 zone, high-volume area)
- Immediate support: 3,300 – 3,310 USD (historical reaction zone and 0.618 retracement of the recent bullish leg)
- Deeper support: 3,223 USD – previous swing low and a key target if the bearish trend confirms
Potential Scenarios
- Bearish scenario: If the price sustains below 3,350 USD and decisively breaks 3,300 USD, it may signal the start of a medium-term downtrend, with targets near 3,200 USD or even lower.
- Bullish scenario: A bounce from the 3,300 USD support could trigger a short-term recovery, but traders should closely watch the reaction near the 3,383 – 3,400 USD resistance zone to assess supply pressure.
RSI and Momentum Indicators
- The 14-period RSI is trading below the 50 level and pointing downward, indicating that bearish momentum remains dominant.
- The RSI has also crossed below its moving average, reinforcing the negative outlook.
Ps: XAUUSD is currently in a critical phase as it tests the 3,300 USD support level. A break below this level could confirm further downside and strengthen the bearish trend. Traders are advised to remain cautious, wait for clear price action confirmation, and apply strict risk management as volatility increases.

Short gold, gold still has at least one chance to pullback!At present, gold has rebounded to the 3370-3380 area again, which largely confirms that 3350-3340 is the bottom area at this stage. However, what we still cannot underestimate is that even with the support of safe-haven, gold has still failed to effectively break through the resistance of 3385-3395-3405 area, and even fell under pressure several times. To a certain extent, it weakened the willingness and confidence of bulls, so it aggravated the trend of wide fluctuations in the short term. During this period, we must pay attention to the rhythm change of gold.
According to the current bullish strength of gold, I think gold does not have the conditions to directly break through the heavy resistance of 3385-3395-3405 area for the time being, so gold still needs at least one retracement expectation, so I think we can still try to short gold in the 3375-3385 area, but the retracement expectation should not be too large, 3365-3355 is enough!

Gold Market Analysis and Trading Recommendations for TodayLast Friday, the overall gold price on the technical side continued to be under pressure, retracing and oscillating in adjustment. Eventually, it stabilized at the 3340 level before the close, rebounding and oscillating to close. The daily K-line reported an oscillating digital K. The overall gold price continued the recent suppressed oscillating consolidation.
However, over the weekend, the US military attacked Iranian nuclear facilities, intensifying geopolitical tensions in the Middle East, and market risk-aversion sentiment heated up. This morning, the gold price gapped up, piercing the 3390 level, reaching a high of around 3398 before retracing and falling into oscillation.
In the short term, it is highly probable that the gold price will continue to operate in a wide-ranging oscillating interval between long and short positions, continuing to trade time for space. Although the gold price opened high and moved low, it still has not broken the long-term trend channel. Looking for opportunities to go long on retracement is also the current trend.
From the current market trend, today's technical support on the downside focuses on around 3350 - 3345, and the short-term resistance on the upside is around 3380 - 3385, with a key focus on the 3395 - 3405 level. For the day, first, rely on this interval to maintain the main tone of participating in the long - short cycle. For positions in the middle range, always observe more and trade less, and be cautious about chasing trades. Patiently wait for key points to enter the market.
XAUUSD
buy@3345-3355
tp:3370-3390-3410
Investment itself is not the source of risk; it is only when investment behavior escapes rational control that risks lie in wait. In the trading process, always bear in mind that restraining impulsiveness is the primary criterion for success. I share trading signals daily, and all signals have been accurate without error for a full month. Regardless of your past profits or losses, with my assistance, you have the hope to achieve a breakthrough in your investment.

XAUUSD and USOILHesitation Geopolitical factors have led to the escalation of relations between several countries. The Middle East is in chaos. Although this is a trading market, the relationship between the two is too close. This is why the Asian market XAUUSD reached a high of 3400.
But it is not stable. Because after the news that stimulated the rise in gold prices over the weekend, there were some negative news. For example, peace talks, time differences, negotiations and other factors have eased the tense atmosphere. Then the gold price fell with the trend, reaching a low of 3347.
From the overall situation, the market still has the momentum to rise in the short term. But this depends on Iran's response. Including the impact of the Strait of Hormuz. This is the key factor in the rise or fall of oil prices. Investors with larger funds can arrange long orders in advance.
The view on XAUUSD is to buy at low levels. The impact of geopolitics is too huge. On the basis of interest rate cuts, buying is the key to profit. But everyone's financial situation is different, so when trading, remember to control the position ratio. Prevent trading errors from leading to account liquidation.

Next Week Gold Trend Forecast & Trading TipsDuring this round, the price was sold off sharply from the historical high of 3,500 to 3,120 before rebounding. After consecutive rallies, it faced pressure and fell back to 3,452 due to the fading of market risk aversion. On Friday, it rebounded from a low of 3,340. The daily chart recorded a consolidative bearish candle, with the K-line combination leaning bearish, while the 4H chart showed signs of stopping the decline.
In the short term, it is expected to consolidate below 3,400 next week. For the medium term, attention should be paid to the geopolitical crisis and the Federal Reserve's July interest rate decision. A breakthrough node will be ushered in after confirming the resistance above 3,400.
On the short-term 4-hour chart, the support below is focused around 3,340-45, and the short-term resistance above is around 3,380-85. The key focus is on the suppression at the 3,400-05 level. The overall strategy of going long on pullbacks within this range remains unchanged. For medium-term positions, it is advisable to stay on the sidelines, avoid chasing orders, and patiently wait for entry at key levels.
Investment itself is not the source of risk; it is only when investment behavior escapes rational control that risks lie in wait. In the trading process, always bear in mind that restraining impulsiveness is the primary criterion for success. I share trading signals daily, and all signals have been accurate without error for a full month. Regardless of your past profits or losses, with my assistance, you have the hope to achieve a breakthrough in your investment.
