3236 becomes the dividing line between long and shortGold 3243 is the watershed between long and short positions. As long as this point is not broken, shorting at highs is still the main theme. You can continue to arrange short positions based on the suppression of 3236. The 3195-3190 area below is an important support. If the market retreats to this area, you can consider going long based on the actual situation and seize the opportunity of long-short conversion.
Xauusdsetup

#XAUUSD: Major Update 01/05/2025, Read Description! Gold has dropped over 700 pips since yesterday evening, suggesting further price correction. This is primarily due to strong US dollar data indicating potential correction in DXY Index prices. Additionally, there are speculations that the US has reached out to China for trade talks, although this has not been confirmed. Today and tomorrow are major trading days, with significant news expected to shape gold prices.
For now, you can monitor the prices or take entry if they reach your chosen risk management area. The decision to enter or exit is entirely up to your analysis.
Good luck and trade safely!
Thank you for your unwavering support! 😊
If you’d like to contribute, here are a few ways you can help us:
- Like our ideas
- Comment on our ideas
- Share our ideas
Team Setupsfx_
❤️🚀

XAUUSD: Intraday Bullish Move Up To $3400! The OANDA:XAUUSD price has shown strong bullish momentum, indicating it will likely continue to rise above $3400. However, the price is currently volatile and is likely to remain so.
Good luck and trade safely!
Thank you for your unwavering support! 😊
If you’d like to contribute, here are a few ways you can help us:
- Like our ideas
- Comment on our ideas
- Share our ideas
Team Setupsfx_
❤️🚀

GOLD Locally Overbought!
HI,Traders !
GOLD is trading in a
Strong uptrend but the
Pair is locally overbought so
After the retest of the
Horizontal resistance level
Of 3350.56 from where
We will be expecting a
Local bearish correction !
Comment and subscribe to help us grow !

4/30 Gold Trading SignalsGold showed limited movement yesterday and did not enter either of our predefined major trading zones, leading to minimal profits.
As of now, the price continues to consolidate. A larger movement is likely to occur during the U.S. session following key economic data.
Until then, consider short-term range trading between 3330-3290.
📌 Why Today’s Data Matters
Gold has been trapped in a tight range for several sessions, and a directional breakout is imminent.
Today’s data release will likely dictate that direction, so it is crucial to stay alert.
✅ Data-Driven Strategy:
If data is bullish (gold rallies):
Avoid chasing the initial breakout. Wait for the first spike to settle, then short the retracement, with a TP of less than $10.
If bulls remain strong, the retracement should stay under $20. Once short positions are closed, watch for confirmation to go long.
If data is bearish (gold drops):
If price doesn't reach the lower buy zones(3258-3223), wait for a minor rebound to short, targeting the next leg lower.
📌 Today's Suggested Trade Zones:
🔻 Sell Zones:
3378–3418
3330–3358
🔺 Buy Zones:
3258–3223
3110–3330 (ladder entries)

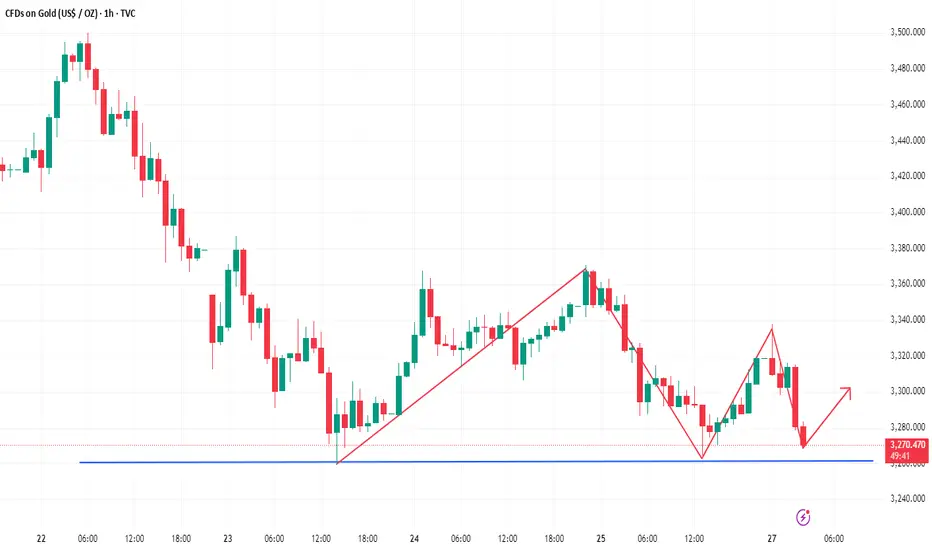
Gold is still on a volatile downward trendGold continues to fluctuate in the 1-hour chart, and the amplitude of fluctuations is beginning to narrow, which indicates that a change is getting closer. As for gold's current fluctuations, it is still in a downward trend.
Trading idea: short gold near 3318, stop loss 3330, target 3300

GOLD / XAUUSD: Analysis Daily!🔷 BUY XAUUSD: 3298/3300 (swing)
- Stoploss: 3293
- Target: 3310 / 3320 / 3330 / 3350
*Signals are for reference only, not recommended to be followed!*
Analysis: XAU/USD has a neutral-to-bullish near-term outlook. On the 4-hour chart, it's struggling with a flat 20 SMA, while the 100 and 200 SMAs are risin. Indicators are improving but still weak and in negative territory.
Support levels: 3314 - 3301
Resistance levels: 3344 - 3358

4/29 Gold Trading SignalsThe buy orders initiated around 3273 yesterday have already delivered solid profits.
After a slight rally at today’s opening, gold prices have pulled back.
Currently, the candlestick formation shows no clear directional trend, while some short-term technical indicators are pointing downward.
Before any corrective signals appear, we need to closely watch the support near 3306.
As long as this level holds, the short-term bullish momentum still has a chance to continue.
On the news side, today's scheduled data releases are of minor impact.
Focus instead on developments regarding the India-Pakistan situation and US Treasury Secretary Bessent’s press conference.
If geopolitical tensions escalate, gold may break out to new highs.
🔹 Today's Trading Strategy:
Sell within 3407-3428 zone
Buy within 3258-3223 zone
Flexibly trade between 3346-3313 / 3378-3336 / 3273-3316 zones
Please manage your positions carefully and stay alert for unexpected market moves.

Xauusd Market Projection As shown in the analysis, 2297 is a key zone whi h extends down to the 2260's on the higher time frame
If those zones hold us above then bullish momentum confirmed but if it doesnt hold, bears still have the upper hand in the market
Do you agree with this analysis ?

Xauusd Market ProjectionAs shown in the analysis, 2297 is a key zone whi h extends down to the 2260's on the higher time frame
If those zones then bullish momentum confirmed but if it doesnt hold us above, bears still have the upper hand in the market
Do you agree with this analysis ?
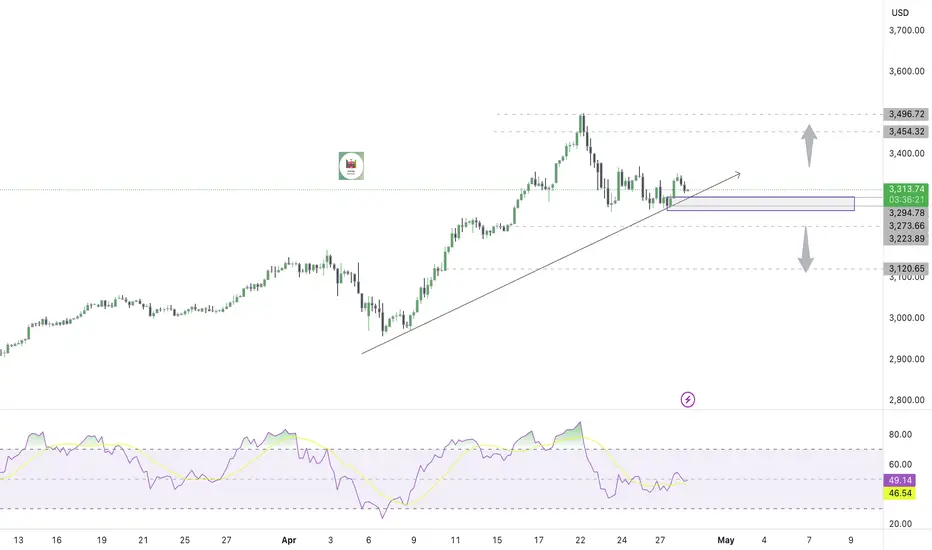
XAUUSD: Massive Volatility, Weak Support at 3270!Last week was extremely volatile for Gold, with incredible swings that caught many traders off-guard. After reaching a new all-time high at 3500, the price dropped by more than 2000 pips in less than 24 hours!
After this crash, the market settled somewhat, and towards the end of the week, Gold established a strong ceiling around 3370 – exactly as we discussed in last week's analysis.
The key question now: Is the correction over or is there more downside coming?
At the same time, we can clearly observe a floor around 3270, a level that Gold is testing again at the time of writing.
Here’s why I believe the correction is not over yet:
- Price action remains vulnerable below 3370 resistance.
- The support at 3270 looks fragile, with pressure building for a break.
- Market volatility is still extremely high, favoring continuation moves.
Trading Plan:
I am looking to sell rallies above 3300, aiming for a target around 3200.
Due to the recent wild volatility, I will adjust my stop losses accordingly, allowing enough room for noise without exposing the position to unnecessary risk.
Disclosure: I am part of Trade Nation's Influencer program and receive a monthly fee for using their TradingView charts in my analyses and educational articles.

#XAUUSD:From Our Last Analysis 534+ Pips What Next?We published our analysis on gold on April 24th, highlighting the bullish market presence. The price indeed reversed from our zone, enabling us to make a significant move of over 234 pips. We anticipate a continuous price increase from our entry zone, potentially reaching 3500$. There are several reasons behind this belief. Firstly, the escalating war-like tension between India and Pakistan could lead to a surge in gold prices, potentially surpassing the previous high. Secondly, the heightened tensions among global investors are expected to result in an extreme bullish movement in gold prices.
Given the volatility of gold, we recommend trading cautiously and taking extra precautions while trading gold.
Wishing you good luck and safe trading!
Thank you for your support! 😊
If you’d like to contribute, here are a few ways you can help us:
- Like our ideas
- Comment on our ideas
- Share our ideas
Team Setupsfx_
❤️🚀

Gold is under pressure at 3300 in the short termThe key suppression area above gold remains near 3300. At present, you can short on rallies below 3300, with the target around 3270-3265 and the stop loss at 3205. You need to trade with caution

XAU/USD 28 April 2025 Intraday AnalysisH4 Analysis:
-> Swing: Bullish.
-> Internal: Bullish.
Analysis and bias remains the same as analysis dated 23 April 2025
Price has now printed a bearish CHoCH according to my analysis yesterday.
Price is now trading within an established internal range.
Intraday Expectation:
Price to trade down to either discount of internal 50% EQ, or H4 demand zone before targeting weak internal high priced at 3,500.200.
Note:
With the Federal Reserve's dovish stance and persisting geopolitical uncertainties, heightened volatility in Gold is expected to continue. Traders should proceed with caution and adjust risk management strategies in this high-volatility environment.
Price could also be driven by President Trump's policies, geopolitical moves and economic decisions which are sparking uncertainty.
H4 Chart:
M15 Analysis:
-> Swing: Bullish.
-> Internal: Bearish.
Analysis and Bias remains the same as analysis dated 24 April 2025.
Price printed as per my note yesterday whereby I mentioned that we should be surprised if price printed a bearish iBOS as all HTF's require a pullback.
Price subsequently printed a bearish iBOS which confirms internal structure.
Intraday Expectation:
Price has traded up to just short of premium of internal 50% EQ where we are seeing a reaction. Price could potentially trade further into premium of 50%, or H4/M15 nested supply zone before targeting weak internal low priced at 3,260.190.
Note:
With the Federal Reserve maintaining a dovish stance and ongoing geopolitical tensions, volatility in Gold prices is expected to remain elevated. Traders should exercise caution, adjust risk management strategies, and stay prepared for potential price whipsaws in this high-volatility environment.
Trump's tariff announcement will most likely cause considerably increased volatility and whipsaws.
M15 Chart:

4/28 Gold Trading SignalsLast Friday, gold retested the 3260 support zone for the second time. After confirming support, prices began to climb steadily, and our low-entry long positions have already delivered impressive returns.
From a technical perspective, the broader structure still resembles a head-and-shoulders pattern, but recently, a double-bottom pattern has formed around the right shoulder, signaling an intense battle between bulls and bears—mainly influenced by geopolitical tensions.
Here, I would like to propose a bold yet speculative thought:
Could the current turmoil possibly lead to a regime change for Trump, or trigger massive nationwide protests? If such scenarios unfold, it would likely be extremely bullish for gold, potentially pushing prices toward 4000.
On the other hand, if Trump softens his trade policies under pressure, it would be bearish for gold, making a decline toward 2800 highly probable.
Of course, this is purely my personal speculation, and I don't claim deep expertise in international politics.
Focusing back on the technicals:
The 3260 support is critical.
A breakdown could see prices moving toward the 3245–3213 range, or even lower toward around 3190.
Any rebound from there should be carefully watched near the 3260 resistance; failure to break above would suggest a potential further drop toward 3153–3137.
If the double-bottom pattern holds firmly, a return to above 3400 this week is highly likely.
🔥 Today's Trading Plan:
Sell zone: 3407–3418
Buy zone: 3273–3241
Scalping zones: 3288–3323 / 3386–3344
Manage your positions wisely and stay flexible!

Gold maintains bullish mindsetThere is a fierce game between bulls and bears in gold prices, but we remain bullish in the long term. The intraday layout follows the general trend and focuses on the gains and losses of the 3260 support below. As long as it remains above 3260, we will maintain our bullish outlook and wait for the gold price to fall slightly to around 3275 before we can intervene and go long in batches!
Gold is long near 3275, stop loss 3260, target 3300
> "Gold (XAU/USD) - Demand Zone Bounce Targeting 3500 "Current Price: $3,319.59
Indicator: 70 EMA at $3,324.95 ➡️ 📈 (still slightly above price = bearish pressure)
---
Main Observations:
🔵 Demand Zone (📦 Buyers' Area):
Between $3,253 - $3,280
Every time price dips here ➡️ buyers react!
✏️ Descending Trendline:
⬇️ Short-term trend is bearish
Price is trying to break above it now (watch closely!)
🎯 Target Point:
$3,500 🏹 (Big upside if breakout succeeds!)
🛡️ Stop-Loss:
$3,253 🔥 (just below the demand zone = good protection)
Trade Idea:
✅ Buy near demand zone 🔵 after breakout confirmation 📈
✅ Target: $3,500 🎯
✅ Stop-Loss: $3,253 🛡️
Quick Dots Summary:
🔵 Demand zone is strong (buyers defending)
🔻 Still under 70 EMA (bearish until breakout)
✏️ Watching for breakout of trendline = key signal
🎯 Massive Risk:Reward ratio if it works
⚡ If no breakout and price falls, stop-loss saves capital.

#XAUUSD: We are up 1040+ pips from our previous setup! Gold has risen from 3268 to 3364, helping us make substantial positive gains. However, after reaching the $3364 region, the price dropped around 3310 and has since been fluctuating between 3310 and 3340, making it challenging to trade. There’s a possibility that the price might touch 3400 once again before it drops.
Good luck and trade safely.
Thanks for your support! 😊
If you want to help us out, here are a few things you can do:
- Like our ideas
- Comment on our ideas
- Share our ideas
Team Setupsfx_
❤️

4/25 Gold Trading StrategyYesterday’s long position strategy performed well—whether you closed your trades or continue to hold, the returns have been solid. Gold has now risen to the 3370 level, and technically, there's still room for further upside.
There is some selling pressure near 3370. If price breaks through decisively, we should watch for further resistance in the 3380–3400 zone. If bullish strength weakens, a pullback to 3368–3352 could occur.
If the market dips first, the 3345–3328 range is a key support area. A slow, corrective pullback to this zone could offer another buying opportunity. However, if the decline is sharp, we must monitor whether 3306–3288 can hold as a firm bottom.
From a trend perspective, I personally lean toward the possibility of gold pushing above 3400 today. Stay long-biased, but be flexible with high-level adjustments.
🔁Trading Recommendations:
Sell in the 3410–3440 range
Buy in the 3306–3288 range
Use 3380–3348 / 3328–3368 for flexible, intraday swing trades

XAU/USD 25 April 2025 Intraday AnalysisH4 Analysis:
-> Swing: Bullish.
-> Internal: Bullish.
Analysis and bias remains the same as yesterday's analysis dated 23 April 2025
Price has now printed a bearish CHoCH according to my analysis yesterday.
Price is now trading within an established internal range.
Intraday Expectation:
Price to trade down to either discount of internal 50% EQ, or H4 demand zone before targeting weak internal high priced at 3,500.200.
Note:
With the Federal Reserve's dovish stance and persisting geopolitical uncertainties, heightened volatility in Gold is expected to continue. Traders should proceed with caution and adjust risk management strategies in this high-volatility environment.
Price could also be driven by President Trump's policies, geopolitical moves and economic decisions which are sparking uncertainty.
H4 Chart:
M15 Analysis:
-> Swing: Bullish.
-> Internal: Bearish.
Analysis and Bias remains the same as yesterday's analysis dated 24 April 2025.
Price printed as per my note yesterday whereby I mentioned that we should be surprised if price printed a bearish iBOS as all HTF's require a pullback.
Price subsequently printed a bearish iBOS which confirms internal structure.
Intraday Expectation:
Price has traded up to just short of premium of internal 50% EQ where we are seeing a reaction. Price could potentially trade further into premium of 50%, or H4/M15 nested supply zone before targeting weak internal low priced at 3,260.190.
Note:
With the Federal Reserve maintaining a dovish stance and ongoing geopolitical tensions, volatility in Gold prices is expected to remain elevated. Traders should exercise caution, adjust risk management strategies, and stay prepared for potential price whipsaws in this high-volatility environment.
Trump's tariff announcement will most likely cause considerably increased volatility and whipsaws.
M15 Chart:

Gold surged and then fell back to fluctuate. How to profit?
Trump said he was ready to significantly reduce the broad tariffs on Chinese goods. On the same day, Trump also said he had no intention of firing Fed Chairman Powell, who had previously asked the Fed to cut interest rates immediately. This move shocked the market and triggered warnings from business leaders.
Short-term trading of gold and US dollars on April 24: US market focuses on 3350-66 to suppress shorts, stop loss 3375, take profit 3317/3300
⭐️ Note: Labaron hopes that traders can properly manage their funds
- Choose the number of lots that matches your funds
- Profit is 4-7% of the capital account
- Stop loss is 1-3% of the capital account

#XAUUSD :Is it a Correction Or a start of Major Bearish Trend? Gold has plummeted from 3550 to 3270, and it’s been falling steadily. We firmly believe that the price could reverse from either of our entry points, but given its significant drop, it raises concerns among traders. If the trend has shifted to bearish, it will likely continue to target buyers’ stop losses. In these market conditions, we strongly advise trading with utmost caution and prioritising risk management.
Good luck and trade safely.
Thanks for your support! 😊
If you want to help us out, here are a few things you can do:
- Like our ideas
- Comment on our ideas
- Share our ideas
Team Setupsfx_
❤️

XAUUSD TRADE PLAN H1XAUUSD TF H1
SELL/SHORT PLAN (BASE AREA)
cancel if price break ma100(blue line) or break structure pattern
take profit max bos area (c) max correction wave price (3241-3200)
