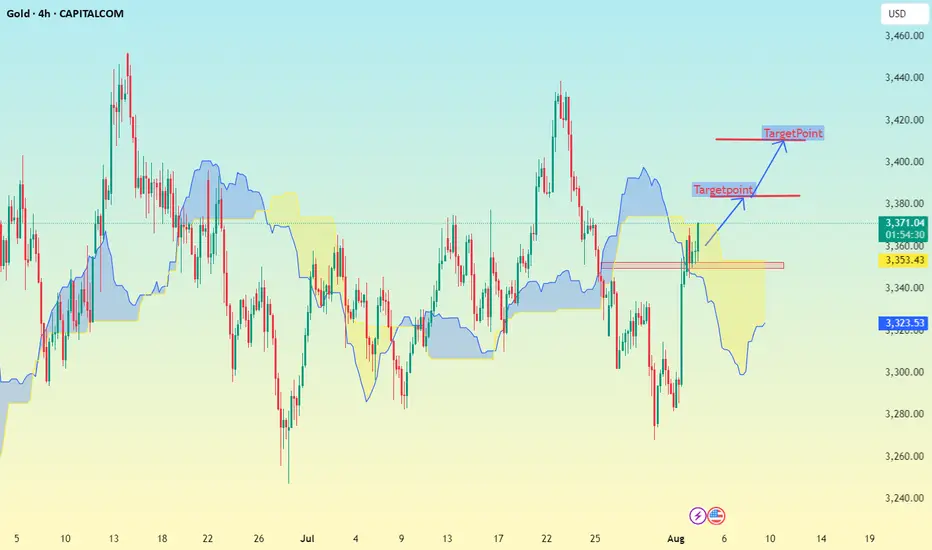
Gold 4H timeframe Based on the chart my shared (Gold 4H timeframe with Ichimoku cloud), here are the identified target points:
📈 Upside Targets:
1. First Target: 3380
This is marked just above the Ichimoku cloud breakout.
It is a short-term resistance zone.
2. Second Target: 3420
This is the higher target zone indicated in the chart.
It aligns with a previous high and potential resistance area.
---
🟡 Key Support:
Support Zone: Around 3322 – 3353
Price needs to hold above this zone to maintain the bullish momentum.
Xauusdshort
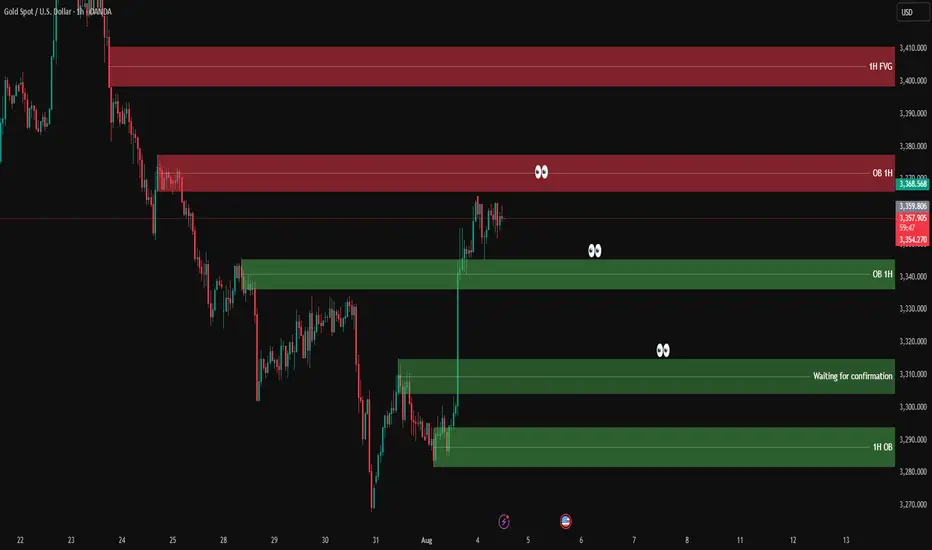
XAUUSD analysis - 1H FVG and OB setupsOn the 1H chart, price has made a sharp bullish move from the lower 1H OB zone (3,275 – 3,285) and is now hovering just below the 1H supply zone.
🔴 1H Supply Zone (OB):
3,354 – 3,368 → Price is consolidating here with no strong rejection yet.
🟢 1H Demand Zone (OB):
3,337 – 3,344 → First area to watch for potential bullish reaction.
👁 Mid-level support zone (waiting for confirmation):
3,310 – 3,320 → If price pulls back here and gives confirmation on lower timeframe, we’ll look for long setups.
📌 Trade scenarios:
1️⃣ Bullish: Wait for a retracement into 3,310 – 3,320, and if confirmed on LTF (3M–5M), go long.
2️⃣ If price drops deeper into the lower OB zone 3,275 – 3,285 and gives strong bullish reaction → potential long setup again.
3️⃣ Bearish: If price rejects the current OB zone (3,354 – 3,368) with confirmation → short entry targeting the green zones below (~3,320 or 3,310).
✅ Entry only after confirmation on lower timeframe
❌ No confirmation = no trade
XAUUSD needs Retest H4 TIMEFRAME SETUP
We shared daily our XAUUSD for deep insights and knowledge.
Currently we have range of 3345-3380 area also we have proper CHOCH on H4 at 3335 support area As I mentioned in our previous commantary we have bullish momentum which is almost near our milestone.
What possible scenarios we have ?
• Atm i took sell from 3385 with minimal risk
Sell from 3395-3400
TARGETS 3370 then 3350 milestone.
• above 3405- 3408 our selling will be invalid and we'll took buy to ATH

8/5: Watch for Short Opportunities Near 3400Good morning, everyone!
On Wednesday, gold held above the key support area at 3343–3337, and subsequently broke through the 3372–3378 resistance zone, leading to a strong bullish move and solid long-side gains.
Today, attention should shift to the major resistance around 3400. If bullish momentum continues, price may approach the secondary resistance near 3420. However, from a technical perspective, signs of bearish divergence have begun to emerge. Should price continue rising while momentum weakens, the risk of a short-term correction increases accordingly.
Key levels to monitor:
Primary resistance zone: 3404–3416
Intermediate supply area: around 3398
Crucial support zone: 3372–3363 (a hold here could support further upside)
⚠️ Cautionary Note:
The US PMI data release during the New York session could introduce volatility. Be sure to maintain strict risk management and stop-loss discipline during periods of increased uncertainty.
🔁 Trading Bias for Today:
Prefer selling into strength near resistance, while cautiously considering buying on dips near support.
The 3343–3337 area continues to serve as the primary support zone, and price action around this level will be critical in determining the next directional move

Distribution Phase at the Top, Key Support in FocusFollowing a sharp breakout from the demand zone around $3,310, gold has entered a sideways consolidation range between $3,355 – $3,367. The price has repeatedly tested the support at $3,352 – $3,354 but failed to form higher highs beyond $3,367. This signals buyer exhaustion and a potential distribution pattern at the top.
The inability to push higher suggests increased risk of a bearish breakdown.
Key Technical Levels
Immediate Resistance: $3,367.77
Short-Term Support: $3,352 – $3,354 (blue box zone)
Major Support Below: $3,310 – $3,315 (previous breakout base, near 0.5 Fibonacci retracement)
Suggested Trading Strategies
Primary Scenario: Sell on Breakdown
Trigger Condition: Price breaks below $3,352 with increasing volume
Entry: $3,350
Stop Loss: $3,360
Target: $3,320 – $3,310
This is a momentum-following setup, ideal if the current support fails.
Alternative Scenario: Buy from Major Support
Entry Zone: $3,310 – $3,315
Stop Loss: Below $3,300
Target: $3,345 – $3,355
Suitable for counter-trend traders looking to catch a rebound off strong demand.
Additional Technical Signals
EMA 20 (15m): Flattening out, indicating loss of bullish momentum
RSI: Hovering around 50, showing a balance between buyers and sellers
Volume: Gradually decreasing, suggesting a potential breakout setup is building
Gold is currently in a distribution phase after a sharp upward move. If the $3,352 support zone breaks, a retracement toward $3,310 – $3,315 is likely. However, bulls may step back in around that zone for a potential rebound.
Follow for more real-time gold strategies. Save this post if you find it useful for today’s session!
Gold Consolidates at the Top, Bearish Reversal Ahead?On the 15-minute chart, XAUUSD is showing signs of exhaustion after a strong bullish impulse. Price is currently consolidating around the 3,370–3,375 resistance area, failing to make a clean breakout. Volume is fading, suggesting buyer momentum is weakening.
Technical Breakdown:
1. Market Structure:
Since late July, the market has formed a clear uptrend with higher highs and higher lows.
However, recent price action is showing indecision at the top, with multiple rejection wicks – indicating a potential short-term distribution phase.
2. Price Action & Supply-Demand Zones:
Demand Zone 1: Around 3,310–3,320 acted as the launchpad for the strong bullish breakout on August 2.
Demand Zone 2: Around 3,345–3,350 provided support for the next leg up.
Current Supply Zone: Between 3,375–3,380 – multiple rejections have been observed here.
3. Indicators Overview:
EMA20 & EMA50 (not shown but inferred): Upward sloping, but starting to flatten – signaling potential consolidation or bearish divergence.
RSI (likely above 70 earlier): Now showing signs of bearish divergence, supporting a possible short-term correction.
4. Fibonacci Retracement Analysis:
From the recent bullish swing (3,310 → 3,375), key retracement levels are:
0.382 → ~3,350
0.5 → ~3,342
0.618 → ~3,334
This confluence around the 3,334–3,342 range makes it a critical zone for a potential bullish bounce.
Suggested Trading Strategies
Scenario 1 – Scalping the Rejection (Counter-trend short):
Entry: SELL limit at 3,375–3,380
Stop Loss: 3,386
Take Profits:
TP1: 3,350 (Fibonacci 0.382)
TP2: 3,335 (Fibonacci 0.618 + previous support)
Scenario 2 – Trend Confirmation (Breakdown Play):
Setup: Sell if price breaks below 3,350 with volume confirmation.
Target Zones:
Initial target: 3,310 (prior demand zone)
Extended target: 3,280–3,265 (possible Wyckoff distribution breakdown)
Key Levels to Watch:
Significance: 3,380 - Resistance - Short-term supply zone
3,350: Support - Key Fibonacci 0.382 level
3,334: Support - Strong confluence zone (Fibo + demand)
3,310: Support - Bullish breakout base
Conclusion:
Gold is currently in a vulnerable position with signs of bullish exhaustion. Traders should stay patient and wait for confirmation before entering. Watch the 3,350–3,334 zone for reaction – it will likely decide the next directional move.
If you found this analysis helpful, make sure to follow for more updated strategies and save this post for future reference.

XAUUSD:BUYThere is no need to worry about holding long orders mentioned last Friday. Gold prices continued to rise this week after a pullback. The price has risen to 3372. According to the research team of our swing trading analysis team, the bullish trend will continue.
Earlier I informed members that some buy orders were closed at high levels. At that time, the short-term high was around 3370. After closing the long orders, the price subsequently fell. This is the advantage of swing trading. You can use accurate trading signals to trade in batches in the short term, thereby creating opportunities for quick profits.
After the pullback, there is still good room for buying and opportunities.

8/4: Watch Support at 3343–3337 and Resistance at 3372–3378Good morning, everyone!
Last Friday, gold rallied strongly, driven by a combination of favorable economic data and bullish technical signals, decisively breaking above the 3337–3343 resistance zone. During the subsequent pullback, price action remained firm above 3337, followed by a secondary upward move.
From a technical standpoint, the structure suggests the potential for continued upward consolidation, with the possibility of filling the gap near 3396. However, significant resistance remains between 3372 and 3378 — failure to break through this zone decisively may result in a short-term pullback before further gains.
Key levels to watch:
Initial support: 3348 and 3337–3343 zone
Major support: 3312–3300 zone (a break below could signal deeper downside risk)
Trading Strategy:
Focus on intraday setups around these critical areas. Look for buy opportunities on dips as long as support holds, while remaining cautious of sharp pullbacks near strong resistance.

Gold price analysis week 32The recently released Nonfarm data has become an important catalyst, officially breaking the previous bearish wave structure and shaping a completely new uptrend for gold prices. Breaking above the wave 1 peak at the 3315 area is a clear confirmation signal that the downtrend has ended.
In that context, the trading strategy for next week should prioritize buying orders. This rally has the potential to push gold prices to historical peaks if the bullish momentum is maintained with stable trading volume.
Specific trading strategy:
Important support zone: 3333 – 3315
Short-term resistance zone: 3373 – 3416

Weak non-farm payroll data injects newconfidence into gold bullsGold rebounded strongly late last week, shaking off early-week losses and surging toward key resistance at $3,400 per ounce as weak US jobs data rekindled hopes for a September rate cut by the Federal Reserve.
Spot gold closed at $3,363.16 on Friday (August 1st), up 2.23% on the day, or $73.24, after hitting a high of $3,363.37.
Lukman Otunuga, senior market strategist at FXTM, said Friday's rally in gold prices was impressive, driven by a plunging US dollar.
"From the chart, bulls were on a rampage that day, with $3,400 within 2% of the price at that point," he said. "With prices breaking through $3,330 resistance, the weekly chart is significantly bullish. A weekly close above this level could signal a move toward $3,400."
Last week, gold faced significant selling pressure after the Federal Reserve held interest rates steady and Chairman Powell raised uncertainty about a possible September rate cut.
"We haven't made a decision about September yet," Powell said at a press conference following the Fed's decision.
After disappointing U.S. job market data, lingering doubts about a September rate cut dissipated. According to the Bureau of Labor Statistics, the U.S. economy created only 73,000 jobs last month. Furthermore, total job growth in May and June was revised downward by 258,000. According to the revised data, only 14,000 jobs were created in June and 19,000 in May.
"This weaker-than-expected jobs report has dented confidence in the U.S. economy and put pressure on the dollar as markets anticipate a more dovish Fed, potentially leaning toward rate cuts to stimulate growth," said Aaron Hill, senior market analyst at FP Markets. "For gold, the disappointing jobs data reinforces its role as a hedge against economic uncertainty, supporting prices as investors seek stability."
According to the CME FedWatch tool, the market currently sees a 92% probability of the Fed easing monetary policy in September. Last Thursday, the market saw only a 38% chance of a rate cut.
Jamie Cox, managing partner at Harris Financial Group, said the Federal Reserve may ultimately regret its decision to hold interest rates steady earlier this week.
"A rate cut in September is a definite possibility, perhaps even a 50 basis point cut, to make up for lost time," he said.
Naeem Aslam, chief investment officer at Zaye Capital Markets, said he sees the potential for gold prices to steadily rise to $3,400 an ounce given the sharp shift in interest rate expectations.
"If the Fed signals a dovish stance, speculative inflows could push gold prices above the psychological $3,400 level, especially as investors seek safe havens during economic uncertainty," he said. "Technical indicators, such as a bullish trend in gold ETFs and rising open interest, support this potential breakout. We believe traders are already positioning for a dip bounce, with some analysts pointing to seasonal patterns in gold that typically gain traction after August. While volatility may still limit near-term gains, the overall trend looks positive, and the typical summer lull may be over."
This week will be light on economic data, with investors continuing to digest Friday's jobs report. Meanwhile, some analysts expect the economic uncertainty stemming from President Trump's ongoing trade war and global tariffs to further boost safe-haven demand for gold.
Trade tensions are providing another layer of support for gold. President Trump set an August 1st deadline for countries to finalize a trade deal. While the United States reached agreements with Japan and the European Union, resulting in a 15% increase in import tariffs, many major trading partners still face the risk of tariff increases.
As a result, exports from many countries now face significant cost increases. Specifically, Canada, the United States' second-largest trading partner, faces a 35% tariff increase. Meanwhile, India faces a 25% increase, Taiwanese exports will be subject to a 20% tariff, South African products face a 30% tariff, and Swiss goods face a 39% tariff.
Pepperstone market strategist Michael Brown said he remains bullish on gold, citing global trade uncertainty as a key factor driving its value as a monetary asset.
He said: "The diversification of reserves away from the US dollar and into gold, particularly in emerging markets, will continue for the foreseeable future. Of course, potential safe-haven demand stemming from concerns about the state of the US economy will further support the bullish view. The upside levels to watch remain the $3,400 mark, followed by a high of around $3,445, and then a potential run towards the all-time high of $3,500. I certainly wouldn't rule out the possibility of new highs in gold prices before the end of the year."
Chris Vecchio, Head of Futures Strategy and FX at Tastylive, said he sees gold as a very beneficial global currency.
"Tariffs mean that countries will trade less in US dollars, so I expect gold to continue to perform well as the world searches for an alternative monetary asset."
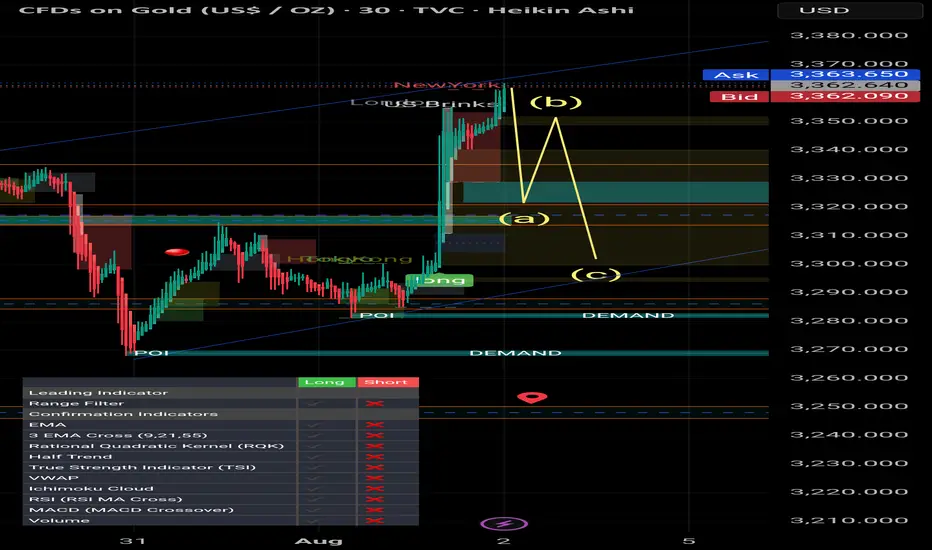
Smart Money / Price Action 5min scalping road map# 📈 ABC Pattern Explained for TradingView (Smart Money / Price Action)
The **ABC pattern** is a 3-leg corrective move in market structure, commonly used in price action, Elliott Wave, and Smart Money trading. It's mainly used to identify **pullbacks** or **correction zones** before a continuation of the main trend.
---
## 🔹 Structure of the ABC Pattern:
- **Point A**: The beginning of the move — often the end of a strong impulsive wave.
- **Point B**: The first retracement or pullback from Point A.
- **Point C**: The second corrective move that often goes beyond A, forming the completion of the correction phase.
The ABC legs can be:
- **A to B**: Impulsive or corrective.
- **B to C**: Generally a counter-trend retracement.
---
## 🔸 How to Identify on Chart:
1. **Find a strong trend** (uptrend or downtrend).
2. **Look for the first correction** — mark it as Point A to B.
3. **Next wave** that attempts to continue the trend but fails — mark the end as Point C.
4. **Use Fibonacci tools** to measure:
- **B retracement of A** (typically 50%–78.6%)
- **C extension** of AB (typically 127.2%–161.8%)
---
## 🔧 How to Draw on TradingView:
> You can use the `Trend-Based Fib Extension` tool or draw manually using the `Path` or `ABC pattern` tool.
### Step-by-Step:
1. Select the `ABC Pattern` tool from the **left toolbar** under “Prediction and Measurement Tools”.
2. Click on **Point A** (3320$).
3. Click on **Point B** (3350$).
4. Click on **Point C** (final corrective wave 3300$ ).
5. TradingView will automatically plot the shape with labels.
---
## 🧠 Pro Tips:
- Look for **liquidity sweep** or **order blocks** near Point C.
- Entry opportunity is often **after C**, targeting a **continuation** of the main trend.
- ABC is often part of **larger structures** like **complex pullbacks** or **smart money retracements**.
---
## ✅ Example Use:
- **Buy Scenario**:
- Strong uptrend → Price drops from A to B (retracement).
- Then price rises to C, failing to break above A → Possible new higher low formed.
- Enter long if price breaks above Point B again.
- **Sell Scenario**:
- Strong downtrend → A to B is a pullback.
- C attempts new high, fails → short entry after break of B.
---
## 📌 Settings Tip for Mobile Users:
- Zoom in for better point control.
- Use “Lock” feature to prevent accidental move.
- Customize color and label visibility in the style tab.
---
## 🔍 Keywords:
`ABC Pattern`, `Elliott Correction`, `Smart Money`, `Liquidity Grab`, `Break of Structure`, `Trend Continuation`, `Price Action Trading`, `Market Structure`
---
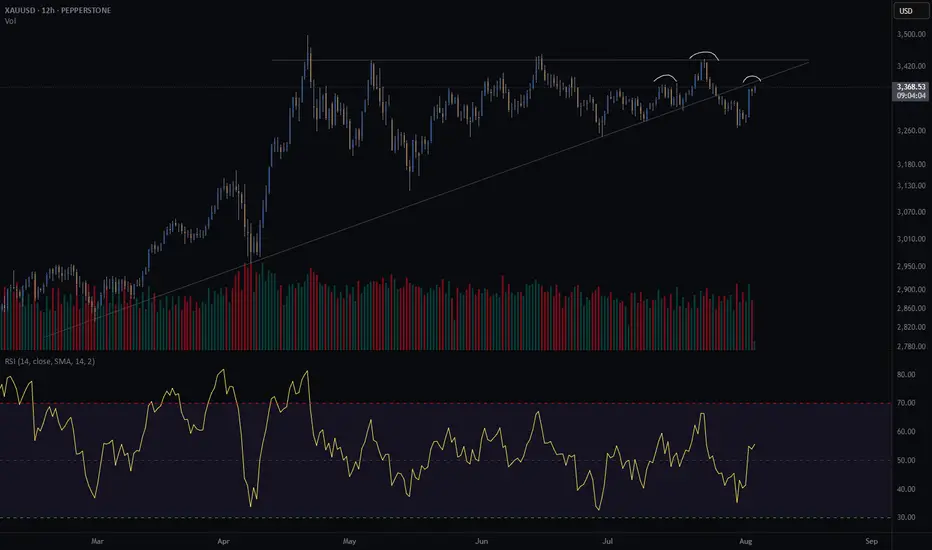
Gold crash (SHORT) - head and shouldersGold is at an interesting crossroad.
It broke through its diagonal support on Friday the 25th of July.
Price is retesting previous support. Does it turn into resistance?
Further confluence is a head and shoulders of the H8 and H12, with the right shoulder coinciding with the retest of the diagonal.
Since I am long gold with my investments, I am hesitant to short gold through my trading business. However, if my pattern is available, I take the trade. This will be a very short term trade - a few days at most if the trade goes in my favour.
Risk/reward = 12.6
Entry price = 3382.5
Stop loss price = 3396.2
Take profit level 1 (50%) = 3230
Take profit level 2 (50%) = 3181
The risk reward is exceptionally high. However, I have taken a more conservative approach with my entry because of my apprehension to short gold. For this trade I will enter at the extreme end of the range in which I will look for entries. This is the reason for such a high RR. It might result in me missing an entry.
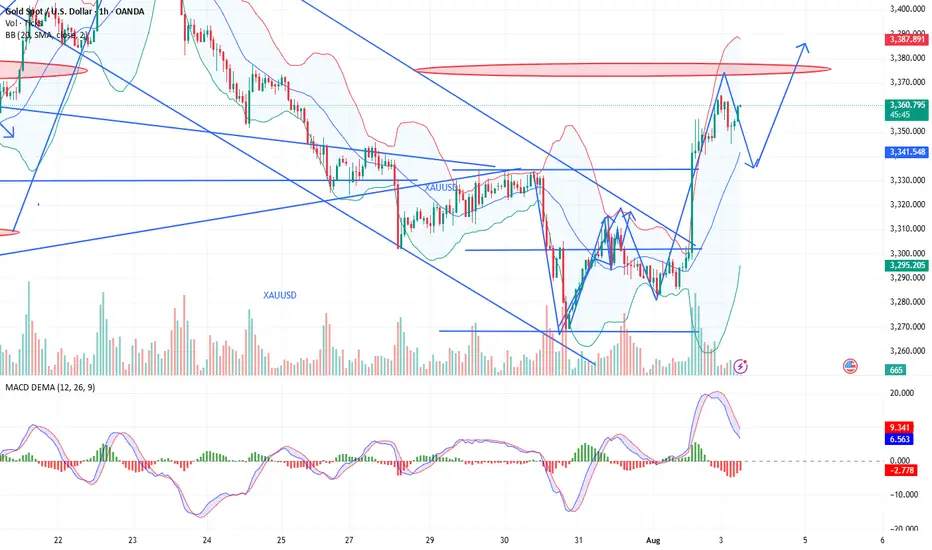
Can technical factors boost gold? (Must-read for traders)After three consecutive days of strong rebounds, spot gold has entered a period of sideways trading, trading around $3,370 in the European session, with a short-term seesaw pattern. A slight rebound in the US dollar index has weighed on gold prices, but market expectations of a September Fed rate cut remain supportive. Furthermore, lingering global trade uncertainty has prevented a significant decline in safe-haven demand.
Fundamentals:
Gold's recent upward momentum has been driven by weak US economic data and rising expectations of rate cuts. Last week's non-farm payroll data showed a significant weakening in the labor market, reinforcing market bets that the Fed will begin another round of rate cuts in September. The CME FedWatch tool shows that the market's expectation of a September rate cut has exceeded 90%. Meanwhile, US factory orders plummeted 4.8% in June, further highlighting economic weakness.
On the other hand, US President Trump signed an executive order last week raising tariffs on imports from dozens of countries, with the minimum tariff rate reaching 15% for countries with trade deficits with the US. With these measures about to take effect, this uncertainty continues to weigh on global market sentiment and supports gold's safe-haven properties.
However, a slight rebound in the US dollar partially offset gold's upward momentum. Traders will be watching the upcoming US ISM Services PMI data to determine whether the economic slowdown has spread to the services sector.
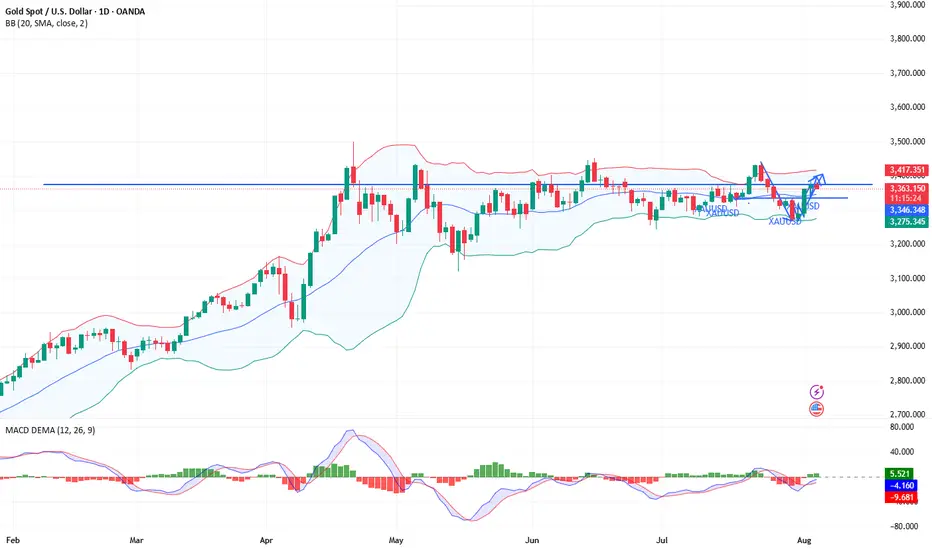
Technical Analysis:
On the daily chart, gold prices have recently traded between the middle and upper Bollinger Bands (3343.59) and 3411.09, failing to break through key resistance. The overall trend remains within the medium-term range, with no clear trend emerging.
The recent candlestick chart pattern forms a typical "sideways fluctuation" pattern, indicating significant pressure near the previous high of 3438.80, while the lower Bollinger Band (3276.09) provides support, suggesting a short-term "box consolidation" pattern.
On the MACD indicator, the fast and slow lines are near the zero axis, while the DIFF and DEA lines have formed a slight golden cross, but the angle is gentle. The red bar has limited momentum, indicating insufficient upward momentum and a lack of a strong rebound.
The Relative Strength Index (RSI) remained at 54.81, within the neutral to strong range, indicating a lack of clear short-term price direction. Market sentiment remains cautious. Further attention will be paid to whether the price stabilizes above the middle Bollinger Band or retreats to test previous support levels.
Market Sentiment Observation:
Current gold market sentiment is cautiously optimistic. Traders are pricing in a high level of interest in the Federal Reserve's rate cut, driving a short-term rebound in gold prices. However, the dollar's resilience remains, limiting gold's upside potential. Indicators show a lack of significant inflows into gold ETFs, suggesting the market has not yet fully shifted to a defensive position.
The technical chart shows a typical "consolidation platform," indicating that the market is awaiting clearer policy or data guidance. Investors remain interested in safe-haven assets, but their willingness to chase higher prices is weak. In the short term, market sentiment may continue to be constrained by fluctuations in external macroeconomic data and shifting policy expectations.
Market Outlook:
Bull Perspective:
Analysts believe that if gold prices break through the upper Bollinger Band at 3411.09 and the MACD indicator expands, further upside potential is expected, with the previous high of $3450 in sight. If the Federal Reserve signals a clear interest rate cut or if the US economy continues to weaken, gold could see a mid-term trend reversal and resume its upward trend.
Bear Perspective:
Analysts believe that if gold prices remain constrained in the 3400-3411 range and fall below the middle Bollinger Band and moving average support, a short-term pullback could occur, testing the lower support band at $3276. If the ISM Services PMI exceeds expectations and the US dollar strengthens again, gold could return to bearish momentum. FOREXCOM:XAUUSD ACTIVTRADES:GOLD ICMARKETS:XAUUSD CMCMARKETS:GOLD PYTH:XAUUSD FOREXCOM:GOLD ICMARKETS:XAUUSD CMCMARKETS:GOLDZ2025 CMCMARKETS:GOLD
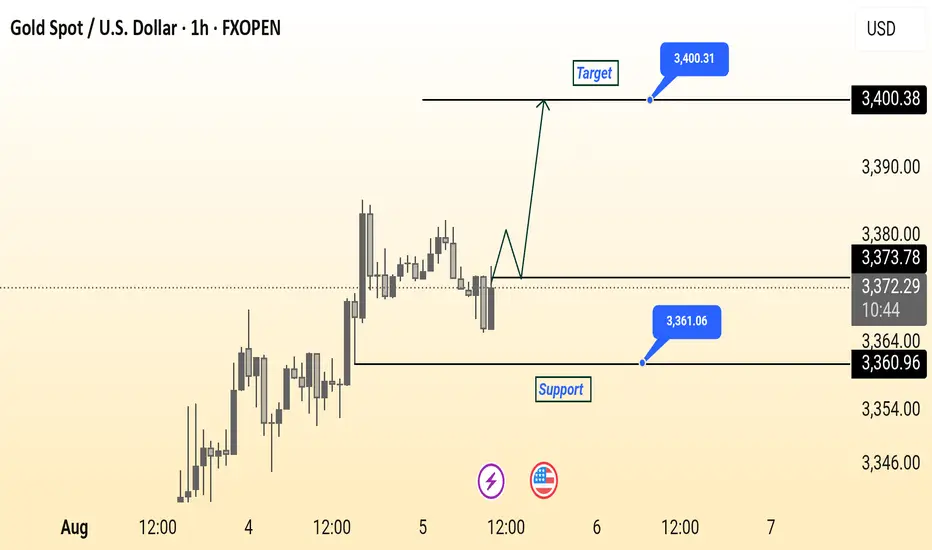
Gold Spot (XAU/USD) 1-Hour Chart Analysis – Potential Upside TowThis 1-hour chart for Gold Spot (XAU/USD) from FXOPEN shows a key support level at $3,360.96 and a potential target at $3,400.31. The current price is hovering around $3,372.04, just below the minor resistance of $3,373.78. A bullish breakout from this zone could initiate a move toward the target, as illustrated by the projected upward path. The support zone marked in blue suggests a strong buying interest that could act as a rebound area if prices dip. Watch for price action confirmation near support for potential long entries.
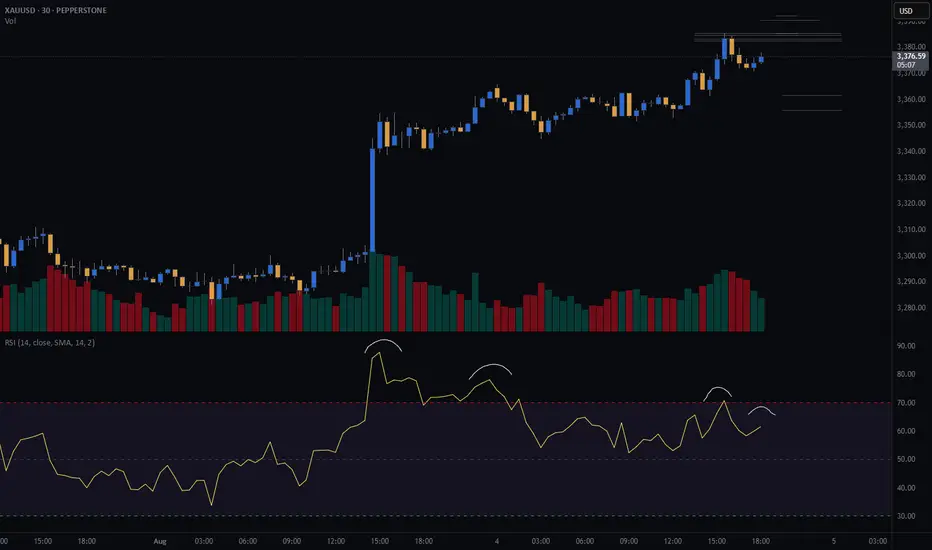
XAUUSD shows bearish divergence. Minor correction or sign of a rXAUUSD shows bearish divergence. Minor correction or sign of a reversal?
On August 4 gold continued bullish momentum, started on August 1 after disappointing nonfarm payrolls report came out that heightened fears about the U.S. economy’s health. Investors now see a 94.4% likelihood of a Federal Reserve rate cut in September. Gold gained further support due to doubts about the Fed’s autonomy after Governor Adriana Kugler resigned on August 1, opening the door for President Trump to appoint a successor who may support his push for lower interest rates. The metal’s safe-haven status was also bolstered by trade tensions, as Trump’s new tariffs on exports from numerous trading partners are scheduled to begin on August 7.
Despite this, in short term gold looks bearish. The price has failed to break through the intermediate level of 3,380.00 and currently trades slightly below this level, showing bearish divergence. The decline towards the SMA50 with further rise towards 3,440.00 is expected here. Second option (less probable) is the price comes back to a level of 3,300.00.

GOLD (XAU) SHORT - Double top 30minRisk/reward = 2.8
Entry price = 3382.5
Stop loss price = 3390.5
Take profit level 1 (50%) = 3361.7
Take profit level 2 (50%) = 3356
I am considering a short on gold.
Still need some variables to fall into place before I enter the trade.
There is nice RSI negative divergence showing declining momentum.
Further confluence:
- Potential head and shoulders on higher time frame
- At area of previous diagonal support which could be turned into resistance if the 30min double top plays out
Gold Spot / U.S. Dollar (XAUUSD) 4-Hour Chart - OANDA4-hour performance of the Gold Spot price against the U.S. Dollar (XAUUSD) from late July to early August 2025. The current price is 3,362.895, reflecting a +72.775 (+2.21%) increase. Key levels include a sell price of 3,362.200 and a buy price of 3,363.590. The chart highlights a recent upward trend with a notable resistance zone around 3,395.716 and a support level near 3,336.129, as indicated by the shaded areas.

gold on sell reverse#XAUUSD on price reverse, base on the double rejection between 3345-3357. We await for breakout below 3351.6 before selling.
Entry 3351.6, target 3340-3315, SL 3361.
Above 3367 on 2 times breakout holds bullish till 3377 which have sell reject to fall below 3360-3350.

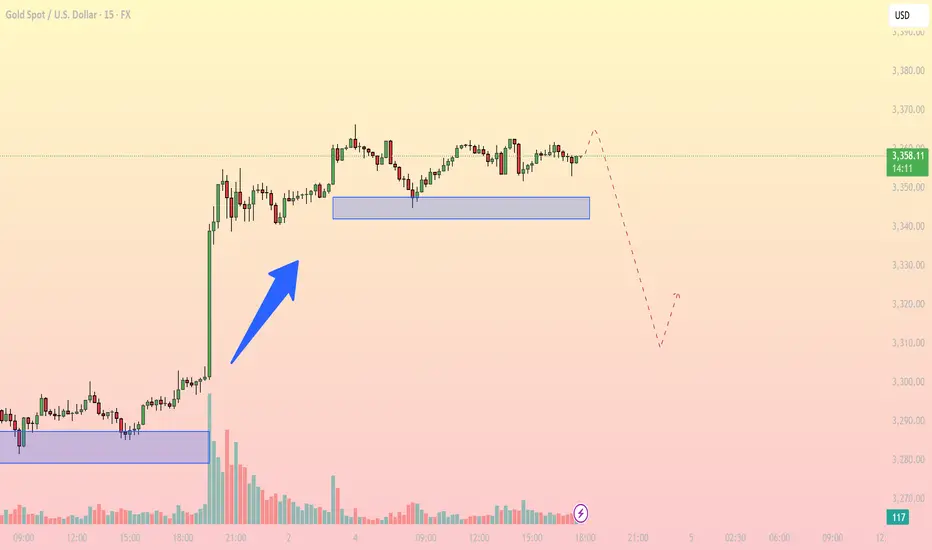
Bullish Momentum Confirmed with Strong Breakout ZoneGold (XAUUSD) on the 15-minute chart has shown a powerful bullish breakout from the accumulation zone near 3,305 USD, followed by a strong rally and subsequent consolidation above the new demand zone at 3,340–3,346 USD.
Key Observations:
- Support Levels:
3,305 USD: Origin of the impulsive breakout move – key bullish order block and high-volume demand zone.
3,340–3,346 USD: Newly established support from post-breakout consolidation.
3,331 USD: Minor intraday support, previously tested resistance level.
- Resistance Levels:
3,367–3,370 USD: Current short-term resistance zone where price is facing rejection.
Break above 3,370 USD would open potential toward 3,385 USD based on Fibonacci extensions.
- Trend & Indicators:
Price is forming a bullish flag pattern after a vertical impulsive move.
EMA 21/50 likely aligning beneath price on this timeframe, supporting trend continuation.
Volume surged heavily during breakout from 3,305 USD, confirming institutional involvement.
RSI (not shown) is expected to be cooling off from overbought, setting up for another leg higher.
Fibonacci Analysis:
Applying Fib from 3,305 low to 3,359 high, the 0.382 level sits near 3,339, aligning with the current demand zone.
Any pullback into this region may be treated as a buy-the-dip opportunity.
- Suggested Intraday Trading Strategy:
- Buy on Retest
Entry: 3,342–3,346 USD (demand zone)
Stop Loss: Below 3,331 USD
Target 1: 3,367 USD
Target 2: 3,378–3,385 USD (Fibonacci extension and structure projection)
- Avoid short-selling unless price closes below 3,331 USD with volume confirmation.
Conclusion:
Gold is maintaining bullish structure on lower timeframe, and current price action suggests potential continuation after consolidation. Patience for retest entries at key zones can yield high R:R setups.

XAUUSD shows short-term bearish divergence.XAUUSD shows short-term bearish divergence.
On August 1 gold increased dramatically after the NFP report data came out. No wonder, recession risks generally drive XAUUSD higher due to increased safe-haven demand, a weaker dollar, and expectations of lower interest rates. Gold’s negative correlation with equities and its role as an inflation hedge make it a preferred asset during economic uncertainty.
However, on short-term timeframe, the bullion shows bearish divergence, the asset is to overbought and needs some downward correction in order to cool down a bit. Additionally, the price is retesting former trendline from below. The decline towards 3,300.00 is expected.

Gold is in the Bearish Direction after Formation ManipulationHello Traders
In This Chart GOLD HOURLY Forex Forecast By FOREX PLANET
today Gold analysis 👆
🟢This Chart includes_ (GOLD market update)
🟢What is The Next Opportunity on GOLD Market
🟢how to Enter to the Valid Entry With Assurance Profit
This CHART is For Trader's that Want to Improve Their Technical Analysis Skills and Their Trading By Understanding How To Analyze The Market Using Multiple Timeframes and Understanding The Bigger Picture on the Charts
Nonfarm Pay Attention Zone✏️ OANDA:XAUUSD is recovering and increasing towards the resistance zone of yesterday's US session. The 3315 zone is considered a strategic zone for Nonfarm today. A sweep up and then collapse to the liquidity zone of 3250 will be scenario 1 for Nonfarm today. If this important price zone is broken, we will not implement SELL strategies but wait for retests to BUY. It is very possible that when breaking 3315, it will create a DOW wave with the continuation of wave 3 when breaking the peak of wave 1.
📉 Key Levels
SELL trigger: Reject resistance 3315.
Target 3250
BUY Trigger: Break out and retest resistance 3315
Leave your comments on the idea. I am happy to read your views.

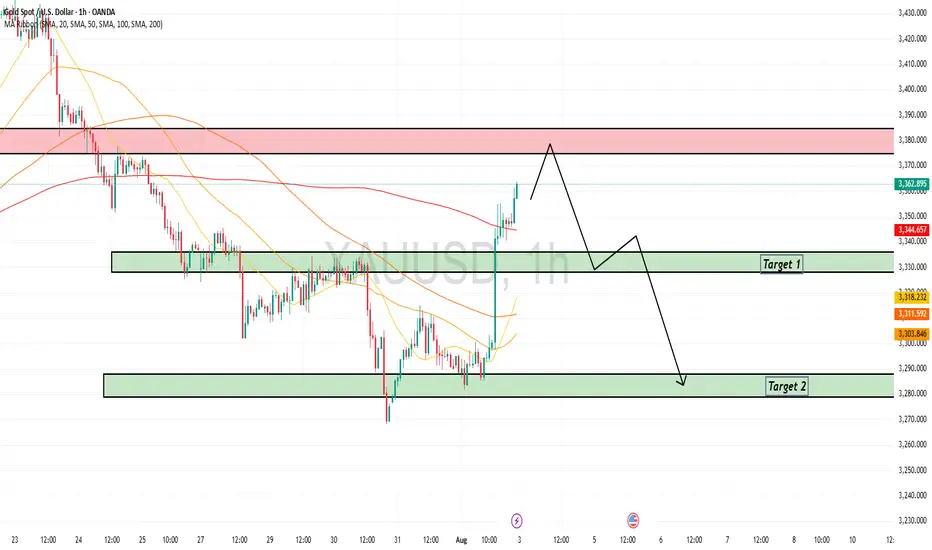
Gold (XAU/USD): Supply Zone Rejection & Bearish Breakdown Chart Breakdown:
Supply zone rejection: Gold revisited the “supply zone” (light green/grey area) and failed to break above — a classic signal of seller dominance.
Uptrend invalidated: A sharp rise (steep black trendline) ended with a peak marked by the green arrow, followed by a decisive breakdown.
Ichimoku Cloud test: Prices slipped through the Ichimoku components, reinforcing the shift to bearish sentiment.
Potential targets: The red/green risk‑reward box highlights a short position, targeting ~3,347 then ~3,318 levels (blue labels) as initial support zones.
Strong supply base: The extensive grey zone below marks a "stronger supply zone" — this could cap any modest bounce and keep the downtrend intact.
🔍 Interpretation:
Bias: Bearish — sellers have taken control after a failed breakout.
Strategy: Short on rallies toward the mid‑green/red box (~3,373–3,380), targeting ~3,347 first and then ~3,319. Watch for support at the strong supply region (~3,292) for potential reversal or consolidation.
Risk management: Keep stop above the red zone—above recent highs (~3,380+) to limit risk.
🚀 In a nutshell: After failing to break supply and losing its short‑term uptrend, gold appears poised for a pullback. The next key levels to watch are ~3,347 and ~3,319—where buyers might step back in, or the downtrend continues toward the deeper supply base.
