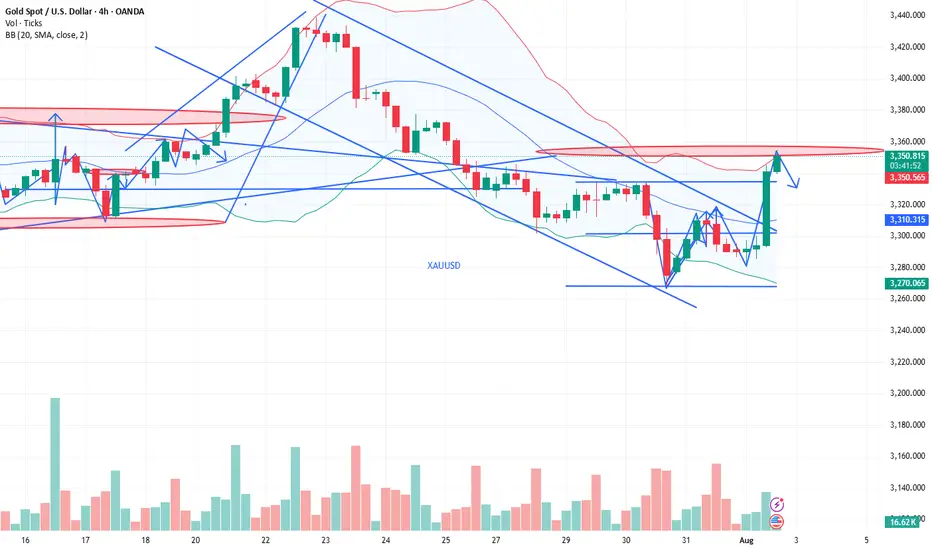
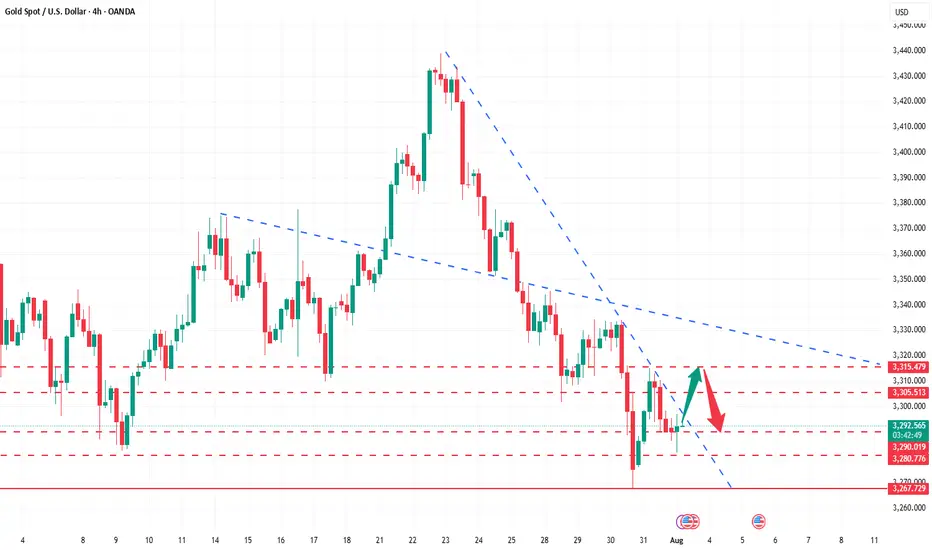
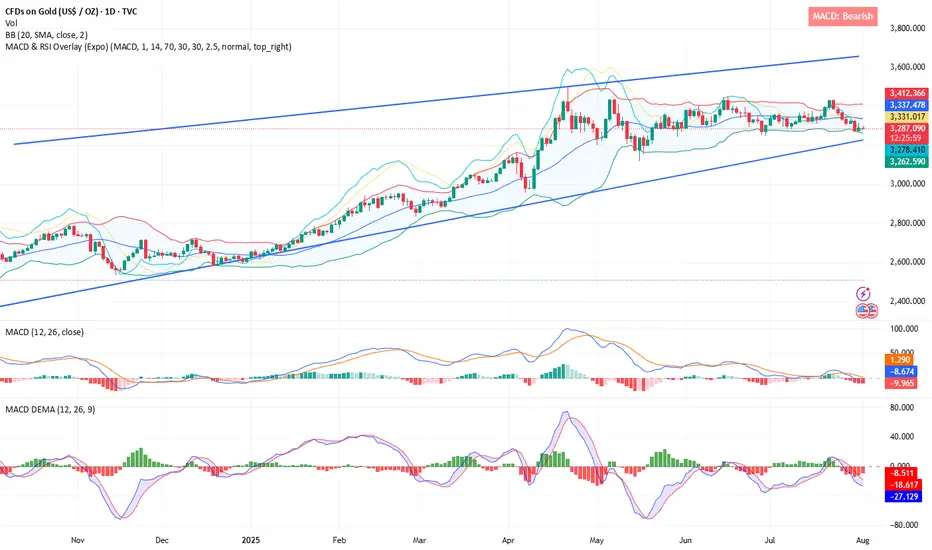
XAUUSD shows short-term bearish divergence.XAUUSD shows short-term bearish divergence.
On August 1 gold increased dramatically after the NFP report data came out. No wonder, recession risks generally drive XAUUSD higher due to increased safe-haven demand, a weaker dollar, and expectations of lower interest rates. Gold’s negative correlation with equities and its role as an inflation hedge make it a preferred asset during economic uncertainty.
However, on short-term timeframe, the bullion shows bearish divergence, the asset is to overbought and needs some downward correction in order to cool down a bit. Additionally, the price is retesting former trendline from below. The decline towards 3,300.00 is expected.
Xauusdshort

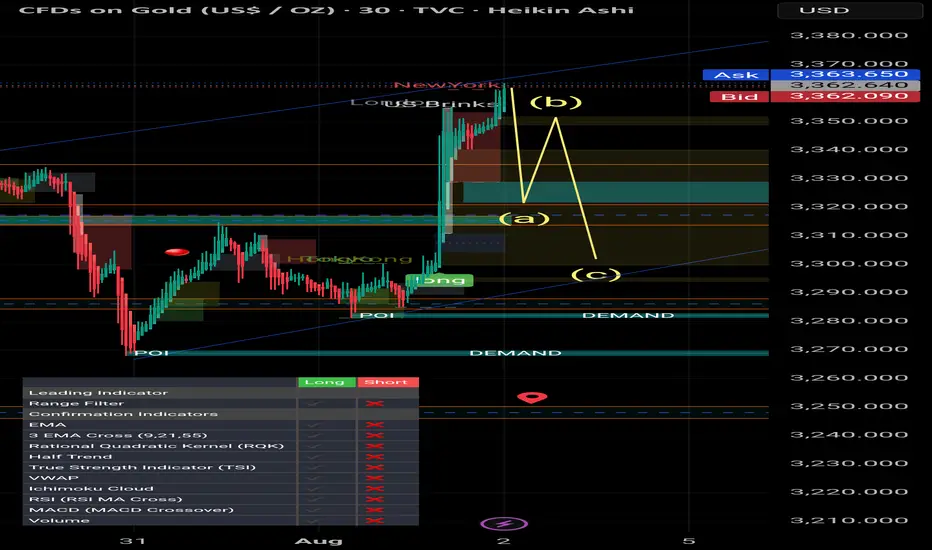
Smart Money / Price Action 5min scalping road map# 📈 ABC Pattern Explained for TradingView (Smart Money / Price Action)
The **ABC pattern** is a 3-leg corrective move in market structure, commonly used in price action, Elliott Wave, and Smart Money trading. It's mainly used to identify **pullbacks** or **correction zones** before a continuation of the main trend.
---
## 🔹 Structure of the ABC Pattern:
- **Point A**: The beginning of the move — often the end of a strong impulsive wave.
- **Point B**: The first retracement or pullback from Point A.
- **Point C**: The second corrective move that often goes beyond A, forming the completion of the correction phase.
The ABC legs can be:
- **A to B**: Impulsive or corrective.
- **B to C**: Generally a counter-trend retracement.
---
## 🔸 How to Identify on Chart:
1. **Find a strong trend** (uptrend or downtrend).
2. **Look for the first correction** — mark it as Point A to B.
3. **Next wave** that attempts to continue the trend but fails — mark the end as Point C.
4. **Use Fibonacci tools** to measure:
- **B retracement of A** (typically 50%–78.6%)
- **C extension** of AB (typically 127.2%–161.8%)
---
## 🔧 How to Draw on TradingView:
> You can use the `Trend-Based Fib Extension` tool or draw manually using the `Path` or `ABC pattern` tool.
### Step-by-Step:
1. Select the `ABC Pattern` tool from the **left toolbar** under “Prediction and Measurement Tools”.
2. Click on **Point A** (3320$).
3. Click on **Point B** (3350$).
4. Click on **Point C** (final corrective wave 3300$ ).
5. TradingView will automatically plot the shape with labels.
---
## 🧠 Pro Tips:
- Look for **liquidity sweep** or **order blocks** near Point C.
- Entry opportunity is often **after C**, targeting a **continuation** of the main trend.
- ABC is often part of **larger structures** like **complex pullbacks** or **smart money retracements**.
---
## ✅ Example Use:
- **Buy Scenario**:
- Strong uptrend → Price drops from A to B (retracement).
- Then price rises to C, failing to break above A → Possible new higher low formed.
- Enter long if price breaks above Point B again.
- **Sell Scenario**:
- Strong downtrend → A to B is a pullback.
- C attempts new high, fails → short entry after break of B.
---
## 📌 Settings Tip for Mobile Users:
- Zoom in for better point control.
- Use “Lock” feature to prevent accidental move.
- Customize color and label visibility in the style tab.
---
## 🔍 Keywords:
`ABC Pattern`, `Elliott Correction`, `Smart Money`, `Liquidity Grab`, `Break of Structure`, `Trend Continuation`, `Price Action Trading`, `Market Structure`
---
Gold is in the Bearish Direction after Formation ManipulationHello Traders
In This Chart GOLD HOURLY Forex Forecast By FOREX PLANET
today Gold analysis 👆
🟢This Chart includes_ (GOLD market update)
🟢What is The Next Opportunity on GOLD Market
🟢how to Enter to the Valid Entry With Assurance Profit
This CHART is For Trader's that Want to Improve Their Technical Analysis Skills and Their Trading By Understanding How To Analyze The Market Using Multiple Timeframes and Understanding The Bigger Picture on the Charts
Nonfarm Pay Attention Zone✏️ OANDA:XAUUSD is recovering and increasing towards the resistance zone of yesterday's US session. The 3315 zone is considered a strategic zone for Nonfarm today. A sweep up and then collapse to the liquidity zone of 3250 will be scenario 1 for Nonfarm today. If this important price zone is broken, we will not implement SELL strategies but wait for retests to BUY. It is very possible that when breaking 3315, it will create a DOW wave with the continuation of wave 3 when breaking the peak of wave 1.
📉 Key Levels
SELL trigger: Reject resistance 3315.
Target 3250
BUY Trigger: Break out and retest resistance 3315
Leave your comments on the idea. I am happy to read your views.

Gold (XAU/USD): Supply Zone Rejection & Bearish Breakdown Chart Breakdown:
Supply zone rejection: Gold revisited the “supply zone” (light green/grey area) and failed to break above — a classic signal of seller dominance.
Uptrend invalidated: A sharp rise (steep black trendline) ended with a peak marked by the green arrow, followed by a decisive breakdown.
Ichimoku Cloud test: Prices slipped through the Ichimoku components, reinforcing the shift to bearish sentiment.
Potential targets: The red/green risk‑reward box highlights a short position, targeting ~3,347 then ~3,318 levels (blue labels) as initial support zones.
Strong supply base: The extensive grey zone below marks a "stronger supply zone" — this could cap any modest bounce and keep the downtrend intact.
🔍 Interpretation:
Bias: Bearish — sellers have taken control after a failed breakout.
Strategy: Short on rallies toward the mid‑green/red box (~3,373–3,380), targeting ~3,347 first and then ~3,319. Watch for support at the strong supply region (~3,292) for potential reversal or consolidation.
Risk management: Keep stop above the red zone—above recent highs (~3,380+) to limit risk.
🚀 In a nutshell: After failing to break supply and losing its short‑term uptrend, gold appears poised for a pullback. The next key levels to watch are ~3,347 and ~3,319—where buyers might step back in, or the downtrend continues toward the deeper supply base.

Gold (XAU/USD) in Symmetrical Triangle – Short‑Term Squeeze,Price Structure & Technical Setup
Gold is consolidating within a symmetrical triangle, showing lower highs and higher lows—a classic precursor to breakout in either direction
Fxglory Ltd
+5
TradingView
+5
Babypips.com
+5
TradingView
+2
Babypips.com
+2
TradingView
+2
.
Trendlines converge tightly around $3,326–$3,334, hinting at imminent directional acceleration
Investopedia
+4
TradingView
+4
TradingView
+4
.
🎯 Key Levels & Targets
Scenario Trigger Confirm Area Targets Stop Loss
Bullish Breakout above $3,344–$3,350 $3,369 → $3,396 → $3,422–$3,550 ~$3,340
Bearish Breakdown below ~$3,326–$3,320 $3,320 → $3,300 → $3,297 → $3,255 ~$3,335–$3,340
A breakout above $3,344–$3,350 validated with volume may drive prices toward $3,400+, with extended targets up to $3,550 or higher in bullish conditions
Traders Union
Time Price Research
.
A drop below $3,326–$3,320 risks further decline, targeting $3,300, $3,297, and eventually $3,255 if breakdown momentum builds .
📉 Market Context & Drivers
U.S. dollar strength, easing safe-haven demand, and optimistic trade sentiment are constraining gold’s upside unless breakout forces emerge .
Key upcoming catalysts: FOMC guidance, U.S. macro data (GDP, inflation), and geopolitical developments—their tone could tip the bias direction .
⚙️ Trade Rules & Risk Management
Wait for a confirmed breakout or breakdown—do not trade mid-range.
Confirm break with at least one close outside the triangle and rising volume .
Position sizing: Risk 1–2% per trade, adjust stop-loss to price structure ($8–$15 depending on volatility).
Take profits in stages: scale out at minor milestones (first targets), trail stop for extended targets.
Avoid chasing price within the middle of the triangle—risk/reward is unfavorable.
🧠 Why This Plan?
Follows textbook symmetrical triangle trading methodology: entry on breakout, stop beyond pattern opposite side, projection based on triangle height .
Aligns with broader outlook: bearish unless convincing upside breakout appears, consistent with analyst consensus hedging current bull exhaustion and wait‑and‑see on policy signals .
✅ Summary
Gold is coiling inside a tight triangle range near $3,326–$3,334, with breakout potential identified to either side:
Bullish breakout over $3,344–$3,350 targets up to $3,550 or beyond.
Bearish breakdown under $3,326–$3,320 risks slide towards $3,300–$3,255.
Wait for confirmation, apply disciplined risk controls, and let volume validate the move.

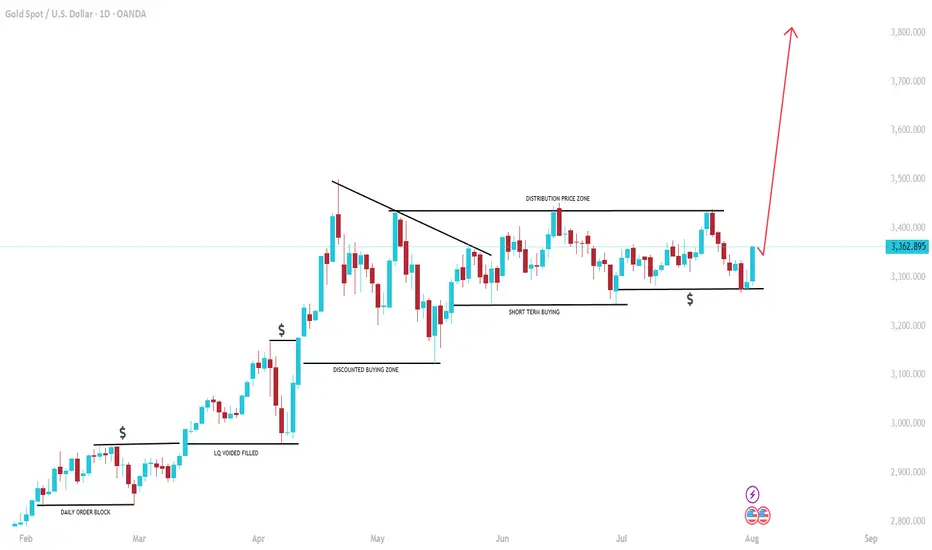
GOLD: $4000 on the way! Bulls has the controlGold is on the way hitting a record high since the global tension rising we can see gold creating another record high. Please note that it is a swing trades and may take weeks and months to hit the target or it may not even reach the target itself. This is prediction only so do your own due diligence.
Gold Surges on Non-Farm Data; 3330 Key Next WeekGold was strongly boosted by the significantly bullish non-farm payroll data, surging sharply like a rocket 🚀, with gains that completely "wiped out" all the weekly losses. The current gold trend, as if injected with super momentum, has completely broken the previous long-short stalemate. Starting from the 3300 level, it has been breaking through obstacles all the way up to 3350. At present, 3330 is like a critical "battleground" ⚔️ fiercely contested by both long and short sides.
This week, when gold was still "lingering" below 3300, I emphasized repeatedly that a rebound was inevitable – we just needed to stay calm and wait for the opportunity. As it turns out, our judgment was spot on, and we successfully took profits around 3340, reaping good gains 💴. Now, gold prices are oscillating back and forth in the 3340-3350 range. Based on a comprehensive analysis of the current trend, I boldly predict that gold is likely to pull back to around 3330 next week, so everyone can prepare in advance 🤗
⚡️⚡️⚡️ XAUUSD ⚡️⚡️⚡️
🚀 Sell@ 3350
🚀 TP 3330 - 3320 - 3310
🚀 Buy@ 3300 -3310
🚀 TP 3320 - 3330 - 3340
Daily updates bring you precise trading signals 📊 When you hit a snag in trading, these signals stand as your trustworthy compass 🧭 Don’t hesitate to take a look—sincerely hoping they’ll be a huge help to you 🌟 👇

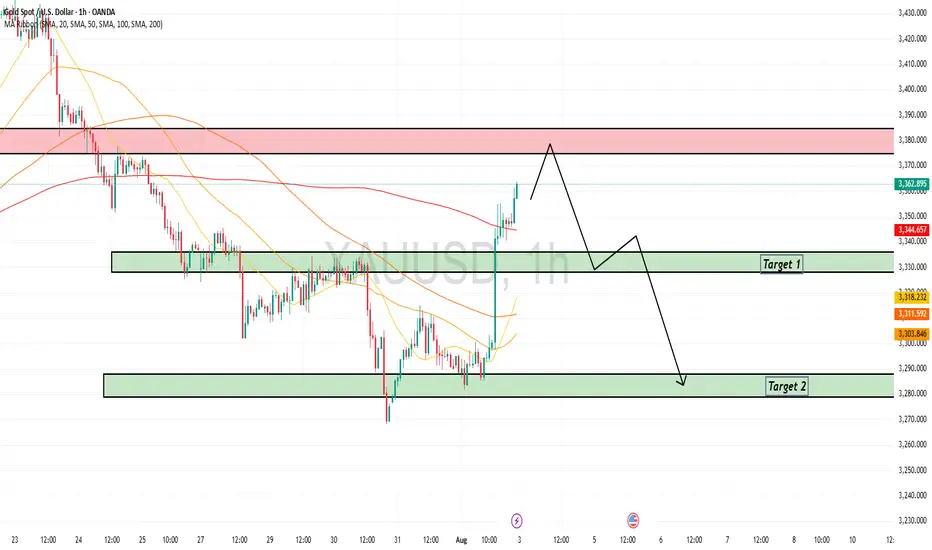
GOLD Correction Ahead!
HI,Traders !
#GOLD is growing strongly
And the pair looks locally
Overbought so after it
Hits the horizontal resistance
Area around 3374.56 we will
Be expecting a local bearish
Correction and a move down !
Comment and subscribe to help us grow !

XAUUSD:Swing Sell Is Highly Likely! Get ReadyWe expect a smooth drop in gold prices, with prices potentially dropping around the 3250 area. Use Accurate Risk Management.
Please like and comment!
Team Setupsfx_
How to seize the key turning points in the gold market?The market is ever-changing, and following the trend is the best strategy. When the trend emerges, jump in; don't buy against it, or you'll suffer. Remember not to act on impulse when trading. The market is a haven for all kinds of resistance, so don't hold onto positions. I'm sure many people have experienced this: the more you hold onto positions, the more panic you become, leading to ever-increasing losses, poor sleep, and missed opportunities. If you share these concerns, why not try following Tian Haoyang's lead and see if it can open your eyes? I'm always here for you if you need help, but how can I help you if you don't even offer a hand?
Gold did not fall below 3280 during the day on Friday and started to fluctuate in the range of 3280-3300. The non-farm payroll data was bullish, and it directly broke through the pressure of 3315, and then broke through the important pressure of 3335 again. As of now, it has reached a high near 3355. The non-farm payroll data market has almost been exhausted. Next, we will focus on the technical form adjustment. At present, you can consider light shorting in the area near 3355-3370. After all, chasing long is risky, and the technical side needs to be adjusted. If your current operation is not ideal, I hope I can help you avoid detours in your investment. Welcome to communicate with me.
Based on the 4-hour chart, short-term resistance is near 3355-3365, with a focus on the key resistance level of 3370-3375. Short-term buy orders should be taken if a rebound continues. I'll provide detailed trading strategies at the bottom of the page, so stay tuned.
Gold operation strategy: Short gold in batches when gold rebounds to 3355-3370, with the target being the area around 3340-3335. Continue to hold if it breaks through.

Gold is significantly bullish, where can we short?The positive non-farm payroll report pushed the market from 3300 directly above 3330, demonstrating overall bullish momentum. Congratulations again, everyone. Real-time strategies are like a beacon guiding your investment journey. The market will never disappoint those who persevere and explore wisely. Charlie advises against blindly chasing highs. Trading advice (first hit is valid): Focus on key support levels: 3300 and 3310. Go long if these levels are reached.
~For those who want to go short above 3350-55, only use a stop-loss and feel free to try~ PEPPERSTONE:XAUUSD FXOPEN:XAUUSD ACTIVTRADES:GOLD FXOPEN:XAUUSD CMCMARKETS:GOLD VANTAGE:XAUUSD VELOCITY:GOLD
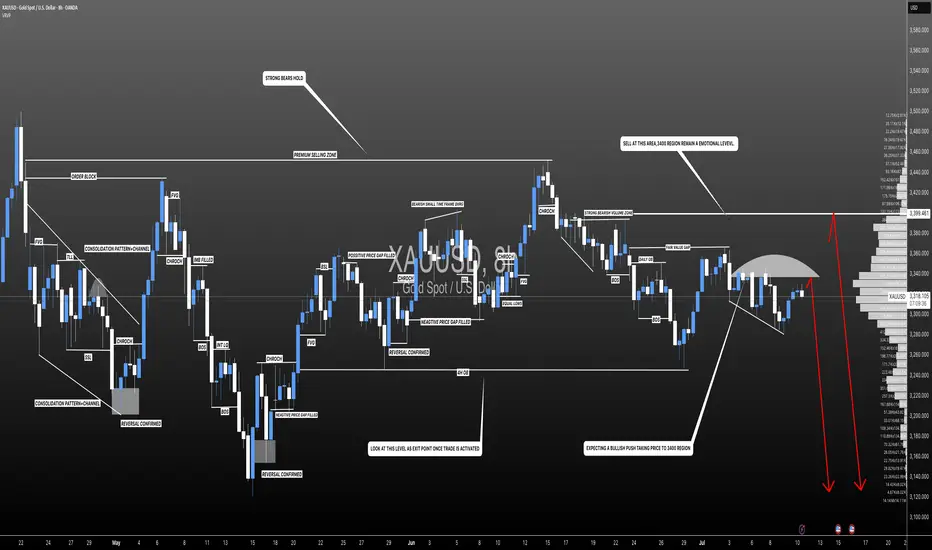
XAU/USD GOLD NFP DIRECTIONThis chart analysis is for XAU/USD (Gold vs. U.S. Dollar) on the 4-hour timeframe. The focus is on a bearish market structure, highlighting potential Price of Interest (POI) zones for a short (sell) setup.
Key Elements:
Market Structure: Clear downtrend with lower highs and lower lows.
POIs Identified:
Optional POI: An initial supply zone where price might react.
Extreme POI: A more significant supply zone marked for a stronger potential reversal.
Labels & Notes:
The price levels are marked between 3,320 – 3,340, showing where the reversal is expected.
Interpretation:
The chart anticipates a retracement upward into the POIs before continuing the bearish move. Traders may look to enter short positions around these zones, especially the Extreme POI, which is seen as a high-probability reversal area.

XAUUSD ultra-short-term sell trade.The hourly chart still shows a downward trend. Short-term downward pressure will continue. If you want to trade in the London market, consider selling at high levels and pursuing short-term trend trading.
3300-3295 SELL
TP3285-3280

XAUUSD – Demand Zone Reaction & Potential Markup (VSA Analysis)💡 Idea:
Gold is testing a major 4H demand zone with early signs of smart money accumulation. VSA signals show supply exhaustion and potential for a bullish reversal toward upper resistance.
📍 Trade Setup:
Entry Zone: 3,265 – 3,285 (current demand zone)
Target 1: 3,380 – 3,400 (mid supply zone)
Target 2: 3,440 – 3,460 (major supply zone)
Stop Loss: Below 3,240 (to avoid false breakouts)
R:R Potential: ~3:1
📊 Technical Reasoning (VSA)
Stopping Volume Detected
On the recent drop into the demand zone, a wide spread down-bar on ultra-high volume appeared, followed by no further downside progress.
This is a classic stopping volume pattern where professional money absorbs selling pressure.
No Supply Confirmation
Subsequent candles inside the zone show narrow spreads on decreasing volume, indicating a lack of genuine selling interest.
Demand vs Supply Shift
Multiple attempts to break below 3,265 have failed, showing absorption of supply and positioning for markup.
If price rallies from here on increasing volume and wider spreads up, it would confirm demand dominance.
Structure Context
This demand zone has historically produced strong rallies.
Break above the minor resistance inside the zone could trigger a swift move toward Target 1, with momentum possibly extending to Target 2.
📌 Trading Plan:
Look for bullish confirmation bars with high volume before entry.
If price breaks below 3,240 on high volume, invalidate the long setup and watch for the next demand level around 3,140.
Partial profits can be taken at Target 1, and the remainder trailed toward Target 2.

Gold Slips After Powell Speech Below 3320 Bearish Pressure BuildGOLD Overview
Market Context:
Gold declined from the 3333 level, as anticipated in yesterday’s analysis, ahead of Fed Chair Powell’s speech. Powell reiterated that it is still too early for rate cuts, citing persistently high inflation, which supported the U.S. dollar and pressured gold.
Technical Outlook:
As long as gold trades below the 3320–3310 zone, the bearish momentum is expected to continue, with the next target at 3285. A confirmed break and stability below 3285 could open the way toward 3255.
To regain bullish traction, the price must stabilize above 3320.
Support Levels: 3285 • 3255
Resistance Levels: 3333 • 3349

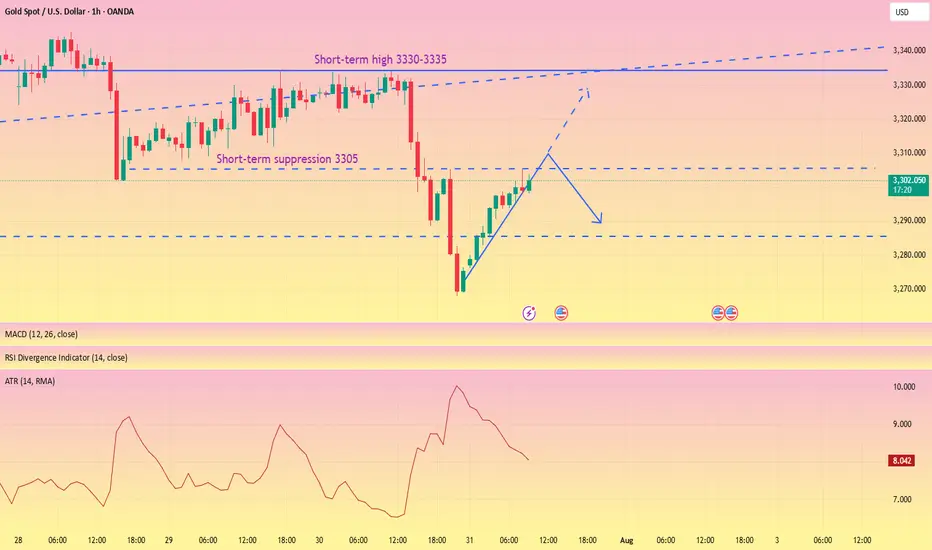
The rebound is weak, short orders intervene#XAUUSD
After two consecutive trading days of volatility, gold finally began to fall under pressure near 3335. After breaking through the 3300 mark, the price of gold accelerated its decline, reaching a low of around 3268, and yesterday's daily line closed with a large negative line. 📊
Today's rebound is more likely to be based on the buffering performance of the impact of news. The ATR data also shows that the bullish momentum is slowly weakening in the short term. 🐻After digesting the impact of yesterday's news through rebound during the day, it may fall again in the future.📉
📎The primary focus today is 3305 above, which was also the high point of yesterday's pullback correction. If the gold price rebounds to 3305-3320 and encounters resistance and pressure,📉 you can consider shorting and look towards 3290-3270.🎯
If the short-term gold rebound momentum is strong and breaks through the 3305-3320 resistance area, it will be necessary to stop loss in time. Gold may be expected to touch yesterday's high resistance of 3330-3335, which is the second point to consider shorting during the day.💡
🚀 SELL 3305-3320
🚀 TP 3290-3270
The idea of shorting on rallies below 3315 remains unchanged.Gold remains generally weak, with multiple rebounds showing signs of fatigue. The upward moving average continues to suppress prices, indicating that the bearish trend remains intact, and the short-term market outlook remains bearish. Trading strategies remain bearish today, with a key focus on the 3300-3315 area, a key short-term resistance zone. If the market rebounds before the US market opens and approaches this area, or if a clear topping signal appears near this range, consider entering a short position. Today will see the release of the non-farm payroll data, which may influence the market's trajectory. We recommend prioritizing short-term trading before the release, and reconsidering the market's direction based on market feedback after the release. Structurally, gold continues to exhibit a volatile downward trend, with lower highs and lower lows. Today's low is expected to be lower than yesterday's. Short-term short positions are focused on 3285-3280, with a break below this level potentially allowing for further declines. Please carefully time your entry, strictly implement risk management, and avoid emotional trading.
Gold’s Glitter Fades: Why $3,250 Is the Next Big Drop🧠 Fundamental Analysis
Despite recent bullish momentum, several macroeconomic and policy-driven headwinds could pressure gold prices lower toward the $3,250 mark:
1. **Fed Policy Shifts (Higher for Longer):**
The Fed’s persistent “higher-for-longer” stance on interest rates has kept real yields elevated. With the U.S. economy still showing resilience (strong labor market, consumer spending), markets are pricing out aggressive rate cuts. Higher real yields reduce gold’s appeal as a non-yielding asset.
2. **Strengthening U.S. Dollar (DXY):**
Renewed dollar strength, driven by global risk aversion and higher U.S. yields, is acting as a headwind for gold. Since gold is priced in dollars, a rising DXY typically puts downward pressure on bullion.
3. **China & India Demand Weakness:**
Physical gold demand in key markets like China and India has been softening. High local prices, subdued consumer sentiment, and tighter liquidity conditions in China are dampening jewelry and investment demand.
4. **Geopolitical Easing:**
As geopolitical tensions (e.g., Middle East or Ukraine) show signs of stabilization, the fear premium embedded in gold could start to unwind.
---
## 📉 Technical Analysis – Bearish Setup to $3,250
From a chartist’s view, gold shows early signs of technical exhaustion and potential reversal:
1. **Rising Wedge Breakdown:**
Gold recently broke down from a **rising wedge pattern** on the daily timeframe—a classic bearish continuation setup. Price failed to hold the breakout above \$2,450 and is now forming lower highs.
2. **Bearish Divergence (RSI & MACD):**
Both RSI and MACD are flashing **bearish divergence** on the weekly chart. While price made new highs, momentum indicators did not confirm—suggesting weakening buying pressure.
3. **Fibonacci Retracement Targets:**
A pullback toward the **50% retracement** of the March–July rally aligns closely with the \$3,250 level. This would be a logical technical correction zone.
4. **Volume Profile Gaps:**
The VPVR (Volume Profile Visible Range) shows a low-volume node around $3,250, implying weak support. If price breaches the $3,400 psychological level, a swift drop to $3,250 is plausible.
5. **Elliott Wave Perspective:**
If the recent top was wave 5 of a larger impulsive structure, we may now be entering an **ABC corrective wave**, with Wave C potentially targeting the $3,250 area.
---
## 📍 Key Levels to Watch
* **Resistance:** $3,420 $3,500
* **Support:** $3,400 → $3,250 → $3,000
* **Trigger Point:** Break below $3,400 with volume confirmation
---
## 📊 Strategy Notes
* **Short Bias**: Watching for rallies to short near \$3,400–\$3,450 with tight stops.
* **Risk Management**: Be cautious around key macro events (NFP, CPI, FOMC).
* **Confluence is Key**: Look for alignment between macro headwinds and chart setups.
---
📌 **Conclusion:**
While gold’s long-term bull thesis remains intact, a medium-term correction to $3,250 appears increasingly likely due to weakening fundamentals, overbought technical conditions, and waning momentum. Traders should prepare for volatility and focus on disciplined execution around key support zones.

Gold (XAU/USD) 1H Chart – Trendline Support and Upside TargetGold price is trading above the support trendline around 3,287. A bounce from this level could drive price toward the 3,313 resistance and potentially the 3,333 target. Maintaining support above 3,287 is key for the bullish outlook.

How to correctly grasp the gold trading opportunities?Yesterday, gold prices saw a technical rally amidst volatile trading, followed by a downward trend under pressure. Bulls strongly supported a rebound at 3280 in the Asian session. The European session saw an accelerated upward move, breaking through 3314 before retreating under pressure. We also precisely positioned short positions below 3315, achieving a perfect target of 3290-3295. During the US session, the market again faced pressure at 3311, weakening in a volatile trend before breaking through 3300. The daily chart ultimately closed with a medium-sized bullish candlestick pattern, followed by a pullback and then a decline.
Overall, after yesterday's rebound, gold prices remain under pressure at the key resistance level of 3314. The short-term bearish weakness line has moved down to this level. If pressure continues in this area in the short term, gold will maintain a weak and volatile structure, with intraday trading remaining focused on rebounds and upward moves. If you are currently experiencing confusion or unsatisfactory trading strategies, please feel free to discuss your options and help avoid investment pitfalls.
From a 4-hour analysis perspective, focus on resistance at 3305-3315 on the upside. A rebound to this level is a good opportunity to short against resistance. Focus on support at 3280-3270 on the downside. Unless the price stabilizes strongly, consider not entering long positions below this level. The overall strategy remains to short on rebounds, with the same rhythm. I will provide timely notifications of specific levels from the bottom, so keep an eye on them.
Gold Trading Strategy: Short on rebounds near 3305-3315, with targets at 3290-3280-3270.
Waiting for non-farm payroll dataGold prices (XAU/USD) remained under pressure in Asian trading on Friday, trading below $3,300, not far from the January low reached earlier this week. Gold failed to extend its modest overnight rebound, primarily due to the strong US dollar.
The Federal Reserve's latest hawkish tone has prompted a reassessment of the timeline for interest rate cuts, boosting demand for the US dollar and weighing on the non-interest-bearing asset, gold.
The US dollar index rose for the seventh consecutive day, reaching a new high since late May, further weakening gold's appeal. Key to the dollar's momentum lies in the latest inflation data: the US PCE price index rose to 2.6% year-on-year in June, while the core index remained stable at 2.8%, exceeding market expectations and reinforcing the view of persistent inflation.
"Both inflation data and GDP data suggest the US economy remains resilient, giving the Fed little reason to rush into easing," said a Fed observer. "This limits gold's near-term potential as a hedge."
Meanwhile, US President Trump signed an executive order on Thursday imposing import tariffs ranging from 10% to 41% on several trading partners, including Asian countries. Countries with trade deficits will face tariffs of at least 15%. This move has heightened global trade concerns, boosted market demand for safe-haven assets, and provided some support for gold.
Despite this, gold prices remain mired in a downward trend. Investors are generally maintaining a wait-and-see approach, awaiting Friday's release of the US July non-farm payroll report. This data is seen as a key indicator of economic resilience and the interest rate outlook. Expectations suggest an increase of 110,000 jobs and a slight rise in the unemployment rate to 4.2%.
The daily gold chart shows that prices are in a weak consolidation phase, capped by key resistance near $3,320. If gold prices fail to break through this area, there is a risk of further decline in the short term. Stronger resistance lies above $3,350. A breakout on strong volume could trigger a rebound towards the $3,380 area, potentially pushing the price above $3,400.
As for downside support, the 100-day moving average provides initial support near $3,270. A break below this could trigger further downward pressure, targeting the $3,240 area, the June low. A further break below this level would target the psychologically important $3,200 level.
In terms of indicators, the MACD death cross continues, with a shortening red bar, indicating weakening bearish momentum but no reversal. The RSI remains in neutral to weak territory, not clearly oversold.
The current gold trend is characterized by a "structurally bearish, sentimentally supportive" pattern. Despite the trade war and heightened global risk aversion, the Federal Reserve's caution about inflation and the strong dollar are exerting significant pressure.
If the July non-farm payroll data is strong, gold could test further technical support. Conversely, weak data or a pullback in the dollar could trigger a technical rebound. PEPPERSTONE:XAUUSD ACTIVTRADES:GOLD VANTAGE:XAUUSD FOREXCOM:GOLD EIGHTCAP:XAUUSD FOREXCOM:GOLD
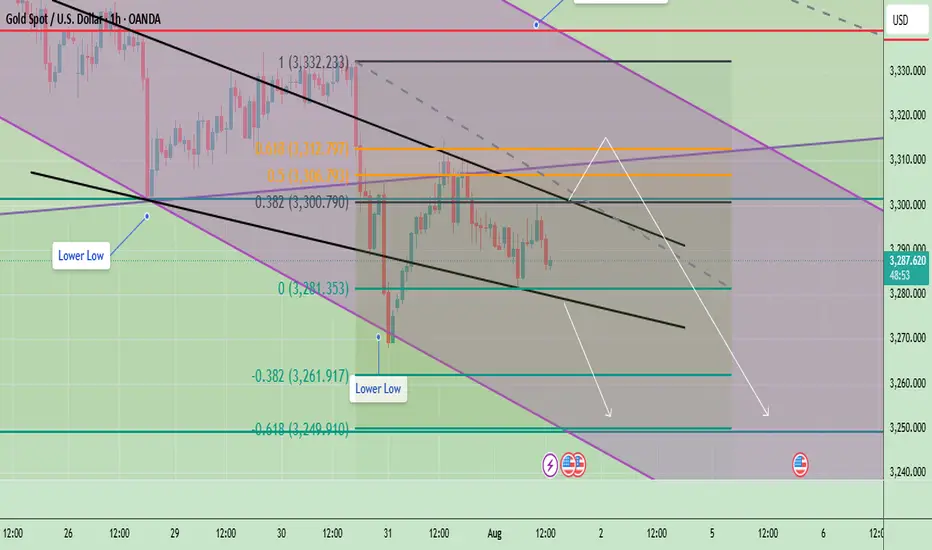
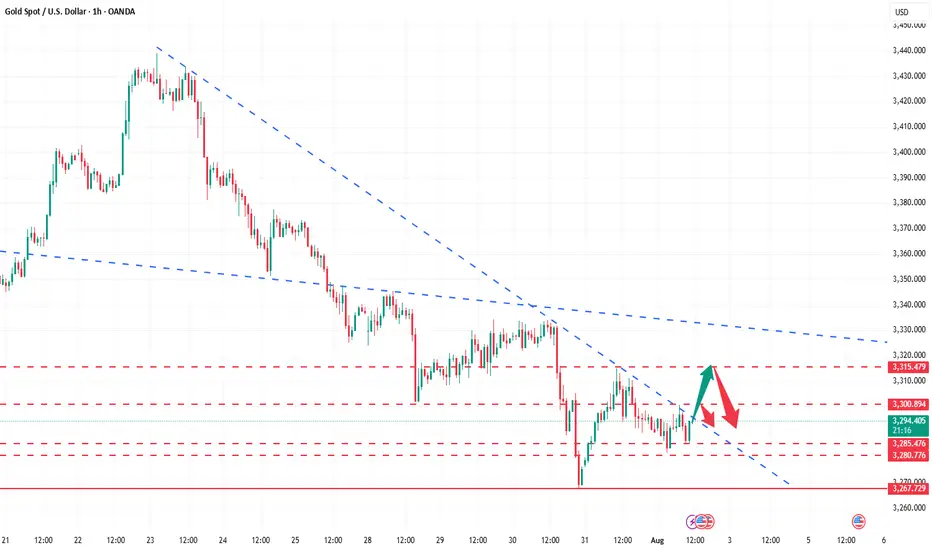
Gold Price Consolidates in Symmetrical Triangle, Breakout Ahead?Gold shows a clear bearish trend within a well-defined downward channel. Price action continues to form lower highs and lower lows, reinforcing the ongoing downtrend. The recent rejection from $3,312 suggests that bulls are struggling to regain control, and the market remains pressured by selling momentum. The price is currently hovering near $3,287 just above horizontal support zone.
📉 Potential Scenarios
- Bearish Continuation (Most Likely)
- If price continues to stay below $3,300 and breaks below $3,281, it may aim for $3,261 and $3,249.
- A close below $3,281 would confirm further bearish pressure and signal downside continuation toward the $3,240s range.
- Short-Term Bullish Retracement
- If price holds above $3,281 and breaks above $3,300–$3,312, a relief rally may occur at first resistance: $3,306 and second resistance: $3,312.
- However, unless gold breaks above $3,332 (previous swing high), this would still be considered a bear market rally.
- Range-bound Movement
- A third scenario is sideways price action between $3,281 and $3,312, where neither bulls nor bears take control immediately. This would represent market indecision or awaiting external catalysts (e.g., economic data, Fed policy).
🔍 Trend Outlook
- Short-Term Trend: Bearish
- Medium-Term Trend: Bearish, unless price breaks and sustains above $3,312
- Long-Term Trend: Neutral-to-bullish, as long as price holds above the macro support zone near $3,240
1D Chart Long Term Possible Scenario
The price is currently trading around $3,285, sitting just above the triangle’s ascending trendline support and within a key horizontal demand zone around $3,250–$3,300, which has held multiple times in the past.
If bulls manage to push the price above $3,360–$3,400, it could confirm a breakout and open the door toward the next major resistance at $3,450. However, if price fails to hold above the current ascending trendline, a breakdown could retest the base support near $3,248 or even lower toward $3,150
Gold is currently in a neutral consolidation phase within a symmetrical triangle, with both bullish and bearish breakout scenarios possible. The breakout direction from this pattern—expected in the coming weeks, will likely set the tone for gold's medium-term trend.
Note
Please risk management in trading is a Key so use your money accordingly. If you like the idea then please like and boost. Thank you and Good Luck!