Gold Peaked, Deep Analysis: MACD & RSI, Targets: $3,131 & $2,904Gold (XAUUSD) already peaked. The 22 Apr session was a clear top signal. A very strong one at that. The chart is showing a lower (red arrows) and overall distribution channel. Trading volume continues to drop. Bearish volume is predominant.
Gold produced a strong rally, it lasted 159 days. Total growth amounts to +39% from bottom to top, starting November 2024, end April 2025.
It's been 64 days since the all-time high. No new highs, no bullish momentum. Geopolitical factors that would push Gold to new all-time highs, a war, did show up recently, a surprise event and yet Gold's price failed to move higher. This is a warning signal.
The RSI is weak now. Gold is trading very high, a very strong price but with a risk RSI. This is another warning signal, a strong one. Bullish would be the contrary, low price with a strong RSI. A weak RSI at this point can be interpreted as the bullish force being exhausted.
The daily MACD is pretty bad. Trending fully down with no possibility of anything bullish. Here is the chart.
This is a friendly reminder. Switch to Crypto.
You've been warned.
Namaste.
Xauusdshort

BTC continues to short at high levels during the day📰 Impact of news:
1. Geopolitical impact
📈 Market analysis:
BTC has reached an intraday high of 108,125, just one step away from the all-time high of 112,000. With the increase in trading volume and institutional sentiment turning bullish, the momentum seems to be in the bulls' favor. In addition to institutional buying, the ceasefire agreement in the Iran-Israel war is also an important factor in Bitcoin's sharp rebound. Trump's announcement of the end of the war almost immediately triggered a surge in the cryptocurrency market. However, the overall pattern has not changed, and the range resistance has not been broken, so we still keep the idea of shorting at high levels.
🏅 Trading strategies:
SELL 108000-107500
TP 104500-103500
If you agree with this view, or have a better idea, please leave a message in the comment area. I look forward to hearing different voices.

Continue to short gold!Gold prices rose modestly on Wednesday, mainly benefiting from the US dollar index hovering at a one-week low and the low US bond yields, which boosted the purchasing power of non-dollar investors. The market is closely watching the situation in the Middle East, and the fragile ceasefire between Israel and Iran is still uncertain. However, as the conflict between the two sides has temporarily eased, the geopolitical risk premium that had previously pushed up gold has gradually dissipated, and safe-haven funds have continued to flow out of the gold market, limiting the room for gold prices to rebound.
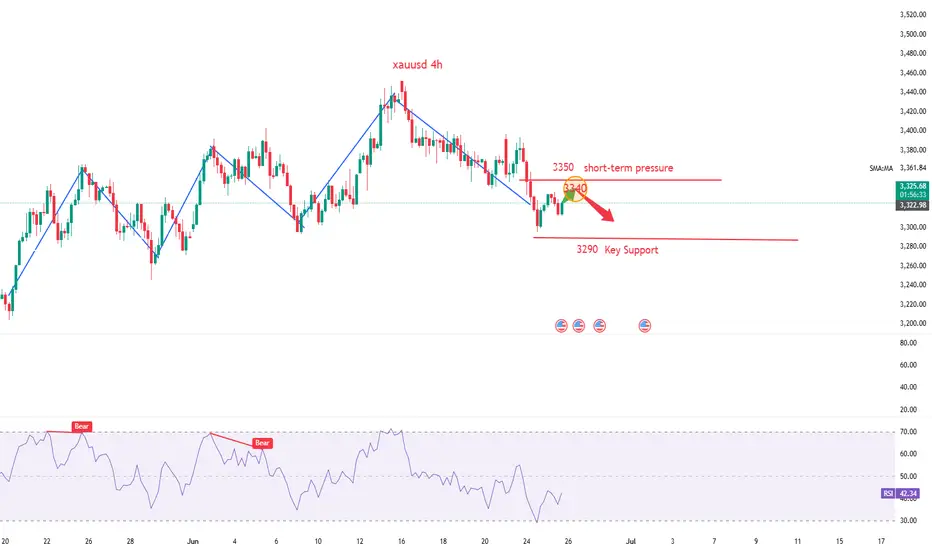
Technically, gold closed with a big negative line on the daily line, recording the seventh consecutive week of decline, which significantly undermined the recent bullish pattern. The current market sentiment is clearly bearish. After the sharp drop last night, there may be a technical adjustment today, but the 3347-level high point above has become a key resistance. If it cannot be broken, the short-term pressure situation will remain unchanged. The downward support focuses on the 3300-level area. If it is lost, it may further test the previous low of 3290, or even fall to the important turning point of 3274. Overall, the decline of the US dollar brings short-term respite, but the technical selling pressure and the fading of risk aversion continue to suppress the rebound momentum of gold. It is expected to maintain a weak and volatile trend in the short term.

Short gold after reboundGold rebounded after touching 3312, and has now rebounded to 3330, but the rebound strength is far less than the decline strength, so the overall performance of gold is still weak. Because gold fell sharply yesterday, the market bullish confidence suffered a heavy blow, and there are many resistances above after gold fell and broke, and it is under pressure at 3340-3350 in the short term, and there is a technical gap above that suppresses the 3360-3370 area.
Therefore, before gold stabilizes in the 3360-3370 area, the short-selling force still has the upper hand, so we still focus on shorting gold in trading. We can consider shorting gold with the 3340-3350 area as resistance, and look at the target area of 3320-3310.
The Premium privilege of my account will end on June 26, and it will stop updating here from tomorrow. Friends in the channel have already made a lot of money by following my trading strategies. Friends who have not joined yet can join and receive the latest trading strategies and trading signals in the first time to protect your trading!

Suppression remains unchanged, the latest layout of gold📰 Impact of news:
1. Powell's testimony
2. Geopolitical impact
📈 Market analysis:
The short-term rebound of gold is the release of energy for the accumulated bulls. From the current market trend, 3340 above is the key point of the short-term watershed between bulls and bears. The short-term resistance above is around 3342-3348, and the short-term support below is around 33220-3315. If it falls below this, it will continue to look towards yesterday's low of 3290-3280. The daily level is under pressure and continues to see a decline and adjustment. If it touches 3340-3350 above, you can try to short. After it retreats to 3320-3315 and obtains effective support, you can consider going long.
🏅 Trading strategies:
SELL 3340-3350
TP 3330-3320-3315
BUY 3320-3315
TP 3330-3340-3350
If you agree with this view, or have a better idea, please leave a message in the comment area. I look forward to hearing different voices.
OANDA:XAUUSD FX:XAUUSD FOREXCOM:XAUUSD FXOPEN:XAUUSD TVC:GOLD

Gold is overall dominated by bearish sentiment.On Wednesday, gold prices edged higher, mainly driven by the U.S. Dollar Index hovering near a one-week low and depressed U.S. Treasury yields, which enhanced purchasing power for non-U.S. dollar investors. The market remained focused on the Middle East situation, as the fragile ceasefire between Israel and Iran still held uncertainties. However, with the temporary de-escalation of conflicts between the two sides, the geopolitical risk premium that previously boosted gold gradually dissipated, and safe-haven funds continued to flow out of the gold market, limiting the upside space for gold prices.
Technically, gold's daily chart formed a large bearish candle, notching the seventh consecutive weekly decline, which significantly disrupted the recent bullish structure. Current market sentiment is clearly skewed toward bearishness. After last night's sharp decline, a technical correction may occur today, but the horizontal high at 3,347 has become a key resistance level. Failure to break through this level will maintain short-term selling pressure. On the downside, focus on the 3,300 support zone—if breached, it may trigger further declines toward the previous low of 3,290.
you are currently struggling with losses,or are unsure which of the numerous trading strategies to follow,You have the option to join our VIP program. I will assist you and provide you with accurate trading signals, enabling you to navigate the financial markets with greater confidence and potentially achieve optimal trading results.
Trading Strategy:
sell@3335-3340
TP:3300-3295
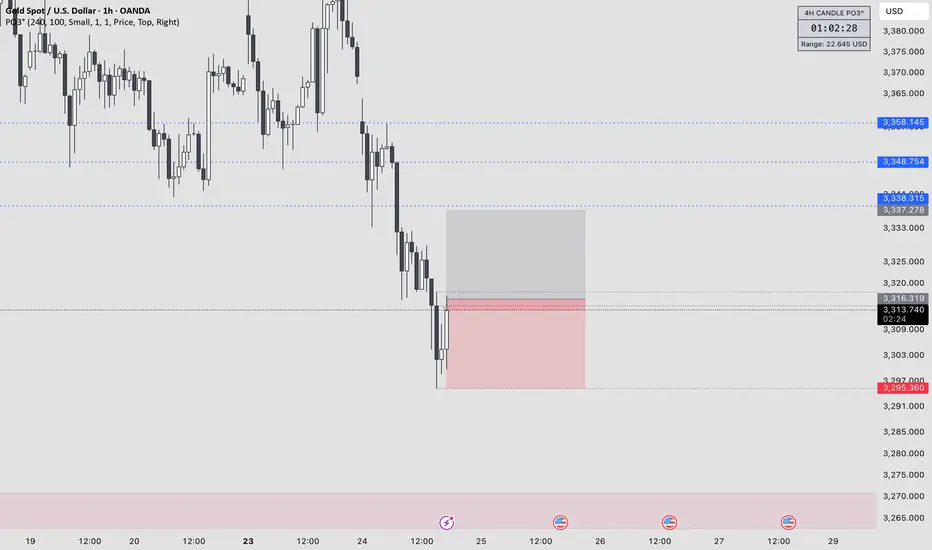
Gold Spot / U.S. Dollar (XAU/USD) 4-Hour Chart Analysis4-hour chart from OANDA shows the recent performance of Gold Spot priced in U.S. Dollars (XAU/USD), with the current price at $3,313.650, reflecting a decrease of $9.800 (-0.29%). The chart highlights a recent upward trend followed by a pullback, with a support zone around $3,301.186 to $3,313.650 and a resistance level near $3,380.030. The inset provides a zoomed-in view of the price action, indicating potential volatility with a lightning bolt symbol and U.S. flags, suggesting significant market movements or news

The downward trend is strong.The easing of the situation in the Middle East weakens the demand for safe havens
The direct trigger for the decline in gold prices was the news that Israel and Iran announced a ceasefire. This news quickly cooled the market's risk aversion, and the attractiveness of gold as a traditional safe-haven asset weakened. In the past few weeks, the military confrontation between Israel and Iran once pushed up the safe-haven buying of gold, but with the conclusion of the ceasefire agreement, the market quickly turned to risk preference mode, global stock markets rose, and the US dollar fell. This change in market sentiment directly led to the decline in gold prices.
This decline will still intensify, pay attention to your trading orders, I will continue to update this article, I wish you a smooth trading.

GOLD Made H&S Reversal Pattern , Chance To Sell To Get 200 PipsHere is My 15 Mins Chart On Gold and we have a very good reversal Pattern , Head & Shoulders , we have a 15 mins closure below neckline 3322.00 we can enter a sell trade and targeting at least 100 pips as scalping , we can enter after waiting the price to retest neckline and then enter . and the price can reach 3300.00 to 3296.00 again .

GOLD/XAUUSD SellGold price is still bearish in the short term. The US dollar is currently being boosted. There are also geopolitical talks and indirect ceasefires. Therefore, the short-term risk aversion sentiment has declined. The gold price is now quoted at: 3323. We can focus on the lower target of 3300-3290.

GOLD Made Double Top Reversal Pattern , Ready For Sell ?Here is My 15 Mins Chart On Gold and we have a very good reversal Pattern , double Top , if we have a 15 mins closure below neckline 3326.00 we can enter a sell trade and targeting at least 100 pips as scalping , we can enter direct if you are aggressive trader or if you not you can wait the price to retest neckline and then enter .

Gold Trading Strategy June 25The Daily Candle shows a strong selling force breaking out of the 3-day accumulation zone. Gold touches the support zone of 3296 and bounces back as analyzed yesterday. Today, it is difficult for the bullish force to return, there is a possibility of an increase in the Asian session and the European session, and the US session will return with the Selling force.
The recovery from 3296 towards 3342, some selling force may appear around 3342, forming a strong bearish structure. The bearish wave structure will weaken if it breaks 3342. The 3363 area still has a reaction but the bearish wave structure is no longer strong.
The market closed above 3363 confirming the downtrend break and heading towards the resistance zone of 3388. The bottom support of 3302 will help to temporarily stop the price decline before heading towards the target of 3278.
Support: 3321-3302-3278
Resistance: 3342-3363-3388
Break out: 3342-3322
Recommended trading signal
BUY GOLD 3302-3300 SL 3297
SELL GOLD 3363-3365 SL 3369

Gold Price Analysis June 25The Daily Candle shows a strong selling force breaking out of the 3-day accumulation zone. Gold hits the support zone of 3296 and bounces towards the resistance zone of 3342. Today, there is unlikely to be a rebound, there is a possibility of an increase in the Asian session and the European session, and the US session will return to the Selling force.
The recovery from 3296 towards 3342, some selling force may appear around 3342, forming a strong bearish structure. The Bearish Wave Structure will weaken if it breaks 3342. The 3363 area is still noteworthy for SELL signals.
The market closed above 3363, confirming the break of the downtrend and heading towards the resistance zone of 3388. The bottom support of 3302 will help prevent a temporary decline before heading towards the target of 3278.

XAU/USD Bullish Reversal from Key SupportXAU/USD Bullish Reversal from Key Support 📈🟢
📊 Chart Analysis:
Rounded Bottom Structure ⬆️
The price has formed a rounded bottom pattern, indicating potential trend reversal from bearish to bullish.
Multiple bounces (🟠 circles) from the curved support trendline confirm the validity of this structure.
Support Zone Rejection ✅
Price recently rejected from a major horizontal support zone (around 3,303.796 USD) with a strong bullish wick.
This zone has acted as a springboard for prior upward moves.
Falling Wedge Breakout 💥
A falling wedge (bullish pattern) has formed and is breaking to the upside.
Breakout confirmation is underway, indicating momentum shift.
Target Projection 🎯
The projected move from the breakout suggests a potential target at 3,385.820 USD.
This aligns with previous resistance areas.
Key Levels to Watch:
Resistance: 3,385.820 USD (target) and 3,425–3,450 USD (major resistance zone)
Support: 3,303.796 USD (short-term), followed by 3,225–3,250 USD zone
🔔 Conclusion:
Price action suggests a bullish bias with a possible upward continuation if it sustains above the wedge breakout.
Confirmation above 3,330 USD with volume can fuel a rally toward the 3,385–3,400 USD target zone.
📌 Risk Management Tip: Watch for fakeouts near wedge resistance or a re-test of 3,303 USD for better entries.

XAUUSDHello traders.
I’ve spotted an exceptional sell opportunity on the XAUUSD pair—one of those setups that come around once in a hundred years! The trade offers a Risk-to-Reward ratio of over 1:8, so I thought it would be valuable to share it with you.
Please adjust your risk parameters accordingly before entering the trade.
🔍 Trade Details
✔️ Timeframe: H1
✔️ Risk-to-Reward Ratio: 1:8.70
✔️ Trade Direction: Sell
✔️ Entry Price: 3333.35
✔️ Take Profit: 3317.75
✔️ Stop Loss: 3335.13
🕒 If momentum fades or the price consolidates in a tight range, I will keep this trade open only until 23:00 (UTC+4). After that, I’ll close it manually—whether in profit or loss—depending on how price action evolves.
🔔 Disclaimer: This is not financial advice. I’m simply sharing a trade I’ve taken based on my personal trading system, strictly for educational and illustrative purposes.
📌 Interested in a systematic, data-driven trading approach?
💡 Follow the page and turn on notifications to stay updated on future trade setups and advanced market insights.
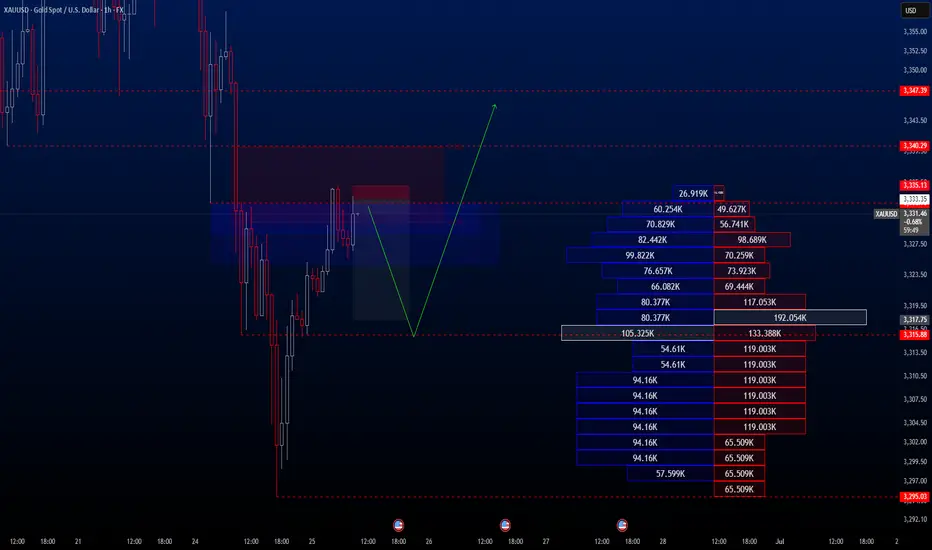
Gold Spot / U.S. Dollar (XAUUSD) 4-Hour Chart - OANDA4-hour candlestick chart from OANDA displays the price movement of Gold Spot (XAUUSD) from late June to early July 2025. The current price is $3,332.245, reflecting a +0.26% increase (+$8.795) as of 07:39 AM CEST on June 25, 2025. The chart highlights a recent price range between $3,320.076 and $3,365.226, with a notable support level around $3,329.934 and resistance near $3,355.226. The chart includes a shaded area indicating a consolidation or trading range.

Gold Forming Triple Top – Correction Ahead?Gold is currently showing a triple top pattern while holding at a key trendline support.
With geopolitical tensions easing, US inflation cooling off, and a potential Fed rate cut on the horizon, gold may be set for a correction.
A drop toward the $2,900/oz zone looks likely — this will be a critical support level. A break below it could trigger a long-term downtrend.

Will gold prices continue to decline?On Tuesday, spot gold once fell below the $3,310 level and finally closed down 1.67% at $3,322.82 per ounce, as the Israel-Iran ceasefire dented safe-haven sentiment and Fed Chair Powell stated that more time is needed before considering interest rate cuts. Spot silver closed down 0.46% at $35.90 per ounce. The benchmark 10-year U.S. Treasury yield closed at 4.2960%, and the 2-year yield at 3.8310%. Powell indicated that current policy is in a favorable position to wait and see before considering rate adjustments, adding that "colleagues privately say I'm doing the right thing". The vast majority of officials believe rate cuts later this year would be appropriate, while noting it's "too early to declare the U.S. dollar is falling".
Technically, gold's daily chart formed a large bearish candle with a lower shadow, breaking below previous support levels amid consolidation. This suggests the bearish trend may persist.
you are currently struggling with losses,or are unsure which of the numerous trading strategies to follow,You have the option to join our VIP program. I will assist you and provide you with accurate trading signals, enabling you to navigate the financial markets with greater confidence and potentially achieve optimal trading results.
Trading Strategy:
sell@3330-3335
TP:3300-3295

The rebound is an opportunity to short goldAfter the ceasefire agreement between Iran and Israel and Powell's hawkish remarks that strongly refuted the possibility of a rate cut, gold fell sharply and hit a low near 3295. Although gold has rebounded, it is particularly difficult during the rebound process, which shows that the bulls are not willing to attack, and the rebound is only a technical repair of the decline.
Since gold fell below 3300 yesterday, the current bull structure has been changed in stages and the confidence of the bulls has been greatly weakened. As gold falls, it will be under pressure in the 3345-3355 area in the short term. Before gold breaks through this area, any rebound may give us an opportunity to short gold; in addition, after gold falls below 3300 once, in order to move downward and test support, gold has the need to retreat again.
So in the next short-term trading, we can try to use the 3345-3355 area as resistance, short gold appropriately, and look to the 3315-3305 area.

Gold Trading Analysis and Strategies for Sideways Decline MarketAfter Trump announced a comprehensive ceasefire agreement between Israel and Iran, market risk aversion significantly cooled, and gold prices plunged by more than $30 in early trading. Although the stability of the ceasefire agreement remains doubtful, the rebound in risk appetite has dominated market trends, with stock markets rebounding, oil prices falling, and demand for safe-haven assets declining.
From a technical perspective, the moving average system on the daily chart of gold shows an intertwined state, indicating a relative balance between bulls and bears. The current key resistance above is near 3350, which is an important psychological threshold. If effectively broken, it may open up upward space; the lower support is focused on the 3285-3290 range, which is the lower edge of the May consolidation platform. A break below this level may intensify correction pressure. The loss of the midline in the 4-hour chart further confirms the short-term weak structure, providing technical support for the downward trend.
XAUUSD
sell@3330-3340
tp:3320-3310
buy@3285-3290
tp:3310-3320
Investment itself is not the source of risk; it is only when investment behavior escapes rational control that risks lie in wait. In the trading process, always bear in mind that restraining impulsiveness is the primary criterion for success. I share trading signals daily, and all signals have been accurate without error for a full month. Regardless of your past profits or losses, with my assistance, you have the hope to achieve a breakthrough in your investment.

$XAU Showing Bearish Flag Pattearn & Dropped $3K Support area...TVC:XAU Showing Bearish Flag Pattearn & Dropped $3K Support area. Price dropping now and back to $3K price level area. price FVG touch and Strong support $3K Price Level area. Here is many support Holder.
Stoploss: $3,536
Entry: $3,377
1st Target point $3,377
2nd Target point $3,249
3rd Target point $3,028
Disclaimer: This article is for informational purposes only and does not constitute financial advice. Always conduct your own research before making any investment decisions. Digital asset prices are subject to high market risk and price volatility. The value of your investment may go down or up, and you may not get back the amount invested. You are solely responsible for your investment decisions and Binance is not available for any losses you may incur. Past performance is not a reliable predictor of future performance. You should only invest in products you are familiar with and where you understand the risks. You should carefully consider your investment experience, financial situation, investment objectives and risk tolerance and consult an independent financial adviser prior to making any investment.

XAUUSD – Selling Pressure Intensifies, the 3,300 USD 1. Overall Technical Context
The XAUUSD daily chart shows that gold is under bearish pressure after failing to break the key confluence resistance at 3,385–3,399 USD, which includes:
- Fibonacci retracement levels 0.5 – 0.618
- A strong supply zone that has been repeatedly rejected
- A minor swing high formed near 3,451 USD
2. Recent Price Behavior
Price has broken below the short-term support at 3,331 USD and is now retesting the Key Lever zone around 3,300 USD, which is a confluence of:
- Previous June swing low
- Fibonacci 0.618 retracement of the latest upward move from 3,221 to 3,451
- A key previous support zone, potentially forming the right shoulder of a head and shoulders structure
If this zone breaks decisively, XAUUSD may continue falling toward the 3,270 – 3,250 USD area, where strong liquidity was previously found.
Key Technical Zones
Resistance:
3,385 – 3,399: Fibo 0.5–0.618 zone and recent swing high
3,435 – 3,451: Major swing high and starting point of the latest correction
Support:
3,300 – 3,320 (Key Lever): Major support currently being tested
3,271 – 3,250: Next support if the current zone fails
Suggested Trading Scenarios
Scenario 1 – Buy on Confirmation at Key Lever
Entry: 3,300 – 3,297 (Key Lever zone)
Stop-loss: Below 3,292
Take-profit: 3,310 – 3,315 – 3,320
Condition: Wait for a clear reversal candlestick pattern or signs of selling absorption on H4/H1
Scenario 2 – Sell if Price Breaks Below Key Lever
Entry: Below 3,290 (after clear break of Key Lever)
Stop-loss: Above 3,298
Take-profit: 3,280 – 3,270
P.S. XAUUSD is currently sitting at a decisive support area around 3,300 USD. The medium-term trend will depend on whether this zone holds. Traders are advised to closely watch price action on the H1–H4 timeframes before executing entries.
Follow for more daily trading strategies and don’t forget to save this analysis if you find it helpful for your trading plan.
Analyst: @Henrybillion
