XAUUSD Analysis todayHello traders, this is a complete multiple timeframe analysis of this pair. We see could find significant trading opportunities as per analysis upon price action confirmation we may take this trade. Smash the like button if you find value in this analysis and drop a comment if you have any questions or let me know which pair to cover in my next analysis.
Xauusdshort

XAUUSD: Mid-Term Swing Sell OpportunityXAUUSD: Mid-Term Swing Sell Opportunity
While Gold's (XAUUSD) larger timeframe remains bullish, the intermediate trend has turned bearish. This shift is clearly signaled by a break below previous lows and the formation of a clean Head and Shoulders reversal pattern.
Currently, price is testing a strong support confluence at a Fair Value Gap (FVG) and a Demand Zone below.
Strategy: Bounce & Sell
Our strategy is to sell into bounces (short on rallies). Key resistance levels to watch for reversal
signals include:
3300: Coincides with the Range Volatile Day High.
3325 - 3350: This is a significant Supply Zone.
We will wait for bearish candlestick patterns and reversal patterns to confirm the move down at these resistance areas.
Downside Targets
Our primary downside targets are:
3150: Aligns with the Range Volatile Week Low.
3100: If this level breaks, we'll then look towards the final support at 3000, potentially forming a Triple Zigzag (WXYXZ) corrective structure.
From a time perspective, we anticipate this bearish phase to last approximately 13 days, in line with Fibonacci Time Cycle analysis.
Crucial Considerations
Effective Money Management is paramount. Ensure your position sizing is appropriate for the expected volatility range. Always be prepared to adapt your view when the price structure clearly invalidates the current bearish setup.
Trade carefully and profitably.
C.Goii Super Trader

5/29 Gold Analysis and Trading SignalsGood morning everyone!
Yesterday, gold rose first and then declined. Our long positions targeting 3318–3326 were completed successfully, and we timely shifted to short positions, resulting in another round of solid profits.
📉 Technical Outlook:
Gold remains in a bearish trend, and is now very close to the 3275 support level. Based on the current price structure, a break below this level is highly probable.
If $3275 is breached, focus on key support at 3258–3238
Resistance levels to watch: 3298–3318
The daily (1D) chart is currently in an indicator correction phase, so today's trading bias is selling from higher levels
🗞 News Focus:
Watch for U.S. initial jobless claims data today. It may offer short-term support for gold, but is unlikely to reverse the broader bearish trend.
📈 Today’s Trade Plan:
📉 Sell in the 3316–3328 zone (resistance zone)
📈 Buy in the 3245–3232 zone (key support area)
🔁 Scalp/flexible trading levels:
3303 / 3288 / 3276 / 3258 / 3247
Stay adaptive and combine news with price action at key levels for best results.
Wishing everyone a successful and profitable trading day!

Gold trading zones: 29-May-2025Good morning! Find today's Gold trading zones and enhance your market analysis.

Gold Technical Analysis - Potential Rising Wedge Signals CautionGold (XAU/USD) is trading around $3,340 - $3,350 area, exhibiting a bullish market structure characterized by higher highs and higher lows. The price has recently tested the resistance zone between $3,330 and $3,350, a level that has previously acted as a ceiling for upward movements. A decisive break above this resistance could pave the way for further gains, with potential targets at $3,371 and beyond. Conversely, failure to sustain above this level may lead to a pullback toward the support zone around $3,300.
The rising wedge on Gold signals caution for bulls. Unless there's a strong breakout above $3,365 , the pattern favors a bearish move toward $3,250 or lower.
✅ Long Bias – Bullish Outlook
Gold is currently trading in an uptrend , supported by:
Higher lows and higher highs structure.
Strong bullish momentum on the rebound from the recent dip around $3,120 .
Fundamentals like economic uncertainty, interest rate cut expectations, or geopolitical tension that often support gold prices.
If price breaks and holds above $3,350–$3,365 , it would confirm bullish continuation, and a long position targeting $3,400–$3,500 is valid.
🔻 Short Setup – Bearish Outlook
Consider a short trade only if:
Price gets rejected from $3,350–$3,365 .
A lower high is confirmed (on H4 or Daily TF).
Bearish candlestick patterns appear at resistance.
Break below $3,300 would open downside targets to $3,250 , and potentially $3,200 .
⚠️ Caution Zone – Potential Pullback
However, there are early signs of exhaustion:
Price is testing a descending trendline + previous weekly high (~$3,330–$3,350) – a key decision point.
If rejection is confirmed, we might see a retest of support near $3,300 or $3,250 .
📊 Current Market Structure
Chart Pattern : Rising Wedge
Timeframe : 4H and Daily
Resistance Trendline : Connecting recent highs around $3,320 → $3,350 → $3,365
Support Trendline : Connecting higher lows around $3,250 → $3,300 → $3,330
Note
Please risk management in trading is a Key so use your money accordingly. If you like the idea then please like and boost. Thank you and Good Luck!

Fed Uncertainty and Rejected Trendline ResistanceOANDA:XAUUSD TVC:GOLD Gold trades around $3,270 after rebounding from the $3,240 support zone, but remains capped below the $3,287–$3,290 resistance zone, which now acts as resistance after the breakdown. Technically, the price is struggling under a descending trendline (TL2), and the $3,287 zone also aligns with previous support turned resistance.
Fundamentally, the rejection of Trump's “Liberation Day” tariffs by the U.S. trade court helped ease risk sentiment, reducing safe-haven demand and pressuring gold. At the same time, market focus shifts to today’s U.S. GDP data and Friday’s Core PCE inflation report—both of which may sway Fed expectations and drive short-term volatility.
If XAU/USD fails to break back above $3,287, a renewed test of the $3,240 breakout zone is likely. Sustained downside may open the path to $3,207 or lower. On the upside, reclaiming $3,290 would weaken the bearish bias and challenge the TL2 trendline.
Resistance : $3,287 , $3,302
Support : $3,240, $3,207

XAUUSD | 30M | SELL NOW Hello, everyone,
My gold target level is 3,250,0
My friends, every single like from you is my biggest motivation to share my analysis.
Thank you very much to everyone who supports me with likes.

Precision Pays Off: Learn, Trade, Win — Results Speak Louder🎯 Analysis On Point Again!
My recent analysis played out exactly as expected. 📉📈 Those who followed my instructions not only gained profits but also improved their trading knowledge and decision-making skills.
Success in trading isn't just about luck — it's about learning to read the market with precision and discipline. 📚💡
To those who’ve been riding along — congratulations on your gains! 🥂 And to the new followers, stay tuned. The next winning setups are just around the corner.
Let’s grow, learn, and earn — together. 🚀💸

XAU/USD Technical Analysis – 15-Minute Chart (May 28, 2025)Chart Summary
Current Price: ~$3,312.50
Short-term Pattern: Bearish rejection forming a potential downward wave
Key Resistance: ~$3,400 (longer time frame resistance)
Supply Zone: ~$3,230–$3,250
Target Zone: Around $3,288 initially, potentially extended to the supply zone
Analysis
Short Time Frame Rejection: Price attempted to rally but faced strong rejection, forming a lower high. This suggests that bearish pressure is building up.
Bearish Setup: A descending move from the rejection zone aligns with a possible ABC corrective pattern or flag breakdown.
Volume Profile: Higher selling volume near the top hints at distribution.
Trade Plan – Sell Setup
Criteria Details
Entry $3,312–$3,315 (current price area)
Stop Loss Above recent high ~$3,325
Target 1 $3,288
Target 2 $3,240 (supply zone low)
Risk/Reward Approx. 1:2+ depending on exit
Trade Management
If price breaks below $3,288 with momentum, trail stop to breakeven.
Watch for a bounce near $3,250–$3,240 supply zone and reduce position size accordingly.
Avoid new sells if price breaks above $3,325 convincingly, as that may invalidate the setup.
put your valuable comments and support the setup thanks.

5/28 Gold Analysis and Trading SignalsGood morning everyone!
Yesterday, gold saw a sharp downward move, and we profited well by trading short based on the double-top pattern.
Yesterday, gold has reached the 3287 support area, and by the end of the U.S. session it rebounded slightly above 3300. Although the rebound lacks strong momentum, it does show that the support zone held on the first test. Whether the bulls can take back control depends heavily on today's follow-up strength.
📊 Key Technical Levels:
If bulls break above and hold 3323–3336, a bullish reversal is likely;
If the bounce is weak, short positions remain the preferred strategy;
4H support: 3268
Daily support: 3172
Before that, 3301–3275 also forms an important support zone;
If price breaks below 3301–3275, especially under negative news impact, a drop to 3150 or even 3100 is not out of the question.
🗞 Key News Focus Today:
Watch for May FOMC-related remarks during the U.S. session, which could become a catalyst for major market movement.
📈 Today’s Trading Plan:
📉 Sell in the 3342–3362 zone (strong resistance)
📈 Buy in the 3258–3248 zone (strong support)
🔁 Flexible intraday levels to monitor:
3336 / 3328 / 3319 / 3306 / 3295 / 3286 / 3274 / 3266
Stay sharp and combine technicals with key news events to make informed trades. Feel free to reach out if you need support — wishing you a profitable day ahead!

Key data will be released, gold will usher in a turning point🗞News side:
1. Musk issued the "strongest" condemnation of Trump
2. Trump and Netanyahu failed to reach an agreement, and the US-Iran negotiations may be "disrupted" by Israel
📈Technical aspects:
Gold prices continued to fall this week as Trump extended the impact of increasing tariffs on the European Union. After stabilizing at 3285 and rebounding yesterday, the gains and losses at 3315 during the day are the key to the subsequent layout. The current Asian session did not stand above 3315 in the morning, which means that the short-term retracement and decline have not ended, and only by breaking through 3315 can there be a chance to continue upward. The 4H level of gold is not so strong at present. The market encountered resistance and fell back at the upper track. Now the market has touched the lower track. The Bollinger Bands have not opened and are still flat, indicating that the market is in a volatile trend in the short term. The support below 3280 just coincides with the lower track. The upper side pays attention to the resistance near the middle track of 3325. If the pressure near the middle track of 3325 is broken, it can be seen to the upper track of 3365. If the market breaks below 3280, it is expected to go to 3260-3250. The European session will temporarily maintain a high-altitude low-multiple cycle. Pay attention to 3315-3325 on the upper side and 3285-3280 on the lower side.
If you agree with this view, or have a better idea, please leave a message in the comment area. I look forward to hearing different voices.
OANDA:XAUUSD FX:XAUUSD TVC:GOLD FXOPEN:XAUUSD FOREXCOM:XAUUSD

Geopolitics Fail to Lift Gold as Dollar Regains MomentumOANDA:XAUUSD TVC:GOLD Gold trades near $3,300, respecting TL1 trendline resistance. A break below the $3,289 level may trigger a deeper pullback toward the key $3,247 support zone. On the flip side, reclaiming $3,315 could open the path toward $3,342 resistance.
On the news front, despite escalating Russia–Ukraine tensions and a record drone strike from Moscow, gold failed to gain. Risk sentiment improved after President Trump postponed the 50% EU tariff deadline, lifting both the U.S. dollar and Treasury yields. U.S. consumer confidence also surprised to the upside at 98.0 in May, dampening safe-haven demand.
Markets now await the Fed’s May Meeting Minutes, which may reinforce the cautious hawkish stance. This poses near-term downside risk to gold if policy flexibility remains limited.
Resistance : $3,315 , $3,342
Support : $3,289 , $3,247

Gold Falls as Expected — Bearish Structure HoldsAfter today’s market open, gold entered the 3346–3358 resistance zone, but failed to maintain upward momentum.
As expected from yesterday’s analysis, the bearish pattern remained intact, and price turned lower.
🔔 Congrats to those who followed the plan — another profitable move locked in!
🔍 Current Market Outlook:
✅ Trend remains bearish, technicals do not currently support a bullish case;
✅ Key support zones:
First support: near 3306
Major zone: 3290–3280
Extended support: around 3260
📌 We’ll continue to focus on short setups as long as the bearish structure holds.
⚠️ Key Reminders:
The market won’t fall in a straight line — watch for temporary rebounds;
During rebounds, pay attention to support/resistance flips;
Be ready to adjust your strategy if the trend shifts!
📍 Important resistance levels:
3346–3338
3324–3318
(This has been highlighted multiple times — don’t ignore it.)
✅ Stick to the plan, adapt to the trend, and manage risk like a pro — that’s the key to consistent profits.

Gold (XAU/USD) Bearish Trendline Breakout – Short Set.Trend Channel: Price had been moving within a clear ascending channel. Recently, price action tested the lower trendline and appears to have broken below it, indicating potential bearish momentum.
Ichimoku Cloud: The price has moved below the Ichimoku cloud, which adds further bearish confirmation. This breakdown of both the trendline and the cloud indicates a possible shift in trend direction.
Volume Spike: A slight increase in volume during the breakout suggests growing interest from sellers.
Entry Signal: The chart marks a zone (circle) where traders should watch for a red candle confirmation. A bearish close below the trendline supports initiating a short position.
Targets:
TP1 (Take Profit 1): Around the 3,240 zone — this is a moderate support area and a conservative profit target.
TP2 (Take Profit 2): Around the 3,160 zone — this aligns with a previous demand zone and represents a deeper corrective move.
Trade Strategy:
Entry: After confirmation with a red candle below the trendline and Ichimoku cloud.
SL (Stop Loss): Ideally placed above the trendline or recent high to protect against a false breakout.
Conclusion:
If the price holds below the ascending channel and the Ichimoku cloud, the setup favors short sellers. Watch closely for bearish candlestick confirmation before entering. TP1 and TP2 offer clear targets based on past support zones.
Would you like a follow-up with live price tracking or updated levels?

GOLD Will Keep Falling!
HI,Traders !
GOLD is going down
Now and the pair broke
The rising support line
Made and is going
Down again now so we are
Bearish biased and we will
Be expecting a further
Bearish move down !
Comment and subscribe to help us grow !

3300 becomes the dividing line between long and short positions🗞News side:
1. The situation in the Middle East and between Russia and Ukraine has escalated again
2. Pay attention to the opening of US stocks today
📈Technical aspects:
Good morning, bros. Gold is currently testing the important support of 3300. Once it falls below 3300, it can be officially confirmed that the correction trend is coming. Today's opening of the U.S. stock market is critical. If the U.S. stock market opens higher, it is very likely to pull down gold prices. The stable operation suggestion for the day is to go long when it retreats to 3295-3290, and then rely on the upper side of the previous low point for protection, that is, look at the vicinity of 3325-3330. If it encounters resistance and pressure near 3330-3340, you can consider entering a short position and continue to be bearish. At present, the first focus below is the support of 3290-3280. If it continues to fall, it may touch the 3266 line.
If you agree with this view, or have a better idea, please leave a message in the comment area. I look forward to hearing different voices.
OANDA:XAUUSD FX:XAUUSD TVC:GOLD FXOPEN:XAUUSD FOREXCOM:XAUUSD
trap ya “liquidity grab” jaisa zone ho sakta hai.Jahan sab buyers wave 5 ko continuation samajh ke buy karein,
Tumhara analysis keh raha hai ki wahan se reversal hoga.
Ye trap ya “liquidity grab” jaisa zone ho sakta hai.
Chart me price ne 5 wave ka bullish pattern complete kiya.
Ab wo Supply Zone me hai jahan se girne ke chances hain.
Tum expect kar rahe ho BOS ke saath downtrend shuru hoga.
Final target lower demand zones tak hai.

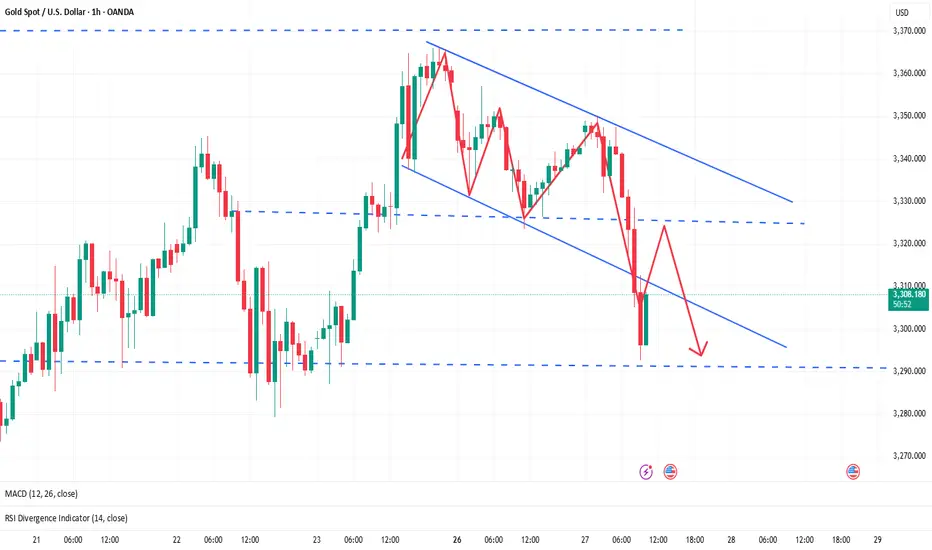
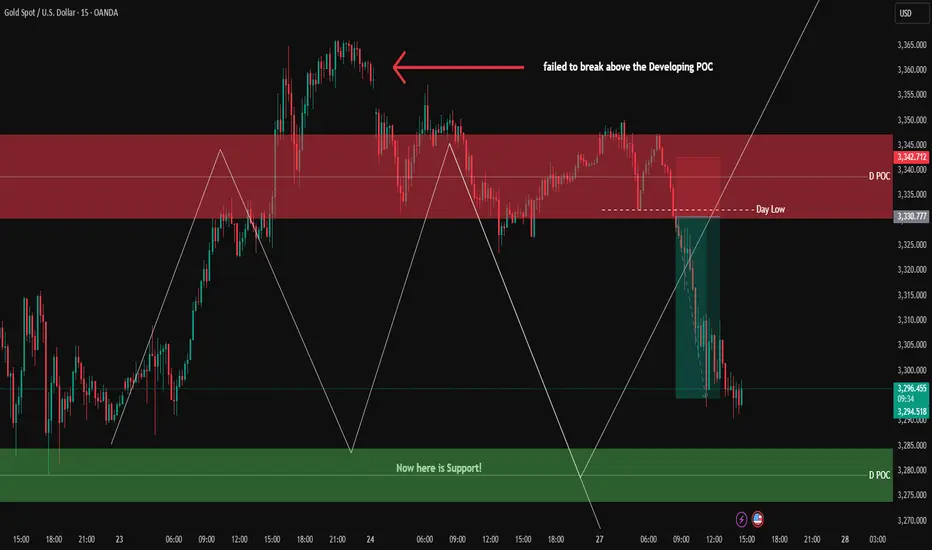
XAUUSD Update – 1H Confirmation/ 15 min Chart/ 3min Sell SetupGold failed to break above the Developing POC resistance and is now pulling back toward the demand zones marked on the chart.
At 3331.8, we entered a short position after the day's low was swept on the 3-minute timeframe, combined with our entry confirmations — resulting in a clean 1:3 R:R ✅
Now we’re waiting for price to reach the demand zones. If we get confirmation on lower timeframes, we’ll be looking to enter a long position.
🔔 The deeper price pulls into the lower demand zones, the better the long setups become, allowing us to consider increasing our risk from 1% to 3%, given a solid setup and momentum.
🔍 Insight by ProfitaminFX
If this outlook aligns with your bias, or if you see it differently, feel free to share your perspective in the comments. Let’s grow together 📈
gold on sell#XAUUSD price have reached the max decline base on past price movement and now we wait for breakout below the low to keep selling.
Below 3292.6 have bearish continuation which will target between 3285 for bullish reverse or a drop below 3281 will keep falling till 3270. SL 3306
The bullish range needs a long candle to confirm.

XAUUSD Analysis todayHello traders, this is a complete multiple timeframe analysis of this pair. We see could find significant trading opportunities as per analysis upon price action confirmation we may take this trade. Smash the like button if you find value in this analysis and drop a comment if you have any questions or let me know which pair to cover in my next analysis.

5/27 Gold Analysis and Trading SignalsGood afternoon everyone!
Yesterday, gold fluctuated within the flexible trading zone, and we only executed a long entry near 3323, which brought decent profit.
Today, gold opened with an upward move toward 3350, but quickly pulled back. The recent market shows a sideways consolidation, with the $3340 level acting as a key pivot zone:
Below 3340: dense support areas
Above 3340: resistance clusters
In this context, any breakout without strong momentum can easily lead to capital flow shifts, causing false breakouts or rapid pullbacks, making trend continuation more difficult.
📉 Technical View:
On the 30M chart, bearish momentum slightly outweighs bullish, and gold is likely to remain range-bound within the zone defined yesterday.
🗞 Fundamental Reminder:
There are a few important U.S. economic releases during the NY session. Watch closely to see if they provide a clear directional push.
📈 Today’s Trading Plan:
📉 Sell in the 3366–3386 zone (resistance area)
📈 Buy in the 3278–3256 zone (support zone)
🔁 Flexible intraday levels to monitor:
3353 / 3341 / 3334 / 3317 / 3309 / 3296 / 3284
Trade with flexibility, beware of fake breakouts, and focus on NY session data-driven opportunities. Let me know if you have questions — good luck and happy trading!

Gold Trading Strategy for the 27thOn the 4-hour chart today, the bullish trend of gold remains intact ⭐️✨📈 ⚠️📉
The current price is facing resistance at 3365 near the previous high. Due to the excessive release of early bullish momentum, a period of adjustment is usually required 📉
However, with further news-driven stimuli this week, gold may still surge sharply 🚀
The key lies in the morning session's trend, so timing is crucial when judging the strength of bulls and bears ⏰
It is expected that gold will continue the pattern of oscillating upward movement, and pullback opportunities can be captured 📈
Resistance is at 3365, and support is at the 3320 level 🔍
Long Position Strategy:
If the gold price retracts to the 3320-3325 range, consider opening a long position 📊 Set the stop-loss at 3317, with targets at 3340-3350 🎯
If the price holds above 3320, try opening a long position 🌟 The initial target is 3345, and if 3345 is successfully broken through, further targets will be 3350-3360 ⚡️
Short Position Strategy:
When the price rises to the 3360-3365 range, try opening a short position ⚠️ Set the stop-loss at 3370, with targets at 3340-3330 📉
Gold Trading Strategies
sell@3360-3365
tp:3330-3340
buy@3320-3325
tp:3350-3360
Professional trading strategies are pushed daily 📊
Lock in precise signals amid market fluctuations 🚀
Confused about market trends? Stuck in strategy bottlenecks?
Real-time strategies serve as your "trading compass" 🌐
From trend analysis to entry/exit points, dissect market logic comprehensively
Refer now 📲
Help you move steadily forward in investments ✨
👇👇👇

Gold Pullback as Expected, Range Trading ContinuesAs I clearly stated last Friday, key resistances are located at 3366 and the stronger zone between 3376–3391. On Friday, the price peaked near 3366 without touching the second resistance band, followed by a pullback — a natural result of recent buying pressure being released and previous trapped positions being closed out.
🎯 Congratulations to those who carefully followed and executed the strategy — you should have captured solid profits from this retracement!
🔍 Current Technical Outlook:
✅ A wave of selling has already been absorbed. Now we watch:
Support strength — if key levels hold, scalping on dips remains valid;
Rebound momentum — short-term indicators favor a bounce, though medium-term structures are still being repaired;
Focus zone: 3355–3357 is a newly created gap resistance, critical for today’s action;
Previously broken supports (3346–3338 and 3324–3318) now serve as resistance and should be watched during any upside attempt.
📈 Trading Strategy:
Today’s price range is relatively contained — stick to selling near resistance, buying near support. If there are any major changes or new developments, I’ll update everyone in time.
