Gold can be shorted near 3365-3370 in the US market
📌 Driving Events
Gold prices fell about 0.48% on Thursday, retreating from a two-week high of $3,345 and falling below the key $3,300 level. Although U.S. Treasury yields retreated from intraday highs, the renewed strength of the U.S. dollar still pushed gold prices down. The pressure on gold intensified after the U.S. House of Representatives passed President Trump's budget proposal, which is now submitted to the Senate for final approval. At the time of writing, XAU/USD was trading at $3,289, down 0.83% on the day. Although the market sentiment has rebounded slightly, it remains fragile after Moody's recently downgraded the U.S. sovereign debt rating. The fiscal package approved by the House of Representatives is expected to increase the national debt ceiling by a staggering $4 trillion, which has exacerbated concerns about long-term fiscal sustainability.
📊Comment Analysis
Gold is now facing strong resistance and buying power is weakening.
💰Strategy Package
🔥Sell Gold Zone: 3365- 3370 SL 3375
TP1: $3350
TP2: $3335
TP3: $3320
⭐️ Note: Labaron hopes that traders can properly manage their funds
- Choose the number of lots that matches your funds
- Profit is 4-7% of the fund account
- Stop loss is 1-3% of the fund account
Xauusdshort

Gold bulls rampage! 3310 holds as "bull's hoof," targeting 3380 Currently, the overall strong bullish pattern for gold continues, with a clear and vigorous upward trend! A robust large bullish candlestick has shot up like an arrow released from a bow 🚀, rapidly pushing prices higher and breaking through all resistance with overwhelming force 💥. The moving average system shows a strong support signal – short-term moving averages can even only "chase" the footsteps of the bullish candlesticks 🏃♂️💨, highlighting how quickly the gold price is rising and how powerful the bulls are! The 3310 level below is akin to a "bullish fortress" 🔒 – short-term K-lines have tested it several times but failed to break through, and the gold price is continuing its upward attack relying on this key pivot point 💪.
On the daily chart, a bullish carnival is unfolding 🔥: Two large bullish candlesticks that have collectively pushed prices up by over 100 USD have emerged, completely engulfing the upper shadows of previous bearish candlesticks. Like a "bullish giant ship" cutting through the waves 🌊, they directly establish dominance! The moving averages have all turned upward, forming a perfect "bullish alignment" 📊, as if building an "upward staircase" for the gold price. Currently, the 3380 resistance level is clearly visible 🚦 – this level is both a previous dense trading area and a potential target endpoint for this bullish trend 🎯.
Gold Trading Strategies
sell@3360-3370
tp:3300-3310
Professional trading strategies are pushed daily 📊
Lock in precise signals amid market fluctuations 🚀
Confused about market trends? Stuck in strategy bottlenecks?
Real-time strategies serve as your "trading compass" 🌐
From trend analysis to entry/exit points, dissect market logic comprehensively
Refer now 📲
Help you move steadily forward in investments ✨
👇👇👇

Trump triggers risk aversion, how to position gold?🗞News side:
1. Trump plans to impose a 50% tariff on the EU
2. Houthi armed forces strike Israel again
3. Pay attention to the impact of the US dollar trend on gold
📈Technical aspects:
Trump is "crazy?" He suggested to impose a 50% tariff on the EU directly from June 1, and threatened to impose a 25% tariff on iPhones not produced locally. This news caused the euro, European stocks, and iPhone stock prices to plummet. At present, the gold price is consolidating between 3350 and 3360. For the US market, it is necessary to prevent a wash, but the short-term increase has been too large. If there is a rapid adjustment, the amplitude will also be large. Therefore, the US market is stuck in the range operation. Pay attention to the support of 3335-3325 below. If it continues to rise, pay attention to the resistance range of 3375-3385.
If you agree with this view, or have a better idea, please leave a message in the comment area. I look forward to hearing different voices.
OANDA:XAUUSD FX:XAUUSD TVC:GOLD FXOPEN:XAUUSD FOREXCOM:XAUUSD

3330 is in stalemate 3335 is the key to long and short positions🗞News side:
1. PMI and initial jobless claims data
2. Geopolitical situation
3. Progress of the G7 meeting
📈Technical aspects:
Currently, the gold price is caught in a fierce battle between bulls and bears at the 3330 level. From a technical point of view, gold is still in the weekly level adjustment and no clear unilateral trend has emerged. Recently, there has been frequent changes in long and short positions, and the rise and fall of prices depends on the impact of news on the market. Even if gold experiences a correction at present, it is likely to be only a small range. Therefore, in the short term, attention should be paid to the resistance line of 3330-3335. If it breaks through, it is expected to look towards yesterday's high of 3345. If it encounters resistance and pressure at 3330-3335, it may retreat to 3310-3300 in the short term for correction. The upper strong pressure is still at 3350-3360, and the lower support of 3300-3290 is still strong. There is no good entry trading opportunity at present, so brothers should wait patiently.
If you agree with this view, or have a better idea, please leave a message in the comment area. I look forward to hearing different voices.
FOREXCOM:XAUUSD FXOPEN:XAUUSD TVC:GOLD FX:XAUUSD OANDA:XAUUSD

gold on sell#XAUUSD is trying to correct back above week high 3345 but unfortunately it's need a breakout above the today high to continue.
Below the 3322 breakout shows a strong fall on which target till 3286, stop loss 3331.
Above the 3335 shows a bullish range which will reach 3344, around 3344 will either decline and head sell or reach the 3367 limit. Below 3312 shows another bearish continuation but multiple breakout will decide.

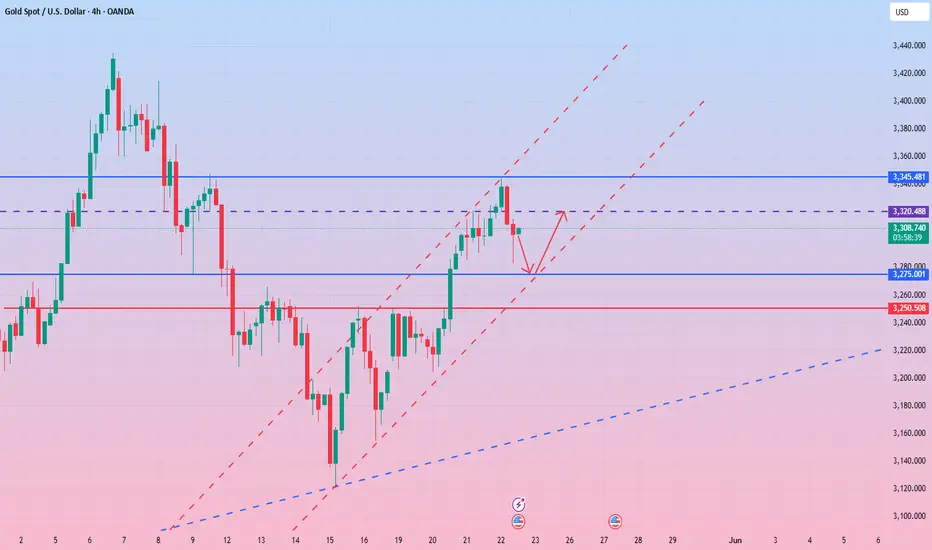
0522:Mastering Divergence in Gold: Daily vs. 4H Chart TacticsHello traders,
Daily chart GOLD looks strong bullish, but not a good position to open buy today.
So even you have the right direction , but in the wrong position ,still could make a losing trade.
Right now In the LD session on Thurs, there is already a bearish signal on 4H chart.
How can you open a long trade based on bearish signal on lower timeframe chart?
You want to follow main trend, but you surely not want to open in the wrong time or position.
Plan A: daily trading plan
Waiting daily candlestick of Thurs to see if the daily pressure line good for new selling plan.
And make your selling plan based on this candle on Friday.
Right, just watch and not doing anything on Thursday.
Plan B, 4H chart trading plan
In the early EURO session, GOLD has made a 4h bearish signal on 4h chart.
Open short position based on 30m chart bearish signal in EUOR-US session.
TP1: 3270
TP2: 3252
GOOD LUCK!
LESS IS MORE!

5/23 Gold Analysis and Trading SignalsGood afternoon everyone!
Gold did not touch our key buy or sell zones yesterday, but flexible intraday range trading worked well, resulting in decent profits.
Currently, the price has reached around 3330, and from a technical standpoint, bulls remain in control. If no negative surprise hits the market, gold could target 3368 today, with a potential to test 3400 resistance next week.
🔔 On the news front, two key events during the U.S. session today deserve attention:
A speech by Fed Governor Lisa Cook on financial stability — may provide hints about the Fed’s stance.
An executive order signed by Donald Trump, which might impact markets depending on its content (e.g., taxes, tariffs, or spending).
Also, note that U.S. markets will be closed next Monday, but this is unlikely to cause major disruptions. Positions held over the weekend can still be adjusted during the Asian session on Monday.
📈 Today’s Trading Recommendations:
📉 Sell near 3382–3398 (Resistance zone)
📈 Buy near 3274–3256 (Support zone)
🔁 Flexible trading levels:
3285 / 3296 / 3307 / 3316 / 3328 / 3337 / 3346 / 3361 / 3373

XAUUSDToday, the follower executed accurate signals in the band trading center and made a profit. The current news is relatively stable. The technical side continues to pursue long orders.
Combined with SMA, there is a support position below 3300-3290. The retracement range is 1%. It is currently in perfect agreement with the expected value.
The current price is 3312. At present, we need to wait for the market to digest some negative factors before looking for opportunities to buy. Below 3310 is a good buying position. Above 3345 is a pressure position that needs to be paid attention to in the short term. If it breaks through, you need to pay attention to whether the position of 3350-3360 can break through stably before considering buying.
Do not trade independently during the trading process. To avoid any losses. If you don’t know how to trade, remember to pay attention to the buying and selling suggestions of the band trading center.

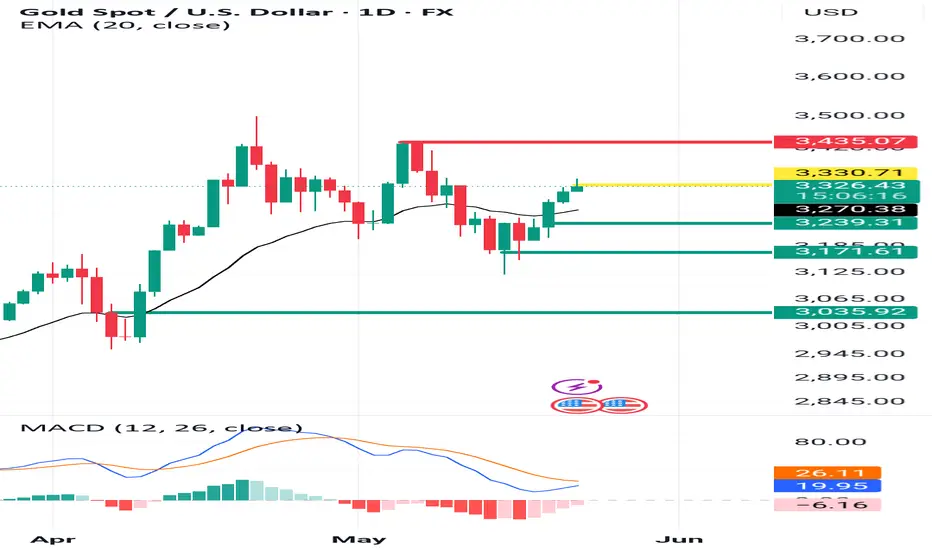
PMI Boosts USD but Caution Lingers Ahead of Fed DecisionOANDA:XAUUSD TVC:GOLD The recent release of stronger-than-expected S&P Global PMIs in the U.S. has offered short-term support to the dollar, pressuring gold from intraday highs. Manufacturing and services PMIs both improved to 52.3 in May, fueling speculation that the U.S. economy may still be resilient despite persistent concerns over Trump's proposed tax reforms and renewed tariffs.
Still, market sentiment remains cautious. While Wall Street recovered slightly, it continues to post weekly losses. Investors are balancing upbeat data with longer-term risks — including a potential economic slowdown triggered by aggressive fiscal tightening and global demand headwinds.
With the FOMC meeting approaching (June 17–18), gold traders are likely to remain reactive to macroeconomic signals. Any dovish shift or mention of a potential rate cut timeline could reignite demand for non-yielding assets like gold. Until then, price action around the $3,289 support and the Quasimodo pattern will be crucial for short-term direction.
Resistance : $3,319 , $3,343
Support : $3,289 , $3,239

The gold trend takes a sharp turn, is a bear market coming?🗞News side:
1. PMI and initial jobless claims data
2. Geopolitical situation
3. Progress of the G7 meeting
📈Technical aspects:
During the Asian session, gold prices approached a two-week high. However, as the market digests the previous positive news and European and American economic data are about to be released intensively, gold's short-term trend faces uncertainty. The key data that everyone needs to pay attention to today include the May PMI data and the number of initial jobless claims in the United States. At the same time, the international trade situation, geopolitical dynamics, the progress of the G7 meeting and the speeches of Federal Reserve officials may have an impact on the market, so it is recommended that everyone keep a close eye on the impact of the news. Judging from the 4H market trend, the US market is paying attention to the short-term support around 3280-3275. Once it stabilizes above 3280, you can arrange to go long. On the contrary, once it falls below 3280-3275, it is possible to fall to the important support area of 3260-3250.
If you agree with this view, or have a better idea, please leave a message in the comment area. I look forward to hearing different voices.
OANDA:XAUUSD FX:XAUUSD TVC:GOLD FXOPEN:XAUUSD FOREXCOM:XAUUSD

“Latest Strategic Positioning and Allocation for Gold Market”
The U.S. Treasury market continues its high-level consolidation, with the 30-year U.S. Treasury yield hitting 5.117% intraday, a new high since October 2023. The 10-year Treasury yield reached 4.613%, approaching the mid-February high of 4.58%, while the 20-year Treasury yield climbed to 5.126%, the highest since November 2023. Spot gold is quoted at $3,306.30 per ounce, down approximately 0.27% on the day, though it recorded three consecutive daily gains at the start of the week, supported by risk-aversion sentiment.
Fluctuations in the U.S. Treasury market reflect changes in fiscal pressures, policy uncertainties, and global capital flows, driving market sentiment. Gold rose initially but fell later today—has the upward move ended prematurely? After a daily large bullish candle, today’s breach of the low suggests the bearish trend may continue. For gold, the resistance level to watch is the U.S. session rebound high near $3,316 per ounce, which will be regarded as a key bull-bear watershed.
In summary, as gold encounters resistance at elevated levels, today’s trading strategy considers shorting on rebounds as the primary approach, complemented by tactical long positions on dips. Key resistance lies at $3,316–$3,340, while support is seen at $3,280–$3,260.
In the market, there are no absolutes, and neither upward nor downward trends are set in stone. Therefore, the ability to judge the balance between market gains and losses is your key to success. Let money become our loyal servant.

Seize the opportunity in the gold marketGold fell after reaching a high point during the day, reaching a high of 3345 before going out of the big drop space, and the evening star appeared in the 4H cycle. Combined with the correction of the top divergence of the indicator, the short-term will enter the adjustment stage. Pay attention to the middle track support around 3280-75 in the future market. If it does not break, you can consider going long. Pay attention to the upper pressure of 3320 and 3335. Keep the idea of shock in operation!
Operation suggestion: Go long on gold around 3280-3275, and look at 3300 and 3320. Go short if the rebound pressure of 3320 is not broken.
Gold surged then fell below 3300! 3255-3265 is now the bull-bear📈Today, riding the wave of its prior rally, gold skyrocketed to a high of around 3345! However, the market had a plot twist 📉—as of now, the precious metal has plunged back below the 3300 mark, bottoming out near 3285. If it breaks beneath 3280, watch out! ⚠️ It might charge towards the lower 3255-3265 range next.
The 3255-3265 zone is like a multi-functional checkpoint 🚦: it's not just the current daily moving average support, but also a crucial historical pivot point. What's even more interesting? During gold's recent upward surge, this very range acted as a tough resistance wall 🛡️, making every breakthrough attempt a nail-biter!
Gold Trading Strategies
sell@3285-3290
tp:3255-3260
buy@3255-3265
tp:3300-3310
Professional trading strategies are pushed daily 📊
Lock in precise signals amid market fluctuations 🚀
Confused about market trends? Stuck in strategy bottlenecks?
Real-time strategies serve as your "trading compass" 🌐
From trend analysis to entry/exit points, dissect market logic comprehensively
Refer now 📲
Help you move steadily forward in investments ✨
👇👇👇

5/22 Gold Trading SignalsGood afternoon everyone!
Yesterday's trading session was a bit bumpy, but in the end, we achieved considerable profits.
Today, gold rose to around 3346 and then began to pull back. It is now approaching the 3300 support level.
🔍 From a technical perspective, the candlestick structure and several indicators suggest that bears may still attempt further downside:
Primary support area: 3288–3276 — if this holds, a rebound is expected, with resistance around 3309–3316.
Secondary support area: 3263–3248 — if it breaks lower, watch for a short-term bounce around 3276-3282.
📰 On the news front, Initial Jobless Claims and PMI data will be released today. These could trigger short-term volatility.
📌 Trading strategy for today includes two key scenarios:
If the data is bearish for the dollar and gold drops to 3253, look for buy opportunities.
If the data is bullish and gold rises to 3358, it's a good spot to sell into strength.
📈 Today’s Trading Recommendations:
📉 Sell near 3358–3372 (Resistance zone)
📈 Buy near 3263–3248 (Support zone)
🔁 Flexible intraday levels: 3253 / 3268 / 3277 / 3286 / 3298 / 3309 / 3316 / 3328 / 3348
Wishing everyone a smooth trading day. Feel free to leave a comment if you have any questions—I’ll get back to you as soon as possible.

Intraday volatility,there is still chance to go long on pullback🗞News side:
1. The situation in Israel escalates
2. Initial jobless claims data
📈Technical aspects:
Influenced by recent news, gold showed a volatile rebound trend. Gold continued to rise in the early Asian session, r OANDA:XAUUSD eaching a high of around 3345. The 3290-3300 level below has absolute support in the short term. As long as it does not fall below 3290, you can go long at 3290-3300. In the 4H cycle, the Bollinger opening and the moving average diverge upwards. The upward momentum is sufficient, and it is not easy to guess the top. Pay attention to the 3310-3300 line of support below, and pay attention to the suppression of the 3340-3350 area above. If the gold price stabilizes at 3350, it is expected to further explore the resistance of 3360-3370. If the European session falls into volatility, maintain the range of high selling and low buying, and consider going long when it retreats to the support level of 3320-3310.
If you agree with this view, or have a better idea, please leave a message in the comment area. I look forward to hearing different voices.
FOREXCOM:XAUUSD FXOPEN:XAUUSD TVC:GOLD FX:XAUUSD

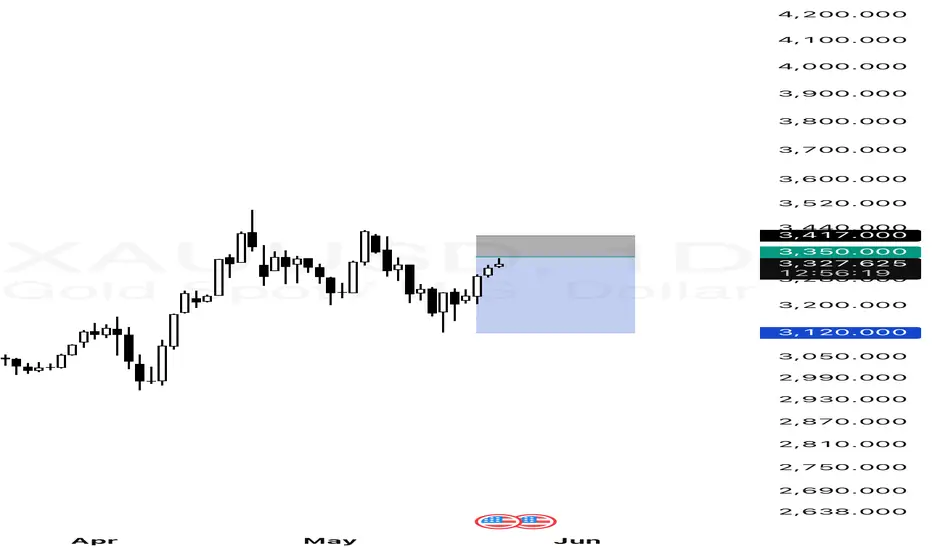
Gold Short Setup: Selling Into Strength at Key Supply ZoneI’m eyeing a high-probability setup on XAUUSD (Gold) based on clean price action and structure on the daily timeframe. After a strong bullish push from the recent lows around 3,120, price has formed a clear bullish engulfing structure, breaking short-term resistance levels.
The market has now entered a key supply zone (highlighted in grey), where previous price action saw sharp rejections. I’ve placed my sell limit just below 3,350, targeting a return toward the 3,120 zone, where strong demand previously stepped in. My stop-loss is placed above the recent swing high, giving this trade a favorable risk-to-reward ratio.
This trade idea is built on the expectation of a short-term correction or rejection from this supply area, aligning with market structure and historical reaction zones. I’ll be monitoring price closely for any signs of weakness like bearish candlestick confirmations within the zone.

Will gold continue to rise as risk aversion heats up?
📌 Gold driving factors
At present, the current market sentiment has turned cautious, driving safe-haven funds into gold. Previously, Moody's downgraded the US sovereign credit rating, and President Trump's promotion of a large-scale tax cut bill is expected to be passed by Congress, further strengthening the theme of "selling the United States" and exerting continuous pressure on the US dollar.
In addition, the resurgence of disputes between the United States and China on the chip issue, and the news that the Group of Seven is considering imposing tariffs on cheap Chinese products, have exacerbated the uncertainty of the global economic outlook, further suppressing the US dollar, while supporting gold, a traditional safe-haven asset, to an eight-day high. Gold prices also benefited from the heating up of geopolitical tensions. CNN reported that several US officials revealed that Israel is preparing to launch a strike on Iran's nuclear facilities.
📊Commentary Analysis
The current market is still running in a range of shocks. Therefore, the US market is still trading repeatedly around the range for the time being. For the time being, the small range will temporarily look at the 3320-3285 line!
💰Strategy Package
Gold: Short when it retreats to around 3325-3320, stop loss at 3330, target around 3290! For long orders, look at the support situation and then enter the market at the right time!
⭐️ Note: Labaron hopes that traders can properly manage their funds
- Choose the number of lots that matches your funds
- Profit is 4-7% of the fund account
- Stop loss is 1-3% of the fund account

5/21 Gold Trading SignalsGood afternoon, everyone!
In yesterday’s trading, our buy-side positions performed well, but unfortunately, sell orders around 3280 weren't closed in time, resulting in a partial loss of profit.
Today, gold has shown impressive strength, breaking above the 3300 level and forming an irregular inverse head-and-shoulders pattern. Technically, this implies further upside potential.
🔍 Based on price action and technical patterns, this rally could extend beyond 3330, and even test 3350+. However, the 3346–3369 zone marks a strong resistance band, making it an ideal zone for medium-term selling opportunities.
📉 On the downside, we identify the first major support at 3278, followed by the 3261–3246 zone.
📰 On the news front, several Fed officials expressed economic concerns in speeches early this morning. Meanwhile, reports of Israel preparing to strike Iran’s nuclear facilities fueled safe-haven demand, pushing gold strongly back above the 3300 mark.
📌 Today's Trading Strategy:
Sell between 3346–3373 (consider scaling in)
Buy between 3260–3243
Flexible trading in the zones: 3338 - 3326 - 3318 -3309 -3298 - 3288 - 3272
Lastly, a heartfelt thought:
Living in a peaceful country like China, it's truly heartbreaking to see so many innocent children suffering or even losing their lives due to war. Let us hope for peace soon—so all people may live safely, freely, and happily.

May 19. Trading opportunities in the London market.A new week of trading opportunities is about to begin.
There is a lot of news over the weekend. There is an increase in geopolitical uncertainty. This is undoubtedly a heavy news. At the same time, the instability of tariffs makes the trend of XAUUSD even stronger.
The current price around 3230 needs to be tested to see if it stabilizes. If not, choose a lower position to buy. If the current price can stabilize, buy directly.
Target 3245-3250
Share at least 4-5 accurate trading signals for trading every day.
More operating opportunities. Lower risk. Greater profit.
If you don’t know how to trade. Follow me.

Gold is on bull or bear, let's see how it goes? {21/05/2025}Educational Analysis says that XAUUSD may give countertrend opportunities from this range, according to my technical analysis.
Broker - Pepperstone
So, my analysis is based on a top-down approach from weekly to trend range to internal trend range.
So my analysis comprises of two structures: 1) Break of structure on weekly range and 2) Trading Range to fill the remaining fair value gap
Let's see what this pair brings to the table for us in the future.
Please check the comment section to see how this turned out.
DISCLAIMER:-
This is not an entry signal. THIS IS FOR EDUCATIONAL PURPOSES ONLY.
I HAVE NO CONCERNS WITH YOUR PROFIT OR LOSS,
Happy Trading, Fx Dollars.

Gold Gains on US Credit Downgrade, Tax RiskTVC:GOLD OANDA:XAUUSD Gold (XAU/USD) surged to a one-week high of $3,306 on Tuesday, fueled by rising concerns over the U.S. economic outlook. The metal benefited from a weaker dollar, following Moody’s downgrade of the U.S. credit rating and renewed fears over President Trump’s proposed tax cuts, which could add $3–5 trillion to the national debt. Global risk sentiment also took a hit, with ongoing U.S.-Japan trade tensions and muted progress in U.S.-China talks.
Technically, gold is approaching key resistance at $3,306. A firm breakout above $3,306 would signal bullish continuation, while short-term support lies at $3,288 and $3,240. The RSI around 60 suggests consolidation may precede another push higher.
With central banks citing U.S. policy uncertainty and geopolitical risks lingering, gold’s safe-haven appeal remains intact.
Resistance : $3,306 , $3,364
Support : $3,288 , $3,240
