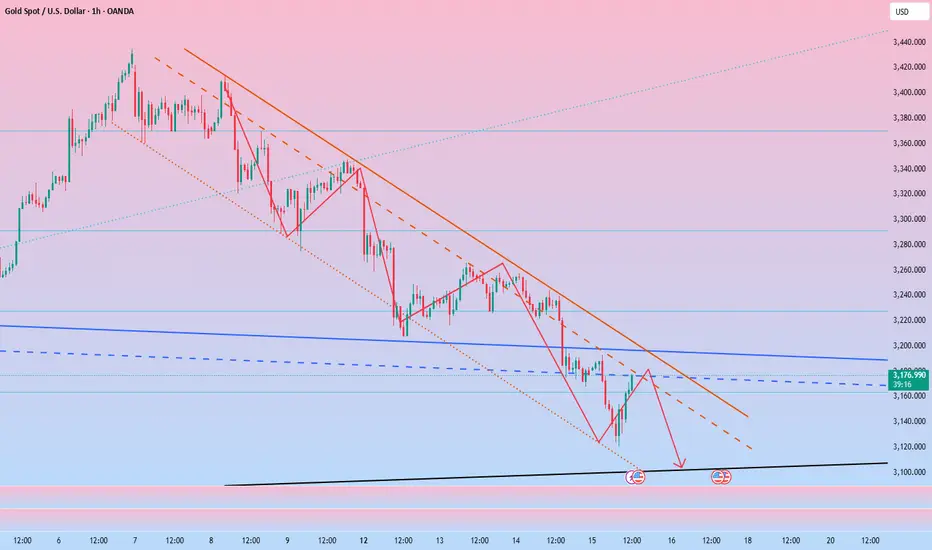
Continue to short gold after the reboundFundamentals:
1. Focus on Powell's speech at the Thomas Laubach Research Conference;
2. Pay attention to the situation of the Russia-Ukraine negotiations;
Technical aspects:
Gold has successively broken through the important support area of 3200 and 3160, and continued to around 3120; the short-term bearish trend is very obvious; although gold has rebounded to around 3170 again in the short term, I think the reason is one of the technical rebound repair after the decline; the second is the result of profit-taking of some short positions. So I fully believe that gold has the need to fall again after the rebound;
At present, we need to focus on the resistance of the 3175-3180 area, followed by the resistance of the 3195-3200 area; if gold cannot break through this resistance area during the rebound, gold is expected to fall again and continue to the area around 3100.
Trading strategy:
Consider the opportunity to short gold after gold rebounds to the 3275-3285 area; TP: 3150
TVC:DXY FOREXCOM:XAUUSD OANDA:XAUUSD CAPITALCOM:GOLD
Xauusdshort
Gold XAUUSD Possible Move 15.05.2025Key Supply Zones to Watch for Short Opportunities:
3170–3175 Zone:
→ Strong supply area.
→ If price rejects this zone with confirmation (e.g., bearish engulfing, M5/M15 BOS or CHoCH), enter sell.
3150–3155 Zone:
→ Mid-level supply.
→ If price fails to reach 3170 and breaks below this level, wait for a break & retest of this zone for potential sell entries.
📉 Trade Signal (Sell Bias):
Scenario 1 – Rejection at 3170–3175:
Sell Entry: On confirmation at 3170–3175
SL: Above 3178
TP1: 3155
TP2: 3145
TP3: 3125 (final target – next demand zone)
Scenario 2 – Break of 3150–3155:
Sell Entry: On retest of 3150–3155 zone after breakdown
SL: Above 3160
TP1: 3135
TP2: 3125
✅ Confirmation Tools:
Candlestick pattern (e.g., bearish engulfing / M15 BOS)
Lower timeframe structure shift (M5-M15 CHoCH)
Volume spike or momentum fade at zone
Kindly follow, comment, like and share.

The technical side collapses! Can the bear market continue?🗞News side:
1. Russia and Ukraine hold ceasefire talks
2. Initial jobless claims data released during today's US trading session
3. Trump administration exposed to trillions of national debt
📈Technical aspects:
After gold fell below 3200, it pointed directly at the 3100-3000 line. Although there has been a rebound in the process, the current short-term short-term situation has not changed. The current lack of rebound momentum in the market is mainly due to the fact that the bad news has not been completely digested. At present, the gold price has rebounded to around 3160. Above, we need to pay attention to the first-line suppression of 3168, which is the first low point in the decline, followed by the 3190-3200 resistance zone above. If the gold rebound cannot break through the 3168 point, then the gold price will most likely continue its decline, test the 3120 low again, or even move towards 3000. If the European market hits the 3168 line and encounters resistance, it can be short-term and focus on the release of initial jobless claims data in the US market.
If you agree with this view, or have a better idea, please leave a message in the comment area. I look forward to hearing different voices.
OANDA:XAUUSD FX:XAUUSD TVC:GOLD FXOPEN:XAUUSD FOREXCOM:XAUUSD

Gold Breaks Lower: Geopolitics Calm, Yields Rise, Bulls RetreatOANDA:XAUUSD Gold weakened beneath $3,150 as easing US-China trade tensions and fading Fed rate cut expectations dented safe-haven demand. US Treasury yields rose, putting further pressure on non-yielding assets. Technically, gold is testing crucial support at $3,123. A break lower can see potential for downward movement to $3,084. Fed Chair Powell speech and PPI data remain key for short-term guidance.
Resistance : $3,171 , $3,229
Support : $3,123 , $3,084

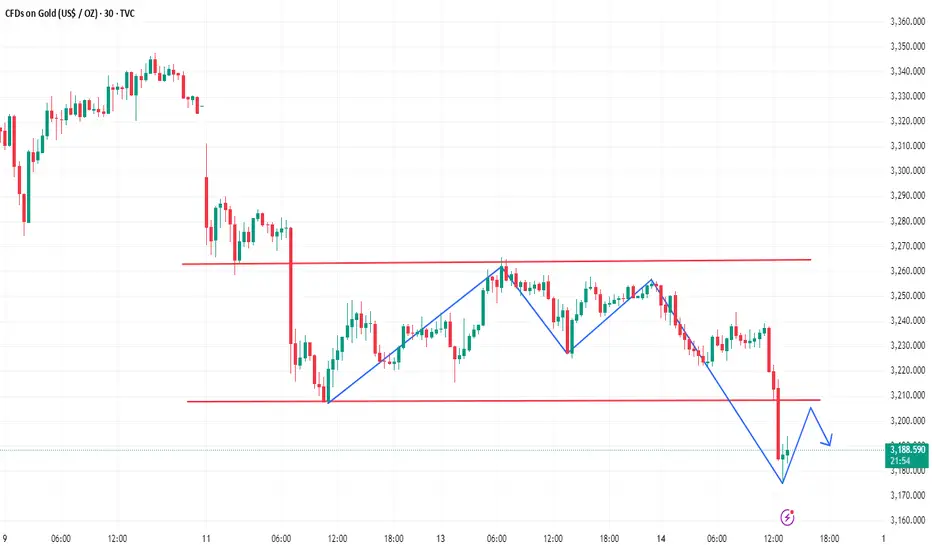
XAUUSD SellThis week's trading cycle is fast. And there are huge fluctuations. The news is still more negative. So the decline is expected. Followers have also gained rich profits.
At present, the entire trading logic is still mainly selling. With the gradual realization of the goal, the space below becomes larger.
After the target of 3160-3130 is reached, XAUUSD has reached the lowest position of 3119. This is a huge drop. The trading opportunities are also greater. At present, 3150-3130 is a support in a dense trading area. In the short term, you can pay attention to the rebound position of 3160-3172DE selling position. The target is 3100-3070.
If it breaks through 3175, then the short-term needs to pay attention to the upper pressure level of 3200-3210. The transaction is still mainly selling.

Gold Holds Key Support Ahead of CPIOANDA:XAUUSD Gold (XAU/USD) edged higher to $3,255 early Tuesday as traders awaited the US April CPI report. While the 90-day US-China tariff truce improved market sentiment and limited gold’s upside, geopolitical tensions in Ukraine, the Middle East, and South Asia continue to drive safe-haven flows. A de-escalation in US-China trade tensions triggered the recent pullback, with price failing to reclaim the $3,271 resistance. The $3,213 area remains a major support. A break above $3,271 is needed to resume bullish momentum, while failure to hold $3,213 could expose $3,127.
Resistance : $3,271 , $3,305
Support : $3,213 , $3,127

Gold slips as trade optimism dents safe-haven demandOANDA:XAUUSD Gold remains stable around $3,237 as easing US-China trade tensions eroded safe-haven demand. The US cut its "de minimis" tariff on small Chinese parcels to 30%, with further progress in talks dampening gold's short-term appeal. Market focus now turns to the upcoming US PPI data for clues on the Fed’s rate path. Technically, gold is hovering just above the key $3,213 support. A break below could trigger further losses toward $3,132. Resistance remains near $3,264 and $3,306.
Resistance : $3,264 , $3,306
Support : $3,213 , $3,132

Gold heads towards 3100 price zone, long or short?
📌 Driving Events
Gold prices (XAU/USD) fell for the second straight session on Thursday, the third decline in the past four days, and fell to a more than one-month low below $3,150 during the Asian trading session. The continued downward pressure is largely due to renewed optimism after signs of a substantial de-escalation in the Sino-US trade dispute, a development that has dampened demand for traditional safe-haven assets such as gold.
The announcement of a 90-day trade truce between the world's two largest economies also helped ease recession fears in the United States, prompting investors to reduce expectations for aggressive monetary easing by the Federal Reserve. The shift supported the continued rise in US Treasury yields, further suppressing demand for the non-interest-bearing gold.
📊Comment Analysis
Downtrend, bears continue to exert downward pressure on the market, heading towards the 3100 price area
⭐️Set Gold Price:
💰Strategy Package
🔥Sell Gold Area: 3178-3188 SL 3191
TP1: $3180
TP2: $3170
TP3: $3160
🔥Buy Gold Area: $3101 - $3099 SL $3094
TP1: $3110
TP2: $3120
TP3: $3130
⭐️ Note: Labaron hopes that traders can properly manage their funds
- Choose a lot size that matches your funds
- Profit is 4-7% of the fund account
- Stop loss is 1-3% of the fund account

XAUUSD target range 3160-3130Continue to short and make a profit. So how to trade next time?
The news is very stable at present. Especially about the news related to geopolitics and tariffs, there are no more conflicts to cause the momentum of XAUUSD to rise. So the feedback on the chart is a decline.
Although there were some small losses in buying. But the subsequent shorting made a good profit. After making up for the losses, there is still some profit.
Next, continue to pay attention to the target range of 3160-3130 below. Investors with larger funds can choose to trade at the current price. 3210-3200 gradually increase the buy order. More detailed information can be obtained in the band trading center.
If you don’t pay attention, you can observe and read it. You can also leave me a message.

Gold short sellers hit the 3,000 mark in a bloodbath?News: The gold market has been experiencing violent fluctuations recently, with a significant correction from historical highs, triggering heated discussions in the market. Its price decline is mainly driven by two major factors: First, global trade tensions have eased. China and the United States have significantly reduced tariffs and suspended some tariffs for 90 days, which has greatly boosted market risk appetite. Investors have evacuated safe-haven assets and the demand for gold has declined. Second, the U.S. dollar index has bottomed out, and U.S. Treasury bond yields have also hit a six-week high. The 10-year Treasury bond yield has exceeded 4.5%. The Fed's adjustment in interest rate cut expectations has made non-interest-bearing assets such as gold less attractive. However, geopolitical risks have not completely dissipated, and the US-EU trade negotiations have progressed slowly, which may re-boost gold's safe-haven demand in the future. In the short term, trade optimism and a stronger US dollar may continue to suppress gold prices; but in the medium and long term, geopolitical uncertainty, inflationary pressures and central bank demand for gold purchases will provide support for gold prices.
From the four-hour level, a double top is formed at the 3500 and 3440 positions above. Gold continued to fall after breaking below 3200. The continued decline has released a clear short signal.The focus below is on the weekly 3100 area support.The ultimate goal of this round of adjustment is to look at the 3030-2980 range

Gold continues to fall seize the opportunity to enter the market
📌 Driving factors
China-US container shipping routes rose sharply - factories rushed to produce overnight, taking advantage of the tariff cooling-off period, those who should stock up are working overtime to complete the tasks. This is the situation seen on the first day after the tariff reduction, indicating the complementarity between China-US trade.
The long-awaited US-Japan and European and American tariffs have not yet ushered in substantial benefits, but Europe said that this is an unfair negotiation and has not been concluded yet.
Trump went to the Middle East and signed a 100 billion weapons order, stabilizing the Middle East before Europe.
📊Comment analysis
The Asian session fell in the morning, pay attention to a few points:
1. The upper watershed opened at 3193 in the morning, the short watershed.
2. Directly break the 3168 long watershed, the next support is at 3145, 3130.
3. For now, the Asian session will continue to fall in a cycle, the European session will pull back after breaking the bottom, and the US session will continue to retreat.
💰Strategy Package
For short-term operations, short selling can be done near 3166, stop loss 3169, target 3140, 3135.
Labaron believes
Guaranteeing the principal is the bottom line for survival, controlling risks is the armor for survival, earning profits is a stage medal, and long-term stable and continuous profits are the only proof of being able to stand up from the sea of blood and corpses.

Short selling on the rebound is determined to winAfter gold fell below 3202 in the US market, it rebounded to 3198 at its highest. This rebound was just an oversold rebound, and then continued to fall back. Although it has not refreshed the low point for the time being, the pattern has weakened and it is difficult to rise again in the evening. Weak shorts can hardly get past 3198. The short-term support below is 3150-3140. Gold continues to cross downward shorts in 1 hour. The short strength is still there. The rebound continues to give shorts opportunities. There is no obvious sustained upward momentum in the short term. Then such a market is just a rebound. Gold rebounds in the US market and continues to be short. On the whole, the short-term operation strategy for gold today is recommended to be short on rebounds and long on pullbacks. The short-term focus on the resistance line of 3202-3205 is on the upper side.
Gold operation strategy reference:
Strategy 1: Short gold near 3195-3205, target near 3180-3170.
Strategy 2: Long gold near 3160-3150, target near 3170-3190.

Gold has broken below the key level of 3200Before the U.S. trading session on Wednesday, spot gold saw a sharp short-term decline, plummeting by $50 in just 3 hours and breaking below the $3,200 mark.👉👉👉
Recently, the global financial markets have shown significant fluctuations due to tariff - related news. Over the weekend, China and the United States reached an agreement in Geneva to suspend the imposition of tariffs for 90 days. This news has effectively alleviated market concerns about a global economic recession, and global stock markets have risen in response, with risk - appetite sentiment heating up.
For short-term gold trading ideas, it's recommended to focus on shorting on rebounds and supplement with longing on pullbacks. Key short-term resistance to watch above is the 3200-3205 level, while key short-term support to focus on below is the 3150-3155 level.
XAUUSD trading strategy
sell @ 3200-3195
sl 3220
tp 3170-3175
If you think the analysis helpful, you can give a thumbs-up to show your support. If you have different opinions, you can leave your thoughts in the comments. Thank you for reading!👉👉👉

Rebounds are opportunities to short goldAt present, gold has tried to fall below the 3200 mark and completely broke the recent low support, laying the foundation for the downward structure. As the center of gravity of gold shifts downward, the upper resistance also moves down to the 3210-3220 area. The relatively clear support below in the short term is in the 3165-3160 area, and after breaking this area, it may even continue to the 3105-3100 area.
Trading strategy:
Consider continuing to short gold in the 3210-3220 area, TP: 3180-3170
CAPITALCOM:GOLD OANDA:XAUUSD FOREXCOM:XAUUSD TVC:DXY

Fed Cuts vs Safe-Haven: Gold Short-Term Pressure, Long-Term BullOn Tuesday, the U.S. April CPI was mild😉. Both core and headline inflation were below expectations😮. Markets now bet the Federal Reserve will cut rates by 53 basis points cumulatively in 2025😏, with the first cut possibly in September😉. Lower interest rates are bullish for gold📈, but weakening safe - haven demand and strengthening risk assets have suppressed gains😔. Easing Russia - Ukraine tensions and a $600 billion U.S. - Saudi trade deal have added pressure on gold prices📉.
Technical analysis of gold: The daily chart forms an M - head pattern📉, with 3200 as the key bullish support level🔍. If the price fails to close above this level, further declines may follow😟. A significant technical breakdown has occurred, requiring a shift in trading strategy😕. While gold can rise rapidly, declines can be equally sharp😖. However, the long - term upward trend remains intact, and pullbacks may offer buying opportunities—though specific entry levels need to be monitored with market developments and are hard to predict currently🤔. In the short term, consider shorting near 3200📉. If 3200 is breached, even rebounds could be opportunities to follow the bearish trend😏. On upward retracements, target the Fibonacci resistance level of 3265 for short positions📊
⚡️⚡️⚡️ XAUUSD ⚡️⚡️⚡️
🚀 Sell@3220 - 3200
🚀 TP 3180 - 3160
🚀 Buy@3160 - 3175
🚀 TP 3200 - 3220
Accurate signals are updated every day 📈 If you encounter any problems during trading, these signals can serve as your reliable guide 🧭 Feel free to refer to them! I sincerely hope they'll be of great help to you 🌟 👇

Gold latest strategy analysisGold prices fell on Wednesday as eased global trade tensions alleviated fears of a potential global economic recession, boosting investors' risk appetite and dampening gold's safe-haven appeal. Before the U.S. trading session on Wednesday, spot gold plunged sharply in a short term, plummeting by $50 in just three hours and breaking below the $3,200 mark. After 50 hours of consolidation, gold finally broke below the previous low of 3,200 to continue its downward trend. It can now be confirmed that the wave 3 decline is established. Currently, the gold price has stopped falling and rebounded at the lower track of the downward channel (this channel position can refer to the support level analyzed in yesterday's morning session). After the previous support was broken, it can be used as a reference for short-term resistance, namely the 3,200-3,206 area. As long as the rebound does not hold above this level tonight, the subsequent strategy will be to go short at highs and look for further downside.
you are currently struggling with losses, or are unsure which of the numerous trading strategies to follow, at this moment, you can choose to observe the operations within our channel.

Can we continue to bet against gold?My article today emphasized that gold may fall below 3200. Sure enough, it did so without hesitation today and fell to around 3175 in the short term. At present, gold has rebounded, and the short-term pressure is around 3200, so you can short at this position.
In the short term, focus on the support near 3160 below. If it falls below, there is still room for gold to fall.
XAUUSD/GOLD | 1H | SELL NOW Hello, everyone,
My gold target level is 3,190.0.
My friends, every single like from you is my biggest motivation to share my analysis.
Thank you very much to everyone who supports me with likes.

XAUUSD TRADE LINE, SELLING OPPORTUNITYHere I Created This XAUUSD Chart Analysis
Pair : XAUUSD (Gold)
Timeframe: 30 - Minutes
Pattern: Trade Line Resistance
Momentum: Bearish/ SELL
Entry Level : SELL 3238
Resistance zone : 3238
Target Will Be : 3208
Disclaimer : This signal is based on personal analysis for learning purposes. Trade at your own risk and always use proper risk management.

Focus on 3200 for some support during the day🗞News side:
1. Sino-US tariffs have been eased
2. U.S. trade progress and focus on geopolitical risks
📈Technical aspects:
Yesterday we gave a long trading strategy and have been waiting to see whether the gold price can touch our target point of 3270. However, gold did not fluctuate much after the opening of the Asian market, so I chose to manually close the position near 3256.
To be honest, the market did not fluctuate much today whether it was up or down, and it is still consolidating within our box range of 3220-3265. Although gold is generally weak, it has a higher probability of strengthening during the day, and the early gap may be ready for market recovery. At present, the gold price has tested the 3240 line many times. If it cannot stand above 3240, it may test the strong support of 3200 again. If there is no breakthrough below the strong 3200 support, the market may repeat
If you agree with this view, or have a better idea, please leave a message in the comment area. I look forward to hearing different voices.
FOREXCOM:XAUUSD FXOPEN:XAUUSD TVC:GOLD FX:XAUUSD OANDA:XAUUSD

GOLD on sideways#xauusd have been multiple rejecting both on bearish and bullish, now next breakout will determine the next move on the pair.
Above the rectangle at 3244.5-3252 will push the pair above 3278, stop loss at 3235.
Below 3229 will trigger a full bearish because the M5 is waiting for breakout below drop. Target 3187

XAUUSD Bearish Pennant Breakdown | Retest in Play – 3090 TargetGold (XAUUSD) has been in a corrective phase after reaching the resistance zone around 3370–3420 USD, where the price was previously rejected with strong selling pressure. Over the past sessions, price action has developed into a Bearish Pennant pattern, typically seen as a continuation pattern in a downtrend.
Following a sharp drop from the highs, the price consolidated between converging trendlines, creating lower highs and higher lows. This structure resembles a pennant or triangle formation, which traders often interpret as a pause before the next leg down.
🔍 Key Technical Features:
1. Resistance Zone (3370–3420 USD):
Strong institutional selling observed here.
Multiple rejections confirm this zone as a significant supply area.
This area also serves as a risk management reference point for stop-loss placement.
2. Support Zone (3210–3230 USD):
The price bounced multiple times from this level, making it a key demand area.
A clean break below this zone would confirm bearish continuation.
3. Trendline Resistance:
A descending trendline has been respected consistently since May 8.
Price recently retested this trendline after a minor pullback, aligning with the bearish pennant structure.
4. Bearish Pennant Pattern:
Forms after a strong downward impulse.
The consolidation is narrowing within converging trendlines.
A breakdown with high volume typically leads to a continuation of the prior trend.
5. Breakout & Retest:
Price has already broken below the pennant's lower boundary.
The current move is a retest of the broken trendline—a classic setup for entering a short position upon rejection.
🎯 Bearish Target Projection:
The measured move from the pole of the pennant suggests a target around 3090 USD.
This level is derived by taking the height of the initial drop before the pennant and projecting it downward from the breakout point.
🛑 Stop Loss Strategy:
A conservative stop loss can be placed just above the 3370 USD resistance zone.
Alternatively, a tighter stop could be placed slightly above the trendline (~3240–3250) for aggressive entries, though this increases the risk of a false breakout.
✅ Trading Plan Summary:
Aspect Level / Detail
Entry Zone After retest & rejection (near 3230–3240 USD)
Target 3090 USD
Stop Loss Above 3370 USD
Risk-Reward Approx. 1:3 or higher
Pattern Type Bearish Pennant
🧠 Final Thoughts:
This is a textbook bearish continuation setup with strong confluences:
Trendline resistance
Bearish pennant formation
Breakdown with retest
Clear resistance and support zones for managing risk
If momentum sustains to the downside after the retest, we could see a swift drop toward 3090 USD, offering a favorable shorting opportunity for swing and intraday traders alike.
Always confirm with volume and candlestick confirmation before execution. Stay updated with fundamental drivers such as CPI, PPI, or FOMC comments, which can inject volatility.

Gold Strong Crash, Final Warning —Moving Below $2,000XAUUSD (Gold) will move below $3,000 with very strong bearish momentum. You cannot say that you were not warned. It will continue lower to hit a target around $2,750 after $3,000 fails as support.
After the $2,750 target hits, I will look again at the chart and see what it has to say. Below $3,000 is ultra high probability, guaranteed basically. $2,750 is also very high probability that it will hit.
Will it continue lower? At this point it is hard to tell because I don't know Gold's long-term dynamics in a correction, but it isn't looking pretty. If current geopolitical conditions is what's making Gold bearish, then XAUUSD is set for a long-term bear market because everything will continue in the same vein.
That is only if that's the reason why Gold is bearish.
» Looking at the monthly chart, it is a disaster. Gold is set to move below $2,000 in the coming months.
Do you agree?
Disagree?
Leave a comment.
Thank you for reading.
(Remember to follow, and boost...)
Namaste.
