Gold has a pressure level of 3397 and a support level of 3368Gold hit a new high, with the high point near 3397. From the gold hourly chart, 3397 is still an obvious pressure, and the support below is around 3368
We can go short around 3397, and then go long when it falls back to 3368
Xauusdshort

Gold is expected to fall in the short term
Gold rebounded to around 3380, and the K-line decline was inevitable, so there is no doubt that the gold price will fall. The current K-line closed with an upper shadow, which is a sign that the bulls have reached their peak.
Trading ideas: short gold near 3380, stop loss 3390, target 3350

GOLD Price Analysis: Key Insights for Next Week Trading DecisionGold ended last week under pressure as investors booked profits following improved risk appetite, driven by easing trade tensions and a strong U.S. labor market report.
📰 NFP came in at +177K in April, with the unemployment rate steady at 4.2%, matching forecasts—possibly keeping the Fed cautious on policy easing.
Technically, Gold remains bullish but is now testing the $3,200 support zone, and sellers are gaining momentum.
As we head into next week, gold price action is at a critical decision point, and whether buyers or sellers will take control is unclear.
In this video, I break down the key technical zones, share my trading plan, and discuss potential opportunities to help navigate the uncertainty ahead.
Disclaimer:
This is my take based on experience and what I see on the charts. It’s not financial advice—always do your research and consult a licensed advisor before trading.
#GoldAnalysis #XAUUSD #GoldPrice #ForexTrading #TechnicalAnalysis #FundamentalAnalysis #GoldOutlook #FedRateDecision #NFP #GoldBreakdown #GoldBulls #GoldBears #USJobsReport #ForexMentor

XAUUSD Price Action: Bullish Break + Liquidity Sweep Trade Idea🪙✨ Gold (XAUUSD) Technical Outlook ✨📈
I’m currently analyzing XAUUSD on both the daily and 4H timeframes, and here’s what I’m seeing:
🚀 Price has broken bullish structure and is now looking overextended, pushing into a buy-side liquidity zone—clearly visible to the left of current price action. 💰📊
It’s clearing buy stops, which could trigger a retracement soon. 🧲🔁
🎯 I’m watching closely for a pullback into the 50%–61.8% Fibonacci retracement zone on the current price swing—that’s my key point of interest for a potential long setup, provided we see a healthy pullback followed by another bullish break of structure. 🔍🔐
🧠 Not financial advice—just my personal analysis. Always manage risk. ⚠️📉

XAUUSD trading opportunities.6/5/2025The increase in uncertainty also caused the XAUUSD trend to continue to strengthen. The target position of 3330-3350 set yesterday is the short-term pressure position. In the Asian market, XAUUSD/GOLD hit the recent high again. After reaching 3387, it fell back. The current price is 3350. According to the momentum chart, the market is in a stage of bullish growth. Risk aversion has increased, which has led to more buying than selling.
In terms of trading, traders with large amounts of funds can buy at the current price, and those with small amounts of funds can wait until the market retreats below 3330 before choosing to join again.
The Swing Trading Center continues to update new real-time trading opportunities. If you don't know how to trade, or don't want to miss the next real-time trading opportunity, remember to follow me.

XAUUSD 3265: Bull-Bear Lifeline! Next Week's Trend PredictionFrom a daily chart perspective, overnight, the price of gold rebounded after hitting the bottom and closed with a bullish candlestick 🌞. However, on the 1-hour chart, the moving averages of gold have formed a bearish crossover pattern and are arranged in a downward trend for bears 📉. Moreover, this pattern will eventually continue to diverge downward. Currently, the price of gold has been suppressed and pulled back near the level of 3265 ⚠️. It can be seen from this that the area around 3265 will still be a crucial turning point determining the bull-bear trend of the gold price next week ⚡. Join 👉
In the latter part of the night, although the price of gold rebounded to some extent, compared with the previous decline range, the rebound strength is indeed limited 📉↗️. Looking ahead to next week, if the gold price fails to break through the resistance near 3265, then the market will most likely only maintain a volatile pattern at best, and it is less likely for the bulls in the gold market to achieve a direct reversal in the short term 📊. Investors should focus on the resistance at 3265 above and the strong support at the key level of 3195 below 🔍.
Join 👉
Accurate signals are updated every day 📈 If you encounter any problems during trading, these signals can serve as your reliable guide 🧭 Feel free to refer to them! I sincerely hope they'll be of great help to you 🌟 👇

Can we get a leg lower on XAUUSD?Hi fellow traders, XAUUSD will be ready to make a move lower from the golden pocket within the blue box after completing the correction. Target the 3195.03 level. Good luck and trade safe!

Swing Trading/XAUUSDband trading strategy points out. XAUUSD can be bought on the left side, TP3330-3350.
Aggressive traders can buy at the current price. Conservative traders can wait until the price retreats to around 3300 or below before buying.
The Swing Trading Strategy Center continues to announce trading opportunities. Stay tuned.

Gold Price Analysis May 5The D candle cluster appears with the sellers still dominating. 3270 is still playing a key role in reversing the trend.
The h1 structure is creating a false break in the 70 zone and wants to continue falling in the corrective downtrend. Pay attention to the 3263 break zone in the European session, when breaking this zone, Gold will form an uptrend and the possibility of breaking the 3270 zone is very high. 3285 will be the next reaction zone when breaking 3270, then the Down wave of Gold will be broken. Gold can reach 3303 when there are retests to the support zones.
In the opposite direction, Gold does not break 3262 and continues to fall, it will be favorable for the downtrend and the possibility of forming a double top pattern and falling sharply is also quite high. The Trendline zone 3243 is considered an important support zone in the near future for the Gold price decline. Next, pay attention to the reaction zone of the daily support around 3225.

GOLD Weekly OUTLOOK HAPPY MONDAY
XAUUSD GOLD DROPPING FROM 3335 TO 3367
Helping us make substantial positive gains.
Gold will first reach 3338 or 3365 and then drop below.Then it will go to my target which I have mentioned in the target up chart 3260If you like my chat, please support and like it.My charts always come out right. I hope this chart of mine comes out right too.
GOOD LUCK AND TRADE SAFELY!
THANKS FOR YOUR UNWAVERING SUPPORT!
LIKE OUR IDEAS
COMMENT ON OUR IDEAS
SHARE OUR IDEAS
TEAM ISABELLA01

GOLD Potential ReversalIt appears that we've reached a significant top in the market, with price action showing signs of a potential dump. Liquidity has been taken out at this level, and we are now looking at lower price targets, which align with the lines below, marking new liquidity points. These areas could serve as key support levels as the market tests them for further reaction.
The price structure suggests a possible drop to the target zones around 3,300 / 3,200 & 2970 where we could see renewed buying interest. Stay cautious as we approach these levels, as they may present opportunities for short entries ahead of the market correction.
Keep an eye on the evolving price action for further confirmations.

It’s the right time to short📌Fundamentals:
This week, the Federal Reserve will hold a rate decision, which is expected to dominate the market this week. In addition, we need to continue to pay attention to news related to the international trade situation.
📊Technical aspects:
The 1-hour moving average begins to turn, so the unilateral decline of gold has temporarily come to an end. However, the rise of gold has reached the key resistance area in the early stage, which is the starting point of the early stage of 3330. It is obviously not appropriate to chase more at this position, so the short-term may begin to adjust, and gold will go short at 3325 first. The market is changing rapidly. If gold breaks upward without stepping back, there will be no opportunity to go long. Then there is no need to chase more gold. Go short first and look at the decline and adjustment. On the whole, the short-term operation strategy of gold today is to go short on rebounds and go long on pullbacks. The short-term focus on the upper resistance of 3328-3330, and the support on the lower side is 3280-3293.
🎯Practical strategy:
Short gold when it rebounds to around 3325-3328, target around 3300-3280.
Buy gold when it falls back to 3280-3295, target around 3325-30.

Although the bulls are strong, don't chase them at high levels📌Fundamentals:
The market is still focused on Trump's tariffs, followed by geopolitical situations, such as the India-Pakistan conflict, the Israeli-Palestinian ceasefire, and the Russia-Ukraine negotiations.
📊Technical aspects:
From the 4-hour analysis, the upper pressure is around 3336-3345, and the lower support is around 3280-3293. Continue to rely on this range to maintain the main tone of high-altitude low-multiple cycles. In the middle position, watch more and move less, be cautious in chasing orders, and wait patiently for key points to enter the market.
🎯Practical strategy:
1. Short gold rebounds at 3336-45, with a target of 3280-3295.
2. Go long gold at 3280-3295, with a target of 3325-30.

XAU/USD "The Gold" Metal Market Heist Plan (Day Trade)🌟Hi! Hola! Ola! Bonjour! Hallo! Marhaba!🌟
Dear Money Makers & Robbers, 🤑💰✈️
Based on 🔥Thief Trading style technical and fundamental analysis🔥, here is our master plan to heist the XAU/USD "The Gold" Metal Market. Please adhere to the strategy I've outlined in the chart, which emphasizes short entry. Our aim is the high-risk GREEN MA Zone. Risky level, oversold market, consolidation, trend reversal, trap at the level where traders and bullish robbers are stronger. 🏆💸"Take profit and treat yourself, traders. You deserve it!💪🏆🎉
Entry 📈 : "The heist is on! Wait for the Neutral Level breakout then make your move at (3260.00) - Bearish profits await!"
however I advise to Place sell stop orders above the Moving average (or) after the Support level Place sell limit orders within a 15 (or) 30 minute timeframe most NEAREST (or) SWING low or high level for Pullback entries.
📌I strongly advise you to set an "alert (Alarm)" on your chart so you can see when the breakout entry occurs.
Stop Loss 🛑: "🔊 Yo, listen up! 🗣️ If you're lookin' to get in on a sell stop order, don't even think about settin' that stop loss till after the breakout 🚀. You feel me? Now, if you're smart, you'll place that stop loss where I told you to 📍, but if you're a rebel, you can put it wherever you like 🤪 - just don't say I didn't warn you ⚠️. You're playin' with fire 🔥, and it's your risk, not mine 👊."
📌Thief SL placed at the nearest/swing High or Low level Using the 3H timeframe (3360.00) Day/Scalping trade basis.
📌SL is based on your risk of the trade, lot size and how many multiple orders you have to take.
Target 🎯: 3170.00 (or) Escape Before the Target
💰💵💸XAU/USD "The Gold" Metal Market Heist Plan (Scalping/Day Trade) is currently experiencing a Bearish trend.., driven by several key factors.👇👇👇
⚠️Trading Alert : News Releases and Position Management 📰 🗞️ 🚫🚏
As a reminder, news releases can have a significant impact on market prices and volatility. To minimize potential losses and protect your running positions,
we recommend the following:
Avoid taking new trades during news releases
Use trailing stop-loss orders to protect your running positions and lock in profits
💖Supporting our robbery plan 💥Hit the Boost Button💥 will enable us to effortlessly make and steal money 💰💵. Boost the strength of our robbery team. Every day in this market make money with ease by using the Thief Trading Style.🏆💪🤝❤️🎉🚀
I'll see you soon with another heist plan, so stay tuned 🤑🐱👤🤗🤩

Start shorting gold and seize the opportunity to make a profit!!Fundamentals:
Focus on Trump and the Fed
Technical aspects:
Gold fell back to around 3253 and then rebounded, and continued to rise to around 3318. The upward momentum in the short term looks particularly strong. According to the current structure, as gold gradually rebounds, off-market buying funds gradually enter the market, pushing gold further up. However, when facing the previous turning point position area of 3325-3335, the market is cautious and it is difficult to break through this area in a short period of time. Therefore, when gold gradually approaches the 3325-3335 area, gold may usher in a wave of retracement in the short term; obviously, the retracement area we can foresee is the 3295-3285 area first.
Trading strategy:
Consider shorting gold in the 3315-3325 area, TP: 3295-3285

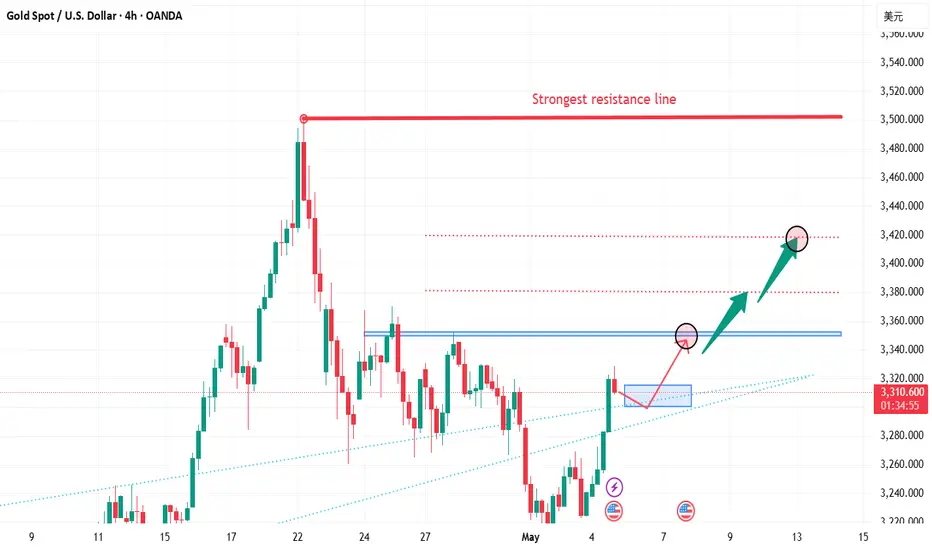
Gold rises as a safe haven, how to plan the market outlook
📌 Gold Drivers
Gold prices rose more than 2% on Monday, benefiting from a weaker dollar and safe-haven inflows as U.S. President Donald Trump's new tariffs reignited concerns about the impact of a global trade war. Spot gold rose by more than 2.3%, US gold futures rose by 2.4%, and the US dollar index fell by 0.4%. On Sunday, Trump wrote on his social platform Truth Social: "I authorize the Department of Commerce and the United States Trade Representative to immediately initiate procedures to impose a 100% tariff on all films produced abroad entering the United States. We want to make movies in the United States again!" But he did not specify how these tariffs will be implemented.
📊Comment analysis
Gold prices continue to accumulate and have broken through 3330 points. It can be found that gold is now completely above the trend line.
💰Strategy package
The only suppression position above is currently around 3350.
The support below is currently at 3275-85.
If gold does not retreat, then the upper side will directly test the suppression near 3350.
On the contrary, if gold chooses to retreat next, then pay attention to 3275-85.
As long as gold retreats and stabilizes in the 3275-85 range, you can directly enter the market to do more.
Continue to look at 3350 above. If it breaks through and stabilizes above 3350 in the future, you will see the 3380-3420 range.
⭐️ Note: Labaron hopes that traders can properly manage their funds
- Choose the number of lots that matches your funds
- Profit is 4-7% of the fund account
- Stop loss is 1-3% of the fund account