Don't chase the bullish trend,wait for the short position layout#XAUUSD
The tariff policy recently announced by the US government is undoubtedly the focus of the current gold market. Trump also tied the tariffs to the trial of former Brazilian President Jair Bolsonaro, adding to policy uncertainty. ⚖️
The implementation of the tariff policy may push up commodity prices, thereby exacerbating inflationary pressure, which is both an opportunity and a challenge for gold📊. On the one hand, rising inflation expectations may enhance the attractiveness of gold as an anti-inflation asset; on the other hand, the strengthening of the US dollar and US Treasury yields may offset this positive. 💡
At present, the lower support has moved up to the 3375-3365 area, where a top-bottom conversion position will be formed. The upper short-term resistance level is 3387-3393, the previous high. If the market touches this for the first time, you can try to see a double top fall.
🚀SELL 3385-3390
🚀TP 3365-3355
Xauusdshort
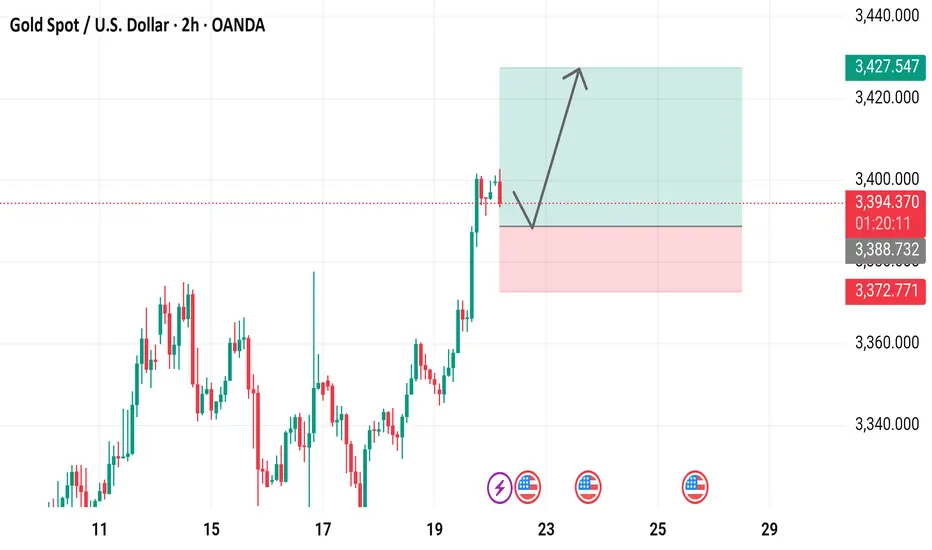
Gold Spot / U.S. Dollar (XAUUSD) 2-Hour Chart - OANDA2-hour candlestick chart displays the price movement of Gold Spot against the U.S. Dollar (XAUUSD) from OANDA, covering the period up to July 22, 2025. The current price is 3,395.285, reflecting a 1.775 (-0.05%) decrease. The chart includes buy/sell indicators (3,395.780 buy, 3,394.890 sell), a highlighted resistance zone around 3,400-3,425, and a support zone around 3,370-3,386. The chart also features technical analysis tools and annotations indicating potential price trends.
gold still strong on buyinggold still taking the bullish stand, possible we expect price to keep buying if the H1 closes above 3405 area, then followed by M30 close below 3395 for selling.
the bullish is still strong depending on how the H1 react

gold on bulish reverse#XAUUSD await multiple breakout above 3389, possible target will reach new Day high 3305.
Entry at 3389 on 2 times breakout, target 3405 stop loss 3381.
Below 3380. on m15 closure will drop the price

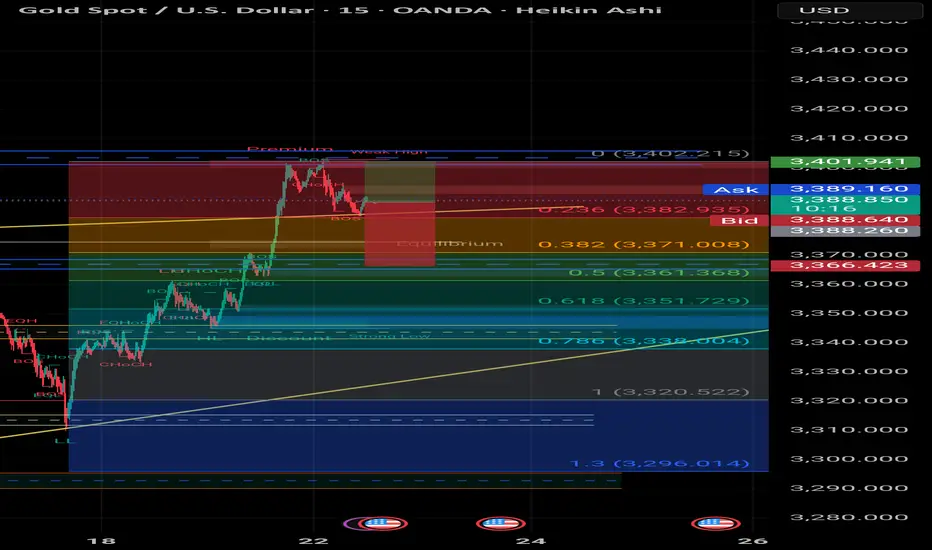
Absolutely! Here's a Scalping Analysis in English markdown forma## 🪙 Gold (XAU/USD) Scalping Plan – July 22, 2025
**Chart: 15-Minute (Heikin Ashi) – OANDA**
---
### 🔍 Market Structure:
- **Current Price**: 3,389.30 USD
- **Recent BOS (Break of Structure)** confirms bullish momentum up to the **3,402 level (Premium Zone)**.
- We’ve seen **CHOCHs** (Change of Character) confirming early exhaustion.
---
### 📐 Fibonacci Zones:
| Level | Price (USD) | Significance |
|--------------|---------------|------------------------|
| 0.236 | 3,382.93 | First minor support |
| 0.382 | 3,371.00 | Equilibrium zone |
| 0.5 | 3,361.36 | Institutional entry |
| 0.618 | 3,351.72 | Deep retracement zone |
| 0.786 | 3,338.80 | High-probability reversal |
| 1.0 | 3,320.52 | Final OB/Support base |
| 1.3 (forecast)| 3,296.01 | Extended target zone |
---
### 🧠 Scalping Setup:
- **Short-term Shorts** from the **Premium zone (3,402 → 3,382)** are already in play.
- Targeting the **0.382 retracement** initially, with continuation to 0.5 and **Order Block (OB)** near **3,351**.
- If price reaches 0.618 or 0.786, we enter **Buy Setup Zone** for intraday bullish bounce.
- Strong OB visible between **3,320–3,338**; ideal for scalping longs with tight SL.
---
### 🎯 Scalping Strategy:
#### ✅ Sell Setup:
- Entry: 3,398–3,402
- TP1: 3,382
- TP2: 3,371
- SL: 3,407
#### ✅ Buy Setup:
- Entry: 3,351–3,338
- TP1: 3,366
- TP2: 3,389
- SL: 3,329
---
### 🧭 Notes:
- Watch USD news events marked on the chart (🟦).
- Avoid entering trades near high-impact data drops.
- Focus on **reaction at OB zones + confluence with Fib** for sniper entries.
---
> ⚠️ **Reminder**: Scalping is all about precision & discipline. Stick to your SL and plan!
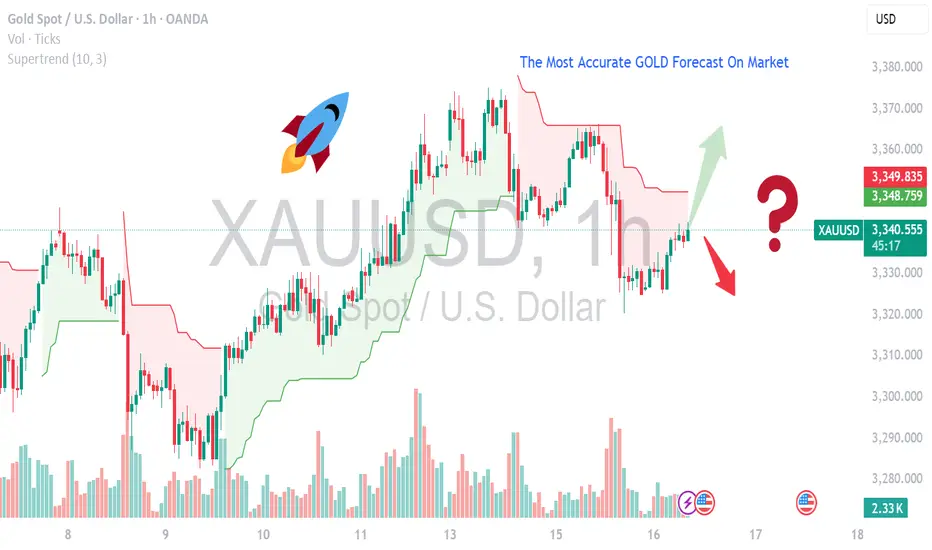
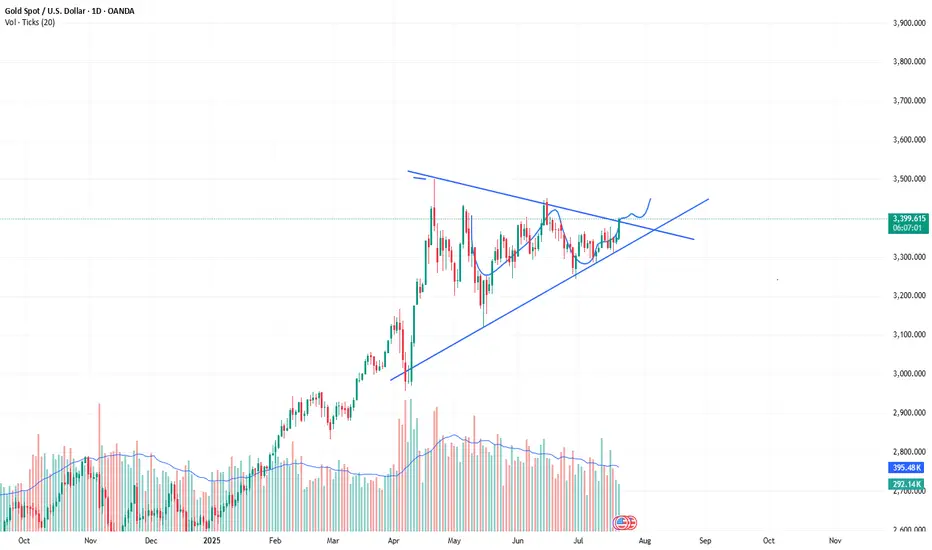
MOST ACCURATE XAUUSD GOLD FORECAST ANALYSIS MARKETCurrent Setup & Technical Outlook
Consolidation & Pennant Formation: Gold is building a bullish pennant and trading above its 50‑day MA — a classic continuation pattern suggesting a breakout toward new highs if momentum resumes .
Key Levels:
Support: $3,330–3,340 — confirmed by multiple technical sources .
Resistance/Breakout Zone: $3,360–3,375 — clearing this could trigger a rally toward $3,400+ .
Upside Targets: $3,390, then possibly $3,500–$3,535 per weekly forecast .
Alternate Bearish Scenario: A failure around the 0.618 Fibonacci resistance (~$3,374) and overbought RSI could spark a pullback to $3,356 or lower .
---
🧠 Fundamental Drivers
Inflation & U.S. Macro Data: Market awaits June CPI/PPI and Fed commentary — cooler inflation could boost gold via dovish expectations, while hotter data may strengthen the USD and weigh on bullion .
Geopolitical & Safe-Haven Demand: Trade tensions (e.g., tariffs) are keeping gold elevated near $3,350–$3,360 .
Central Bank & Real Yields Watch: Continued gold purchases and lower real rates are supportive, although mid-term easing in risks (like global trade) could curb momentum .
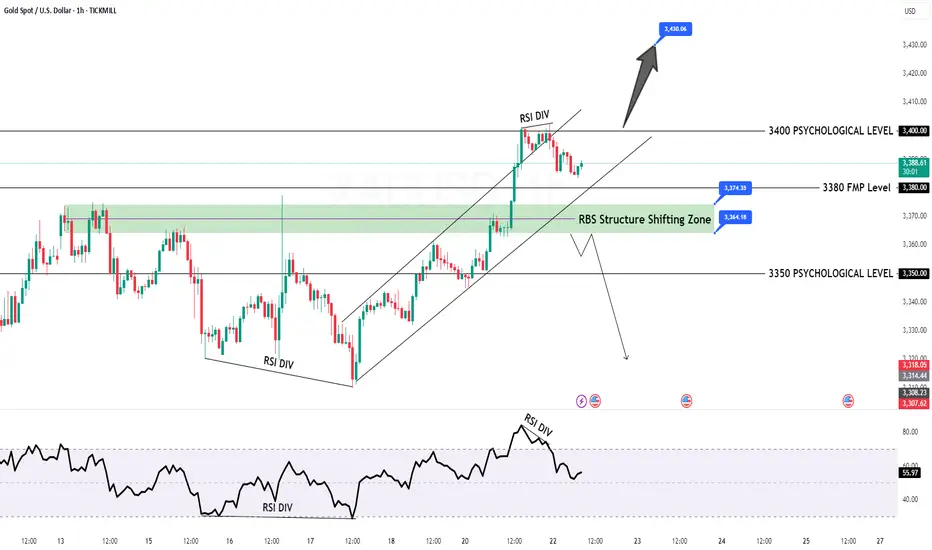
GOLD Intraday H1 Chart Update For 22 July 2025Hello Traders,
Today we have FED Chair Powell Speech ahead
all eyes on 3400 Psychological Level Break for now, if market successfully breaks 3400 then it will move towards 3435
below 3400 it will move back towards 3350 level
Disclaimer: Forex is Risky
XAUUSD SEEMS BEARISHAs we can see gold has created Descending triangle pattern which lead the gold in more bearish momentum.

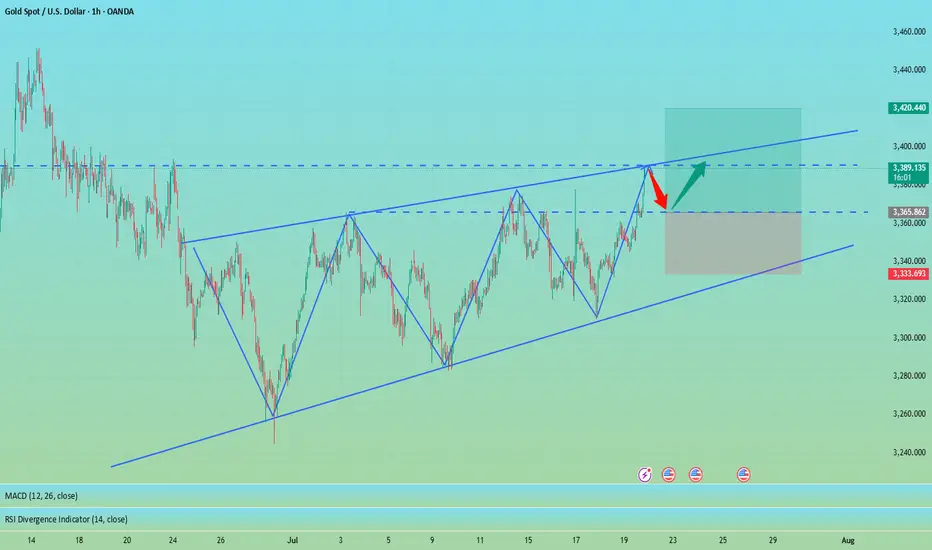
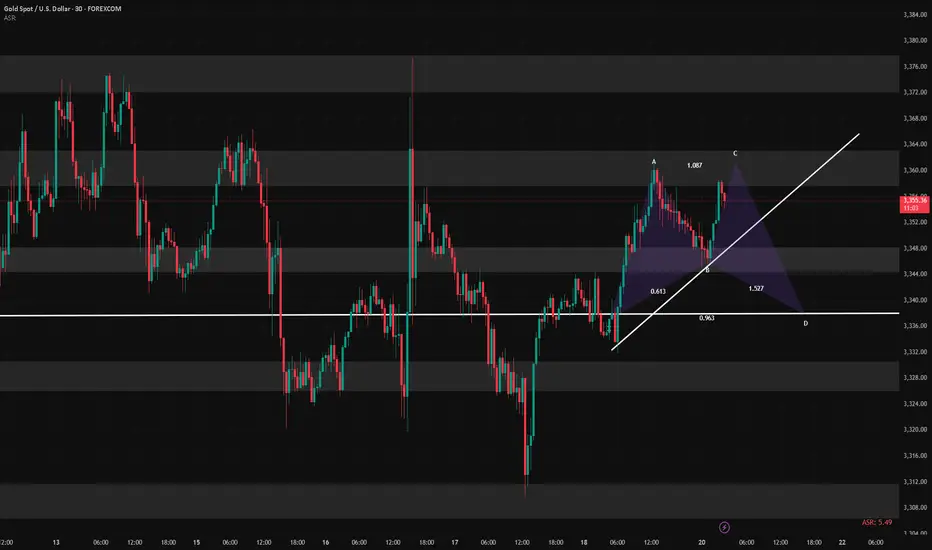
XAUUSD Continues Bullish Structure With Key Retracement OpportunTechnical Outlook – 22/07/2025
On the 1-hour chart, XAUUSD is maintaining a clear bullish market structure with a sequence of higher highs and higher lows. The projected price path drawn on the chart suggests a potential retracement before a continuation toward the 3,420 USD region. Let’s break down the key technical zones and strategies for today:
Key Levels to Watch
Immediate Resistance: 3,390 – 3,400 USD
This is the recent high. A breakout above this area could trigger momentum toward the projected 3,420 USD extension.
Support Zone: 3,345 – 3,350 USD
This zone aligns with the potential pullback as illustrated on the chart, offering a high-probability buy-the-dip opportunity. It coincides with previous structure resistance now turned support.
Trendline Support: The ascending yellow trendline has been respected multiple times and should act as dynamic support on any intraday retracements.
Indicators & Tools Used
EMA: Price is currently trading above the short-term EMA (not shown), suggesting intraday bullish bias remains intact.
RSI (Recommended Use): Look for RSI near 40–50 on the pullback for confluence at support.
Fibonacci Tool (suggested): If measuring from the swing low near 3,320 to the high of 3,390, the 0.618 Fib lies close to 3,345 – an ideal area to look for long entries.
Suggested Trading Strategies
🔹 Buy the Dip Strategy:
Wait for a corrective move into the 3,345–3,350 area. Confirm with bullish reversal candles or RSI support, then enter long targeting 3,400–3,420. Stop-loss ideally below 3,335 (structure break).
🔹 Breakout Continuation Strategy:
If price breaks cleanly above 3,390 with volume, a momentum trade toward 3,410–3,420 is viable. Use tight trailing stops to protect gains.
🔹 Avoid chasing highs – Patience at support zones or confirmation above resistance will offer better reward/risk setups.
Conclusion
Gold is respecting bullish market behavior on the 1H chart, and while a short-term correction is expected, the broader trend favors upside continuation. The 3,345–3,350 area will be critical for today's trading decisions.
Remember to follow for more updates and strategy insights. Save this post if you find it useful.
If you’d like, I can also add a version using RSI or Fib levels directly plotted. Let me know.

July 21: Key Resistance at 3358–3366, Breakout Targets 3378–3388Good morning, everyone!
Last Friday, gold tested the support around 3332 but did not break below it. The price then rebounded to the 3358 zone, where it encountered selling pressure and pulled back. At today's open, the price retraced to the 3343 level, where support held well, prompting another rally back toward 3358.
It’s important to note that since the 3358 resistance was already tested on Friday, some of the selling pressure has likely been absorbed. As a result, there is a higher probability of a breakout today. If a breakout occurs, the next key resistance lies at 3366/3372–3378. In the case of strong bullish momentum, the price may extend further toward the 3386–3392 resistance zone.
However, if the price continues to be capped below 3358–3366, we may see a consolidation or short-term pullback. In this case, watch support at 3348–3343. Should the price successfully break above 3378, then support on pullbacks will shift higher to 3363 and 3358–3352.
🔺 Key Warning: The 3358 resistance zone is technically crucial. If the price repeatedly fails to break through, watch out for a potential double-top pattern on the 30-minute chart, which could signal a near-term bearish reversal.
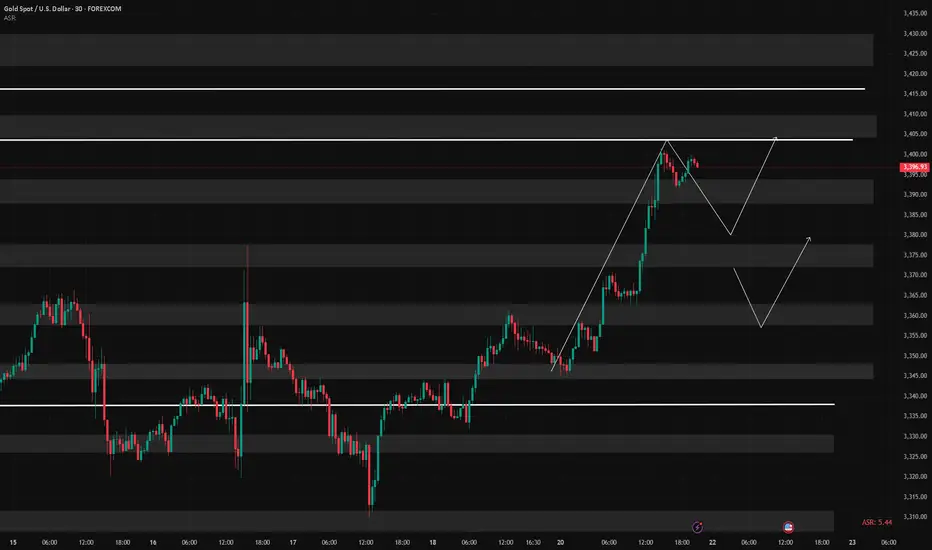
7/ 22: Focus on Selling at Highs, Key Support at 3378–3372Good morning, everyone!
I’ve unfortunately injured my lower back and will need to rest in bed for a while, so I’ll keep today’s market commentary brief.
Yesterday, gold rallied to test the 3400 level, a key psychological and technical resistance area that naturally triggered notable selling pressure. Given this, chasing long positions at current levels is not recommended.
On the downside, support is seen near 3378. If this level holds, the price may attempt another rebound. On the upside, key resistance levels to watch are:
3407 as the initial resistance
3416–3423 as the stronger resistance zone
For today’s trading strategy, consider focusing on selling into strength near resistance levels. Once the selling pressure is absorbed, there may be an opportunity to re-enter on the long side at lower levels, allowing for better risk management and entry conditions.
"Gold Price Bearish Reversal: Key Sell Targets Identified"This 4-hour chart of Gold (XAU/USD) shows a potential bearish reversal pattern forming after a rising wedge breakout. The chart indicates a SELL signal near the $3,392 resistance zone, with three downside targets at:
1. $3,323.773
2. $3,262.540
3. $3,195.497
Highlighted support zones suggest possible price retracements to these levels.

XAUUSD:The next target is 3430.The market is developing completely in accordance with the expectations of the band trading center. Today is a day of sharp rise. As Monday, this increase is quite considerable.
The three reminders to buy are all at a lower position. The post clearly points out that the market has reached 3400. 3400 is a controversial position. It needs to fluctuate in the New York market, and then there will be some breakthroughs. If it is stronger, it will directly break through the New York market. In the short term, you can pay a little attention to the retracement position of 3390-3395. Then continue to buy. The next target is 3430.
Gold Spot / U.S. Dollar (XAU/USD) 4-Hour Chart - OANDA4-hour chart displays the price movement of Gold Spot (XAU) against the U.S. Dollar (USD) from late July to early August 2025. The current price is 3,390.266, with a recent decrease of 10.870 (-0.32%). Key levels include a sell price of 3,336.420 and a buy price of 3,337.020, with a resistance zone highlighted between 3,340.720 and 3,380.000, and a support zone around 3,314.186. The chart includes candlestick patterns and trading indicators.

gold on sell#XAUUSD sell at 3362, the candle is rejecting on bullish which will make retracment on the price.
Entry below 3362 on H1 or M15 closure. Target 3344, stop loss 3372.
Bullish can break following longer candle closure on H1.

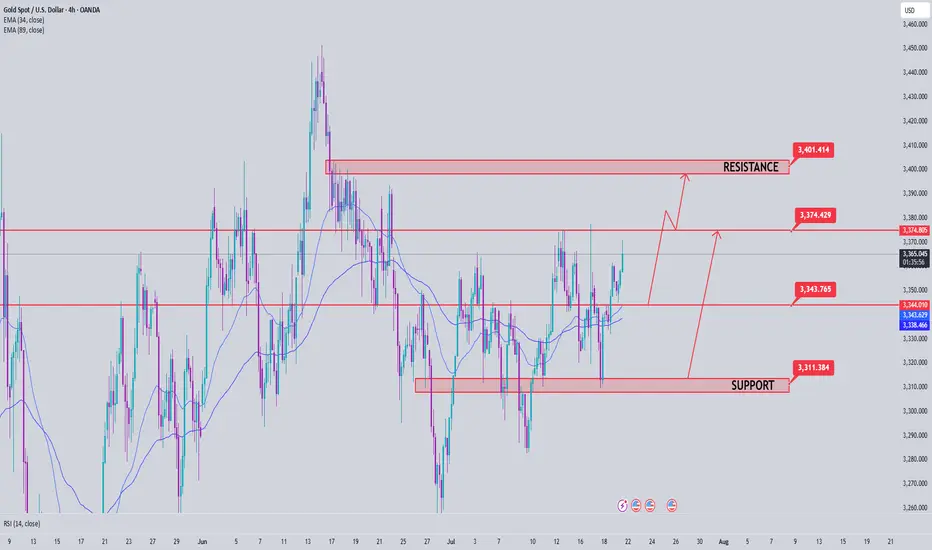
XAUUSD ANALYSIS – JULY 18XAUUSD ANALYSIS – JULY 18: STRATEGY BASED ON FIBONACCI, TRENDLINE & STRUCTURE
1. XAUUSD Technical Overview (4H Chart)
Gold (XAUUSD) is currently trading around 3,343 USD, showing signs of a slight rebound from key support. On the 4H timeframe, the price structure is forming higher lows, maintaining above a short-term rising trendline – a technically bullish signal.
2. Key Support & Resistance Zones
Immediate Supports:
3,338 USD: aligning with the 0.618 Fibonacci retracement – a zone tested multiple times.
3,333 – 3,335 USD: strong support, overlapping with EMA and rising trendline.
3,327 USD: previous swing low – last defense for the bullish structure.
Immediate Resistances:
3,345 – 3,346 USD: frequently rejected zone in recent sessions.
3,350 USD: psychological and technical resistance.
3,358 USD: recent swing high – breakout confirmation level.
3. Price Action & Fibonacci Confluence
Price is currently hovering between Fibo 0.5 (3,343 USD) and Fibo 0.618 (3,338 USD) – a potential bounce zone if bullish momentum holds.
The pullback from 3,358 to 3,286 has respected standard Fibonacci retracement levels, confirming technical price behavior.
4. Trendline Analysis
The ascending trendline from the 3,275 USD low remains intact, providing solid dynamic support.
If the price continues to bounce from this trendline, it may form a bullish continuation pattern (flag/pennant).
5. Suggested Trading Strategies
Long
Entry: 3,338 – 3,340 USD
SL: 3,327 USD
TP: 3,345 – 3,350 – 3,358 USD
Note: Buying the dip near Fib & trendline
Short
Entry: Below 3,327 USD (breakdown)
SL: Above 3,340 USD
TP: 3,310 – 3,298 USD
Notes: Only if price breaks trendline & support
6. Supporting Technical Indicators
EMA20/EMA50 show slight upward momentum – early bullish bias.
RSI (14) hovers near 50 – neutral zone, awaiting breakout confirmation.
Conclusion:
Gold is consolidating around a critical support zone. The short-term bias leans bullish if the 3,338 – 3,333 USD region holds and price breaks above 3,346 – 3,350 USD.
This is a key moment to position early using Fibonacci and trendline confluence.
👉 Follow for more strategies in upcoming sessions. Save this if you find it useful!
Do you have a different view? Share your thoughts in the comments below!

GBPAUD's wide trading range remains intact✏️GBPAUD is trading in a wide range. After the increase on Friday, the pair is retesting the support zone breaking past resistance. And the current reaction point also coincides with the 20 SMA. There is not much momentum for the pair to break out of the wide trading range, so buying the pair to the upper range of 2.097 is a reasonable choice at the moment.
📉 Key Levels
Support: 2.058
Resistance: 2.083-2.096
BUY Trigger: Confirmed bounce from 2.059 (EMA support)
Target 2.09600
BUY DCA Trigger: Break 2.083
Leave your comments on the idea. I am happy to read your views.

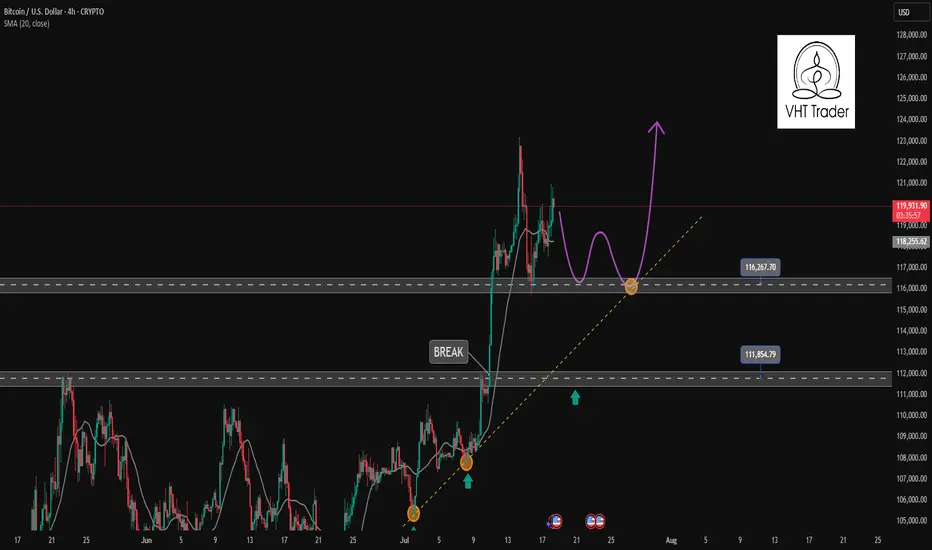
Find a recovery point to continue buying BTC✏️ CRYPTO:BTCUSD is trading near the all-time high. The trading strategy is to wait for some investors to take profit so that the price can return to the nearest support zones and continue to buy to the new all-time high zones.
📉 Key Levels
BUY Trigger: confirms the recovery from the support trend line 116000
BUY zone 112000 (Strong support zone)
Target 129000
Leave your comments on the idea. I am happy to read your views.
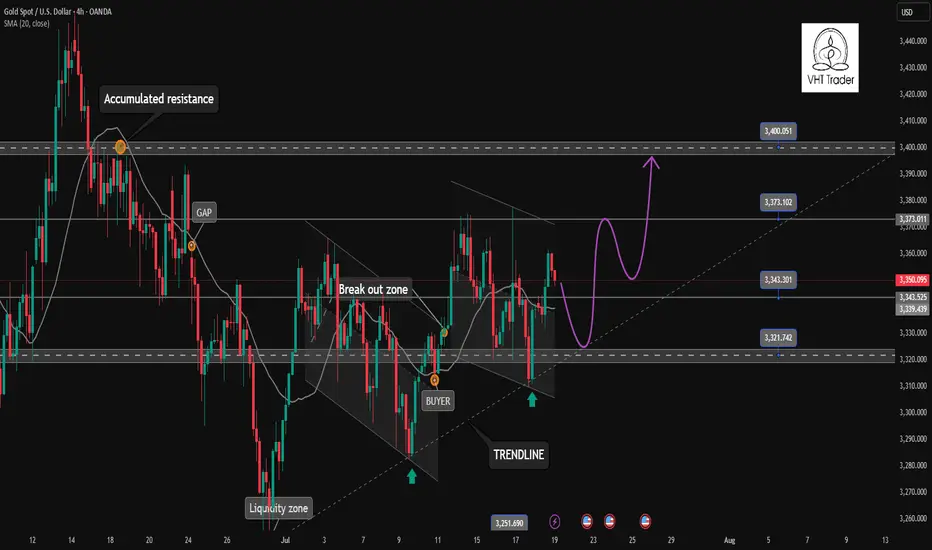
Gold returns to its original nature. Price increase towards 3400✏️ OANDA:XAUUSD is back to its inherent uptrend. Currently trading in a wide range. Shaped by CPI news last week. Trendline is still supporting Gold price towards 3400 next week. Pay attention to the important zone 3373 to DCA BUY and do not SELL when breaking this important zone 3373. Effective trading strategy is to wait for Gold to correct and buy.
📉 Key Levels
Support: 3343 - 3322
Resistance: 3373-3400
Buy Trigger: Rejects the support zone 3343 and reacts to the upside
Buy Trigger: Rebound from 3322
Target 3400
Leave your comments on the idea. I am happy to read your views.
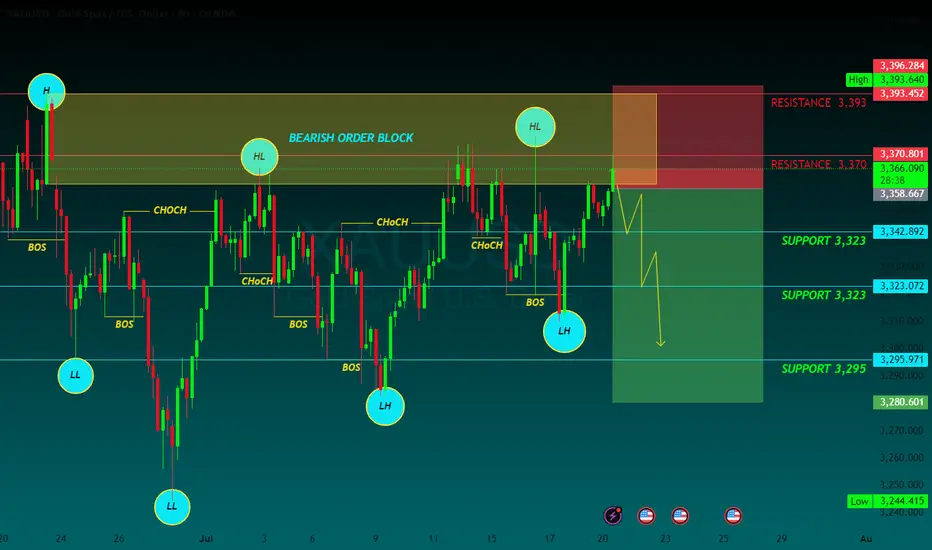
GOLD SELLGold price remains confined in a multi-week-old range as bulls seem reluctant
Gold price attracts some safe-haven flows amid persistent trade-related uncertainties. Mixed Fed rate cut cues keep the USD depressed and further benefit the XAU/USD pair. The range-bound price action warrants some caution before placing fresh bullish bets.
In the Forex market, Gold functions as a currency. The particularity of Gold is that it is traded against the United States Dollar (USD), with the internationally accepted code for gold being XAU.
Known as a safe-haven asset, Gold is expected to appreciate in periods of market volatility and economic uncertainty. Gold is also widely seen as a hedge against inflation and against depreciating currencies as it doesn’t rely on any specific issuer or government.
Central banks are the biggest Gold holders. In their aim to support their currencies in turbulent times, central banks tend to diversify their reserves and buy Gold to improve the perceived strength of the economy and the currency. The United States is the country that holds the biggest resources of Gold in the world.
1 SUPPORT 3,323
2 SUPPORT 3,323
3 SUPPORT 3,295
1 RESISTANCE 3,370
2 RESISTANCE 3,393
Gold Price Analysis July 21After being reinforced by CPI data last week, gold prices have regained their bullish momentum and are currently trading in a wide range. The technical structure still shows a dominant uptrend, with the trendline continuing to act as reliable support, targeting the important resistance zone of 3400 next week.
📌 Preferred trading strategy:
Watch the price reaction around the support zone of 3343. If there is a rejection signal of this zone accompanied by buying pressure, that will be the ideal entry point.
If the price continues to correct deeper, the strong support zone of 3322 will be a reasonable DCA point.
It is not recommended to SELL if the price breaks the confluence zone of 3373, as this is a signal confirming the strong bullish momentum continues.
📍 Important price zones:
Support: 3343 – 3322
Resistance: 3373 – 3400
🚀 Buy Trigger:
Price rejects 3343 zone with clear bullish signal
Strong bounce from 3322 zone
7/18: Watch 3343 Resistance, Guard Against Break Below 3323Good morning, everyone!
Yesterday, gold broke below the 3337 support after consolidating there, driven lower by bearish data, and eventually reached the 3323–3312 support zone. A rebound followed, and price has now returned above 3323, which also aligns with the daily MA60.
📌 Key Levels to Watch Today:
Resistance: 3343 / 3352–3358
→ A sustained break above 3343 opens the door for a potential move toward 3366 / 3372–3378;
Support: 3323 / 3312
→ If price remains capped below resistance and weekly close is under 3323, it will signal bearish structural pressure for the medium term.
📌 Trading Strategy:
Trade flexibly within the range of 3358–3343–3332–3323–3312
📌 Important Reminder:
If today’s closing price is below 3323, and you're planning to hold positions over the weekend, it’s safer to lean short. While we can’t predict weekend news, technically, bears have the upper hand, so risk control is essential.
Gold Strategy: Long in 3320-3330 & TargetsDuring Friday’s (July 18th) US trading session, spot gold traded in a narrow range with a downward bias 😔, currently hovering around 3350.05. Thursday saw spot gold stage a heart-stopping "deep V" move 😲! Driven by the dual catalysts of the US June retail sales surging 0.6% (beating expectations) and initial jobless claims dropping to 221,000, the US Dollar Index once spiked to a monthly high of 98.95, instantly slamming spot gold to an intraday low of 3309.82. Surprisingly, however, gold prices then staged a strong rebound, closing at 3338.86 with a mere 0.25% decline.
This "fake dip" pattern reveals a deep-seated contradiction in the current market – while economic data temporarily supports dollar strength, investors’ inflation concerns triggered by tariffs are forming an "invisible buying force" for gold 💪. The concurrent rise in the dollar and US Treasury yields has indeed weighed on gold prices, yet robust buying interest emerges at every dip window. Behind this phenomenon lies shrewd capital quietly positioning itself. When the 10-year US Treasury yield climbed to a monthly high of 4.495%, gold refused to fall further – this divergence signals significant market 分歧 over the Federal Reserve’s policy trajectory 😕.
Gold Trend Analysis:
Gold remains in a bullish trend 👍. From the daily chart perspective, gold continued its strong upward momentum today, closing with a positive candle. Technically, the MACD bullish energy bars have started to expand, and the KDJ is in a golden cross heading upward, indicating that the overall price is in a strong phase. As long as gold doesn’t break below 3320, the market is expected to continue its upward trajectory, potentially targeting 3375-3400. If it fails to break through, gold may see a minor short-term pullback. If the pullback doesn’t break 3330, gold is likely to gather momentum again to attack 3375; a break below would shift focus to the 3310 support level. As long as 3310 holds, gold remains in a bullish rebound structure. Next week’s broad range is expected to be 3375-3310.
On the 4-hour chart, the KDJ indicator, after being oversold, has started to turn upward and is now in a golden cross. Notably, this upward move has been accompanied by clear medium bullish candles, making KDJ a more reliable indicator here – the potential for continued bullish candles remains high 😃. The MACD fast line is turning upward at a high level, on the verge of another golden cross, with green energy bars continuing to contract and poised to turn red by inertia. Overall, gold’s current trend is either consolidating or rising. Given the clear bullish bias, we can consider firmly going long first, and only observe the possibility of shorting when KDJ approaches the upper 100 level and the MACD fast/slow lines are about to cross.
Focus on buying on pullbacks. The short-term support levels lie at 3330-3320 – as long as these levels hold, they present buying opportunities. If gold rises during the US session, watch whether 3365 and 3375 are broken; a failure to break through could bring pullback space, offering opportunities for short-term short positions.
Gold Trading Strategy 😎: Go long decisively once on the first pullback to the 3320-3330 range 😏, with targets looking at the 3350-3360 range – just wait for profits to roll in 💰!
🚀 Buy @3320 - 3330
🚀 TP 3340 - 3350
Accurate signals are updated every day 📈 If you encounter any problems during trading, these signals can serve as your reliable guide 🧭 Feel free to refer to them! I sincerely hope they'll be of great help to you 🌟 👇
