XAUUSD – Bears Gave It a Shot, But Bulls Still in Control1. Quick recap of yesterday
In yesterday’s analysis, I highlighted the possibility of a short-term correction on Gold and noted that, although risky, a short trade could be justified. Acting on that conviction, I took a short with a sniper entry, capturing over 250 pips in floating profit. However, Gold found strong support around 3350 and reversed aggressively. I closed the trade with a more modest +140 pips gain.
2. Key development: NY session reversal
Despite early signs of weakness, the New York session flipped the script, sending Gold back toward the top of the daily range. The daily close near highs tells us one thing:
➡️ The bulls aren’t done just yet.
3. Technical outlook
• Resistance remains firm at 3375–3380+ zone
• A clear breakout above this zone opens the door for 3400+, with a likely magnet at 3430
• As long as the market holds above this week’s low, dips are buyable opportunities
4. Trading plan
For now, the bias shifts back to the long side. I’m watching for intraday dips to build longs, with invalidation below this week’s low. The structure favors continuation — but only if 3380 gives way we have confirmation.
5. Final thoughts
Gold may have teased the bears, but the real power still lies with the bulls. If momentum kicks in above 3380, we could be on our way to test 3430 soon. 🏹
Disclosure: I am part of TradeNation's Influencer program and receive a monthly fee for using their TradingView charts in my analyses and educational articles.
Xauusdsignal

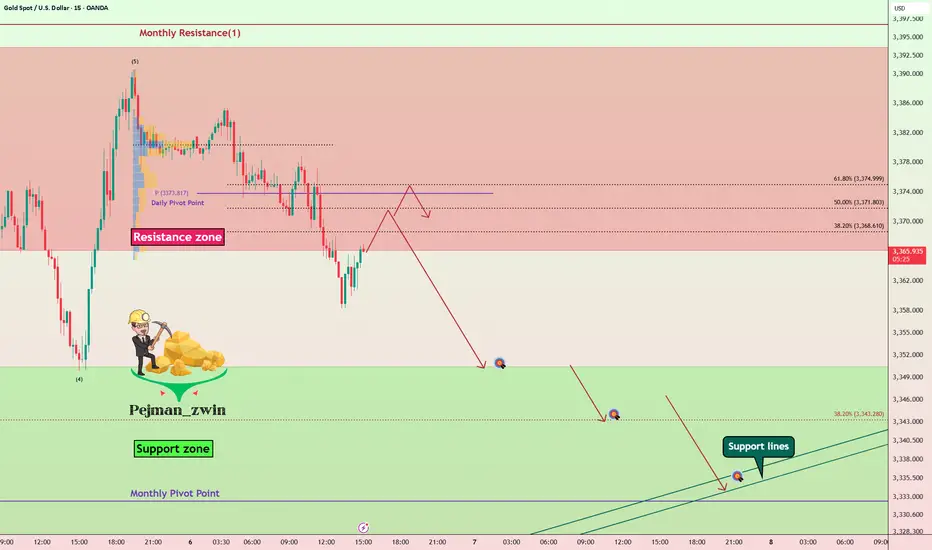
Gold Roadmap — Short termGold ( OANDA:XAUUSD ) rose to $3,383 as I expected in yesterday's idea .
Gold is currently moving in the Resistance zone($3,393-$3,366) .
In terms of Elliott Wave theory , it seems that Gold has completed 5 impulse waves , and we should wait for corrective waves on the 15-minute time frame .
I expect Gold to start declining from one of the Fibonacci levels and fall to at least $3,351 .
Second Target: $3,344
Third Target: Monthly Pivot Point/Support lines
Note: Stop Loss (SL) = $3,392
Gold Analyze (XAUUSD), 15-minute time frame.
Be sure to follow the updated ideas.
Do not forget to put a Stop loss for your positions (For every position you want to open).
Please follow your strategy; this is just my idea, and I will gladly see your ideas in this post.
Please do not forget the ✅ ' like ' ✅ button 🙏😊 & Share it with your friends; thanks, and Trade safe.
Gold Bounces from PRZ — Is a Short-Term Rally Underway?Gold ( OANDA:XAUUSD ) started to rise from the Support zone($3,307-$3,275) as I expected in the previous idea .
Gold is currently moving near the Support zone($3,350-$3,326) , Potential Reversal Zone(PRZ) , and $3,334 (Important price) .
From the Elliott wave theory , it seems that Gold has completed its 5 impulsive waves and now we should wait for corrective waves . Corrective waves can complete at the Potential Reversal Zone(PRZ) .
I expect Gold to rise to $3,383(at least) in the coming hours .
Second Target: $3,396
Note: Stop Loss (SL) = $3,321
Gold Analyze (XAUUSD), 1-hour time frame.
Be sure to follow the updated ideas.
Do not forget to put a Stop loss for your positions (For every position you want to open).
Please follow your strategy; this is just my idea, and I will gladly see your ideas in this post.
Please do not forget the ✅ ' like ' ✅ button 🙏😊 & Share it with your friends; thanks, and Trade safe.

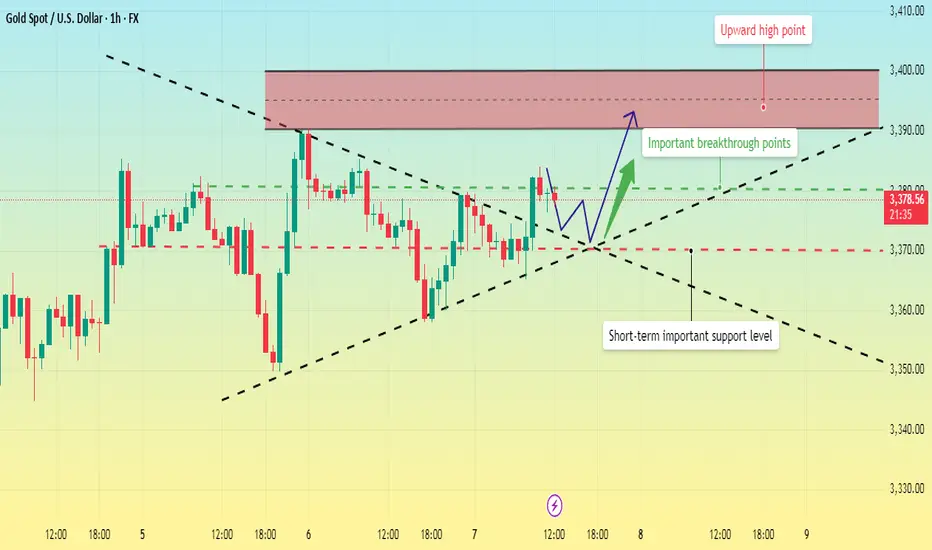
Gold – Bulls Hold the Line, Pressure Builds for Upside BreakoutIn yesterday’s analysis, I argued that following Tuesday’s reversal — which printed a strong continuation bullish Pin Bar — buyers had regained control despite the intraday pullback.
For this reason, I suggested looking to buy dips, as the structure remained constructive.
And once again, during yesterday’s session, the scenario repeated itself.
The drop toward the 3360 zone was met with renewed buying interest, keeping the bullish structure intact.
________________________________________
🔍 Technical Context – Higher Lows Building Pressure
At the time of writing, Gold is trading around 3380, a short-term resistance area that has capped gains so far.
However, the technical picture remains bullish:
Starting with Monday’s low at 3340, which came after a strong impulsive leg up, price has printed a clear succession of higher lows.
This behavior strongly suggests increasing buying pressure and builds the case for a potential breakout to the upside.
________________________________________
🎯 Trading Bias – Holding My Long Position
My bias remains bullish.
In fact, I’m currently holding a long position, entered yesterday, which is now running with a 150 pips unrealized profit.
I’m sticking with the trade, anticipating that a confirmed break above 3380–3390 could trigger upside acceleration toward my final target — a 750 pips profit objective.
________________________________________
🔄 What to Watch Next
• Daily close: A close above 3380=3385 zone would add confirmation to the bullish thesis.
• Key support: The zone around 3360 is now support.
• Breakout trigger: A move above 3380–3385 could unleash momentum buying and open the path to higher levels.
________________________________________
Let’s stay patient and let the market confirm the breakout.
Until then, the structure favors the bulls. 🚀
Disclosure: I am part of TradeNation's Influencer program and receive a monthly fee for using their TradingView charts in my analyses and educational articles.

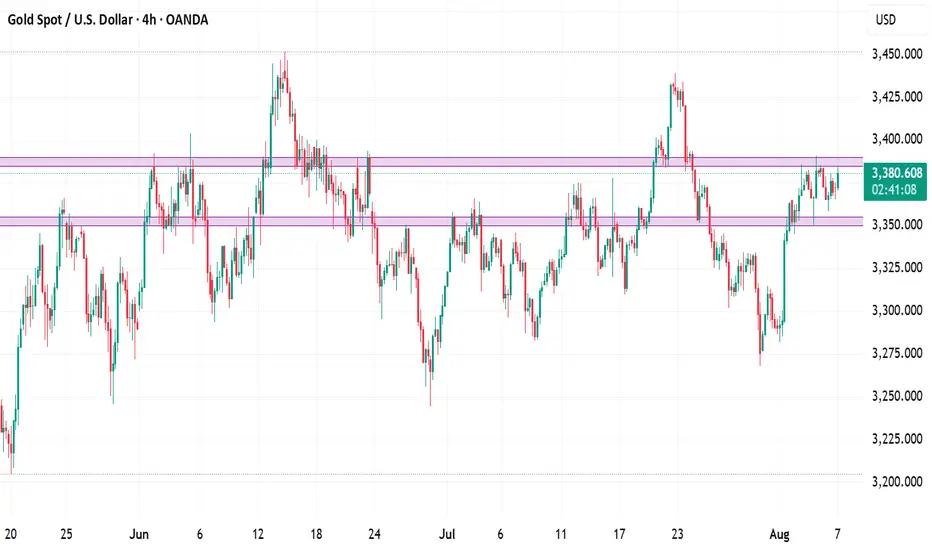
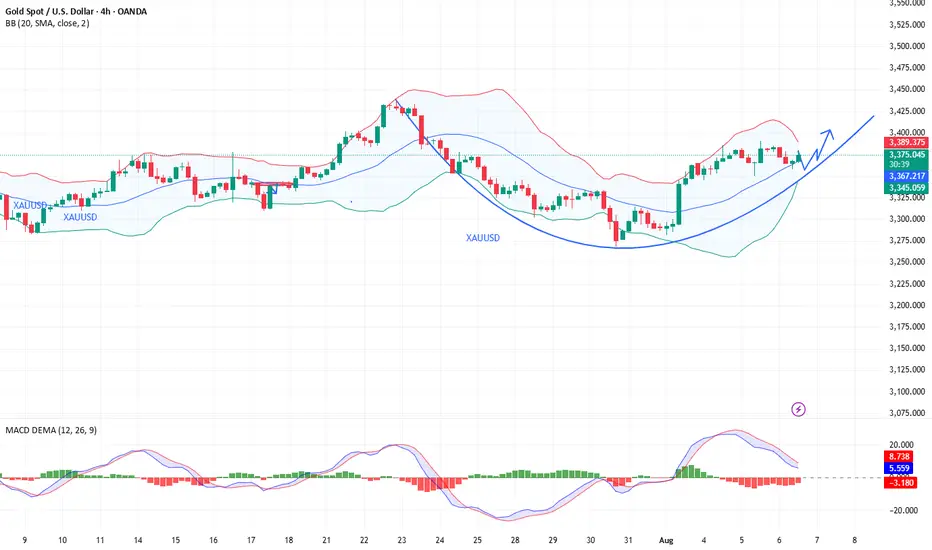
Gold trading rhythm is perfectly matchedIn the previous strategy, we recommended maintaining a high-selling and buying-low strategy for gold. We accurately predicted the high point near 3397 and arranged short positions near 3395. It then fell steadily to around 3371. Judging from the current gold trend, gold rose and then fell in the European session, touching around 3397, which is exactly the pressure level of the upward channel trend line. The Bollinger Bands in the 4H cycle closed, and the indicators temporarily showed signs of differentiation, but the overall market was resistant to declines at high levels. The current short-term support is around 3375-3370. If it does not break the short-term, it will still be volatile. If it falls below, the strong support of 3360 will be seen. The upper pressure levels are 3385, 3398-3400. In terms of operation, we still maintain a high-altitude, low-multiple short-term strategy. I will give the specific operation ideas at the bottom, remember to pay attention in time!

Gold is under pressure. Can the upward trend continue?On Thursday, gold rose rapidly in the European session, reaching around 3397, but failed to successfully break through the 3400 integer mark; it currently fell back slightly and fluctuated around 3375. Judging from the 4-hour chart, the price is currently running close to the middle track of the Bollinger band; since the market opened this week, the gold price has continued to run above the middle track of the Bollinger band. Despite the slight decline, it has remained within the upward trend channel and has continuously set new highs.
The current upward pressure position remains at 3390-3400, and the key support level is around 3370, which is also the crossover position of the current MA5, 10, and 20 moving averages. The RSI indicator remains above its midline, indicating that bullish momentum remains.
Quaid believes that as long as the price remains above 3370 in the US session, any pullback will be a sign of accumulating upward momentum. Gold still has the trend of hitting the 3400 integer mark.
Trading strategy:
Go long near 3370, stop loss at 3360, profit range 3380-3390-3400.
Short near 3400, stop loss at 3410, profit range 3375-3365-3355.

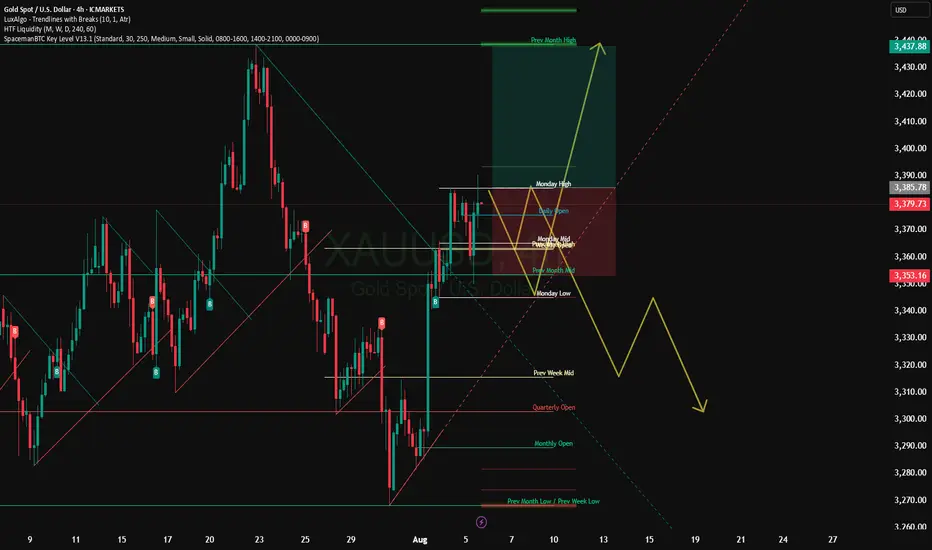
Strike with precision and win in the gold trading market!Gold continues to fluctuate in an upward structure, with lows gradually rising, showing that the bulls are still in a dominant position. The current key support has moved up to the 3360 line. Before this position is effectively broken, the overall idea is to maintain a low-long strategy. It should be noted that the current market has been consolidating at a high level for three consecutive days, and has the basis for further strengthening. It is not advisable to wait for a sharp pullback at this time, but to pay attention to the continuity opportunities of direct pull-ups. It is recommended to seize the strong continuation opportunities in the current period in terms of operations, and strategically postpone it to the European and American trading sessions for simultaneous execution. Specifically pay attention to the long order layout opportunities in the support area of 3375-3360, and the upper resistance is around 3390-3405. Overall, we should flexibly participate in the high-altitude and low-long rhythm in this range. It is recommended to wait and see in the middle position, chase orders cautiously, and wait patiently for key points to enter the market.

Gold Consolidates at High Levels. Waiting for a New Trend?Gold barely held the 3360 level on Wednesday and will remain in the 3360-3380 consolidation range outlined by Quaid.
Quaid considers Thursday to be a more important day. From a timing perspective, today may impact whether gold can continue its upward trend. However, it is possible that the market could continue its consolidation today. One thing is that the daily line must close above 3360, then the subsequent rise in gold will continue.
On the contrary, if it closes below 3360, then the rise will definitely not be able to continue in the short term. In the short term, gold may remain above 3370 today.
We can see that 3375-3370 is an important support, but the daily line has not yet stabilized above 3380, so the upward space has not yet been opened. If the daily chart can stabilize above 3380, then a test of 3400-3410 is in the cards.
Trading strategy:
Buy between 3365-3370, stop loss at 3355, profit range 3380-3390-3400.
Institutional Gold Strategy Note – August 7, 2025🔍 Executive Summary
Gold (XAU/USD) continues to hold firm above the $3,370 handle, supported by a bullish macro narrative and confirmed technical structure on the 4-hour chart. Amid dovish expectations from the Fed and soft labor market data out of the U.S., bullion maintains its premium as a hedge, attracting institutional flow in line with the rate-cut narrative for Q3–Q4.
Today’s market profile suggests a high-probability long setup, anchored in a fresh demand structure just below current price, supported by unmitigated institutional order flow, premium discount levels, and clear liquidity sweeps.
🎯 Directional Bias: Bullish–Transitional
While price is consolidating around $3,378, the underlying structure favors a bullish continuation. A Change of Character (CHoCH) has been confirmed on the 4H chart, suggesting a shift from corrective to impulsive intent. Liquidity remains stacked below recent equal lows, and the premium-to-discount array strongly favors buy-side execution.
🟩 Primary Buy Zone (GOLDEN ZONE)
Entry: $3,350–$3,355 | Stop-Loss: < $3,340 | Targets: $3,400 / $3,430
This zone represents the highest institutional quality setup of the day. It aligns with:
A fresh unmitigated Rally-Base-Rally Demand Zone
A refined Bullish Order Block within optimal trade entry (OTE) discount range
A Fair Value Gap (FVG) aligned with internal BOS leg
Equal Lows (EQL) sweep below $3,355, targeting liquidity
Overlap with volume imbalance, suggesting a clean institutional leg
Clear CHoCH confirming bullish structure
Kill Zone Alignment: Asia–London overlap, pre-London accumulation
This zone is statistically favored for execution by both Smart Money and legacy institutions, given its confluence density and asymmetrical risk profile.
🟥 Primary Sell Zone
Entry: $3,385–$3,390 | Stop-Loss: > $3,400 | Targets: $3,350 / $3,320
A valid counter-trend liquidity sweep opportunity, located above short-term equal highs near the psychological $3,400 level. Key confluences include:
Drop-Base-Drop Supply Zone
Overlapping FVG + OB in premium zone
Alignment with OTE premium retracement
Liquidity cluster near recent EQH
Structural resistance + round-number magnetism
Execution window during London–NY overlap
This zone is valid only for short-duration scalps or short-term reversal positioning.
🟢 Fallback Buy Zone (If Primary is invalidated)
Entry: $3,320–$3,325 | SL: < $3,310 | TPs: $3,400 / $3,430
A deeper mitigation zone with reduced confluence but adequate historical support. This zone captures:
A mitigated OB inside Demand
0.618 Fib retracement from internal BOS
Liquidity sweep potential of a broader EQL stack
Minor structure support
Use only if the market sweeps the primary zone and rebalances deeper.
🔻 Fallback Sell Zone (If Primary Sell fails)
Entry: $3,410–$3,415 | SL: > $3,420 | TP: $3,350
Set well above prior resistance, this extended zone aligns with:
Extended Supply + Unmitigated OB
FVG inside premium OTE zone
Recent accumulation liquidity trap (potential fakeout zone)
Session mispricing during NY–Asia rollover
Use only if price impulsively breaches the $3,400 psychological barrier and stalls near the top of an exhaustion leg.
🌐 Institutional Cross-Validation
Citi Group has upgraded its 3-month Gold forecast to $3,500, citing weakening U.S. macro data and elevated inflation expectations as bullish catalysts.
Reuters and FXStreet confirm Gold's hold near 1-week highs with sentiment strongly skewed toward continued demand amid Fed rate-cut odds exceeding 90%.
TradingView pro charts show confluence with OB/FVG zones at both $3,355 and $3,390, validating both primary zones technically.
📌 Final Notes
Action Bias:
Aggressively long from $3,350–$3,355 with tight structure-defined invalidation.
Hold shorts only from $3,385–$3,390 under strict reversal logic.
Risk Reminder:
All zones are built from 4H structural flow only. Intraday volatility outside kill zones may distort price behavior — wait for displacements and internal breaks before entering. Manage partials at 1.272 extension and hold runners toward 1.618 only if structure confirms.
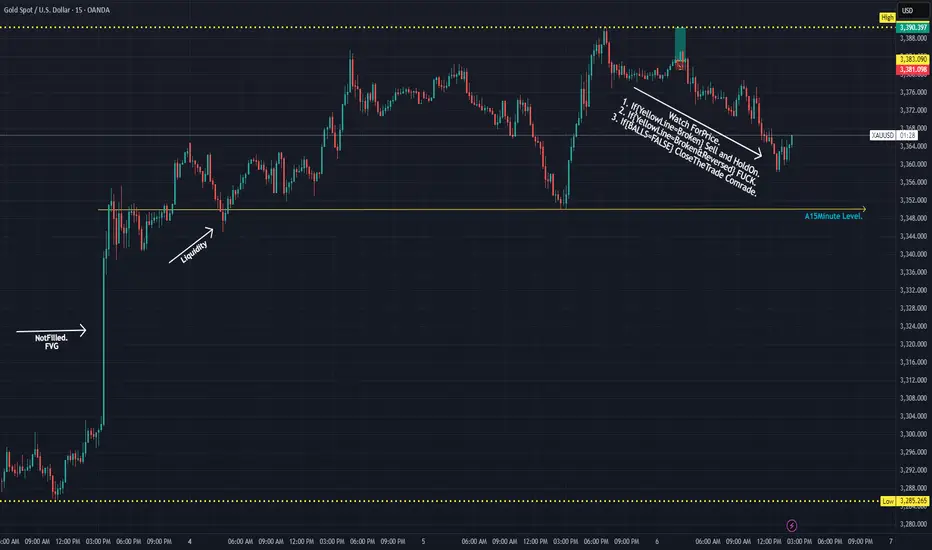
GOLD 15MInute PLan. Enjoy..So the Image is Simple as it is.
Currently @15$ gonna keep trading it.
Started @10$ Last Night.
Gold (XAU/USD) - 2H Wave Setup + Scalp Opportunities# 🔻 Gold (XAU/USD) - 2H Wave Setup + Scalp Opportunities Ahead
**By: Mohsen Mozaffarinezhad**
📅 August 7, 2025 | ⏰ Valid through August 8 (End of NY Session)
⏱ Timeframe: 2H
📌 Method: Elliott Wave + Supply/Demand + SSL Hybrid Confirmation
---
## 🧠 Market Context:
Price has completed a **strong bullish leg** and is currently forming a classic **(a)-(b)-(c)** corrective pattern. We are now between **point (b)** and the potential completion of **(c)**. The broader market is expected to **retest the lower demand POI**, possibly before resuming the uptrend.
---
## 🔎 Technical Highlights:
- 📉 Bearish correction in progress: (b) → (c)
- 📦 Major **Supply** above 3,390 – acted as rejection point
- 🟦 Strong **Demand Zone**: 3,345 – 3,320
- 🔁 Price forming a potential **ABC correction**
- 🔔 **Point of Interest (POI)** near 3,350 may offer entry confirmation
- 💠 **SSL Channel**: Currently bearish crossover
- 🔄 **RQQ, HT, MACD, RSI**: Bearish/neutral, waiting for reversal signals
- 📊 **Volatility (Vol %ile)**: 67%
- 🎯 **ATR**: 13.52 (2H – medium range)
- 🧯 **Risk Level:** Normal
---
## 🟢 Scalp Strategy:
Scalp traders can take advantage of both micro-swings at **points (a) and (b)** using lower TF (M5/M15) confirmations:
### 🎯 Scalp Buy:
- 📍 Entry: Near 3,345–3,350
- 🛑 SL: Below 3,340
- 🎯 TP: 3,365–3,370 (short-term liquidity sweep)
- ⚠️ Only on bullish SSL + RSI divergence (M5)
### 🎯 Scalp Sell:
- 📍 Entry: Near 3,375–3,380 (**point b rejection**)
- 🛑 SL: Above 3,385
- 🎯 TP: 3,360 then 3,350
- ⚠️ Use Heikin-Ashi reversal + SSL confirmation
---
## 📌 Mid-Term Outlook (Swing):
If price reaches **point (c)** around the **lower demand zone** and reacts with bullish structure (BOS, CHoCH), we anticipate a strong rally toward:
- **TP1:** 3,385
- **TP2:** 3,400
- **TP3:** 3,420 (next macro supply)
---
## ⚠️ Notes:
> This setup remains **valid until the end of NY session, August 8**.
> Wait for **clear confirmation** before execution.
> All scalps are suggested with **tight risk management**.
_Analysis by Mohsen Mozaffarinezhad | Educational Purposes Only_
---
#gold #xauusd #elliottwave #supplydemand #sslhybrid #scalping #smartmoney #tradingview #forexanalysis

Elliott Analysis on XAUUSD – Is Gold Ready for Its Finally Rally🚀 Who am I?
I'm Mahdi, a prop firm trader with 7+ years of experience in technical analysis, mainly focusing on Smart Money Concepts and Elliott Wave theory.
I specialize in delivering high-quality trading signals, market insights, and educational content tailored for serious traders and investors.
📊 My Tools: SMC, Elliott Wave, Fibonacci, Liquidity Grabs, Order Blocks
💼 Prop Challenge Passed: Yes | Funded Account: In Progress
🔗 Follow for consistent updates and trading insights.
🌐 Contact Mahdiomidi74@gmail.com
------------------------------------------------------------------------------------
📈 Elliott Wave Analysis on XAUUSD – Is Gold Ready for Its Final Rally? 💥
On the daily chart of XAUUSD, we’re observing the completion of a wave 4 triangle correction (ABCDE), which seems to be setting the stage for the beginning of wave 5 in the larger bullish cycle.
✅ Wave 3 showed a strong impulsive structure, and now the wave 4 triangle suggests consolidation before an explosive breakout toward the $3900 zone.
📍Key Support: 3037
📍Key Resistance: 3901
🌀 We're anticipating a breakout above the upper channel line, potentially launching a sharp move as wave 5 unfolds.
💬 Share your thoughts in the comments! Do you think gold is ready to break its all-time high?
🔥 Save this idea & follow for future updates!

Gold Price Trend Analysis and Trading Guidance (Exclusive)📣📣📣A technical analysis of gold's recent performance reveals that it has formed a four-day winning streak, demonstrating the strength of the upward trend and indicating that short-term upside potential has not yet been exhausted. Of note, the upper Bollinger Band at 3430 on the daily chart is acting as a key resistance level, and this level is likely to be tested this week. However, when it comes to a sharp rise in the market, there is no clear signal at present. We need to wait for the opening pattern of the daily Bollinger band to be confirmed before we can open up a new round of upward space.🧐🧐🧐🤔🤔🤔
Switching to the H4 cycle for observation, the unilateral upward trend continues to consolidate, the moving average system shows a perfect upward divergent arrangement, the Bollinger Bands simultaneously maintain an open state, and a short-term high pressure is formed near the upper rail of 3415. Based on this, the bullish logic for gold remains unchanged on Wednesday, with the intraday high range likely to be between 3415 and 3430. There's no need to overestimate whether the price will break through previous highs at this point, and trading strategies should be adjusted dynamically based on real-time market performance. From a short-term perspective, intraday support should focus on two key levels: 3360 and 3350.
👊👊👊On the operational level, it is recommended to adopt a strategy of placing long orders in batches when the price falls back to the 3365-3360 range, relying on the support level to seize the opportunity of trend continuation.⭐️⭐️⭐️
⚠️⚠️⚠️The market is risky, so participate rationally. If you need real-time trading references and trading advice, please leave a message to Charlie.🛫🛫🛫 FOREXCOM:XAUUSD VELOCITY:GOLD PEPPERSTONE:XAUUSD CMCMARKETS:GOLD ICMARKETS:XAUUSD CMCMARKETS:GOLD FXOPEN:XAUUSD
The bullish outlook remains unchanged, go long with the trend!Yesterday, the gold bulls refreshed the high point, and the daily line closed in the form of a medium-sized Yang line with a long lower shadow. The idea of continuing to be bullish in the short term remains unchanged, and what needs to be paid attention to is the strength of the retracement, which is similar to yesterday. The current support below is maintained at the 3355-3350 line of yesterday's rise. This position is also today's key support level, and the key suppression point above is maintained at the integer level of 3390-3400. This position may not be the end point. It was also mentioned yesterday that under the range of the previous large range of fluctuations, if either side does not break through, it will likely continue to fall into fluctuations. The current bullish trend is still relatively obvious, so we still maintain the idea of low-long operations. If your current operation is not ideal, I hope I can help your investment avoid detours. Welcome to communicate!
From the 4-hour analysis, the important support below is the 3355-3350 line. If the daily level stabilizes above this position, the bullish rhythm of falling back to lows and buying on the trend will remain unchanged. Before the daily level falls below the 3350 mark, you need to be cautious about shorting against the trend. I will provide you with the specific operation strategies at the bottom, please pay attention to them in time.
Gold operation strategy: Go long on gold when it retraces to around 3360-3350, target 3375-3385 area, and continue to hold if it breaks through.

The market trend is still there, go long on the pullback#XAUUSD
Yesterday, gold experienced a V-shaped reversal: it was blocked at the 3382 line in the morning and then fluctuated and fell, then it fell to the support near 3349 and stabilized and rebounded, then rebounded to near 3390 in the evening and closed with a doji on the daily line. Judging from the overall trend, the bullish pattern has not changed.
Gold has limited room for decline in the short term, and a sharp drop is unlikely. Today's market tends to adjust and correct first before continuing to rise. The adjustment is only short-term, and is more to give everyone enough opportunities to get on board. The focus of the market below is 3375-3360, with the target looking at yesterday's high around 3390-3395. A break is expected to extend to the 3400-3420 area.
🚀 BUY 3375-3360
🚀 TP 3390-3395

Gold: Yesterday’s Surge & Today’s Session StrategyDuring yesterday’s U.S. trading session, gold surged to around 3390 🚀, driven by a series of tariff-related remarks from Trump, Fed personnel changes, and market expectations that the probability of a September rate cut has risen to 91% ⚡️. We successfully took profit near 3355 yesterday, locking in close to maximum gains 💰.
Today’s trading strategy:
Go short at highs during the Asian session 📉
Go long at lows during the European session 📈
Go short at highs again during the U.S. session 📉
⚡️⚡️⚡️ XAUUSD ⚡️⚡️⚡️
🚀 Sell@ 3390 - 3380
🚀 TP 3375 - 3366 - 3356
Daily updates bring you precise trading signals 📊 When you hit a snag in trading, these signals stand as your trustworthy compass 🧭 Don’t hesitate to take a look—sincerely hoping they’ll be a huge help to you 🌟 👇
Correction first and then rise during the day, TP3400Yesterday, gold hit the bottom near 3350 and then quickly rose to break the high. It fell back slightly in the evening and closed with volatility. The daily line closed with a long lower shadow bullish line. The short-term correction process has been completed, and there is still momentum for an upward impact. The overall structure is still a bullish trend. Focus on 3365-3355 below. As long as the bullish thinking above this level remains unchanged, any decline will provide an opportunity to enter the market. The target can be around yesterday's high of 3390. Once it breaks through 3390, the gold price is expected to reach 3405-3415.
OANDA:XAUUSD

8/6: Watch for a Potential Double Top FormationGood morning, everyone!
Yesterday, gold experienced its first significant supply pressure around the 3386 level, but with support near 3350—helped by positive data—prices rebounded and climbed back toward 3390, resulting in solid overall gains.
From the 1-day chart (1D) perspective, the technical structure remains bullish, with MA20 providing firm support. Although short-term moving averages are currently converging, the overall bias remains towards a bullish divergence, suggesting further upside potential. There's a possibility for price to test the 3400–3420 zone in today’s session.
That said, the 3386–3398 region may still pose minor selling pressure, although it is not expected to be particularly strong. Key intraday support is seen in the 3378/3372–3362 range. If the market encounters another wave of heavy selling that damages the daily bullish setup, then the 3343–3348 area will become a critical battleground between bulls and bears.
📌 Trading Strategy for Today:
Maintain a sell-on-strength approach, especially if prices approach the 3418–3438 resistance area, where short opportunities become more attractive;
If a pullback occurs, monitor the aforementioned support zones for potential buy-on-dip opportunities, contingent on stability.
⚠️ Market Risk Reminder:
There will be key economic speeches during the US session, which could trigger heightened volatility. Ensure proper risk management and stop-loss settings are in place.

XAUUSD The beginning of large-scale growthCurrent picture and structure
The instrument is trading in a narrow range of $3,360-3,375, demonstrating low volatility - ADX is at the low of 2025, which confirms consolidation
The price is held inside a long-term ascending channel, with an increase of about 27% since the beginning of 2024
Indicators and signals
RSI (14): around 58-59, indicates moderate overbought, but remains in the bullish momentum zone
Stochastic (%K ~61%) and MACD (value ~3.8): Buy signals - short-term upward momentum is confirmed
ADX (14): around 23-24 - range, weak trend without a clear direction
Moving averages on different timeframes give a common signal indicator "Strong Buy" in daily and weekly frames
Support and resistance levels
Key support:
$3,360 — current lower stop range
$3,330–3,293 — swing low zone, critical for short-term sales
Main resistance:
$3,400–3,415 — profit acceptance zone and possible reversal pressure
$3,450 — psychological and technical barrier upon breakout of current zone
GOLD: Bullish Shift ConfirmedBullish BOS, price is trading above 3360. Clean bullish choch formed creating a new HH. Look to buy...
(H4)
✅ New HL formed around 3280 and we now have a break above $3355 and $3360 = BOS confirmed.
🟢 Key Zone: 3322–3337
(H1)
✅ BOS above 3360 confirms bullish bias
✅ Key Zone: 3322–3337 (Use this zone to set a limit or watch for confirmation)
Retracement expected before continuation.
(M15)
👀 What to Watch:
If price opens lower and taps into 3330s, monitor for:
✅ Sweep of intraday lows
✅ M15 bullish BOS above 3348–3350
🔁 Entry on retest of new demand zone after BOS
❌ Invalidation: Break and close below 3305
Other Scenario: No Pullback — Buy Breakout Instead
If price opens strong and continues up from the 3360s, wait for:
✅ Bullish Break of Structure (BOS) Above: 3385
This is your confirmation level that buyers are still in control

The best ambush point for short positions below gold 3400.The daily structure of gold still maintains a bullish dominant pattern. The upper target is the upper Bollinger band of 3400. If it breaks through this position, the upside space will be further opened up. The 4-hour Bollinger band is gradually closing, and the price is fluctuating in the range of 3400-3360. In the short term, it is still treated with range thinking. Before an effective breakthrough, the operation can adopt a high-altitude and low-long strategy. Gold is currently at a critical node of change. If it rises and falls in the evening, it may release a temporary peak signal. The area below 3400 is expected to become an opportunity for the layout of medium-term short positions. The overall recommendation is to remain cautious, respond flexibly to changes in rhythm, and strictly control risks.
Gold operation suggestion: You can continue to try short selling in the 3390-3400 range, with the target at 3380-3370.

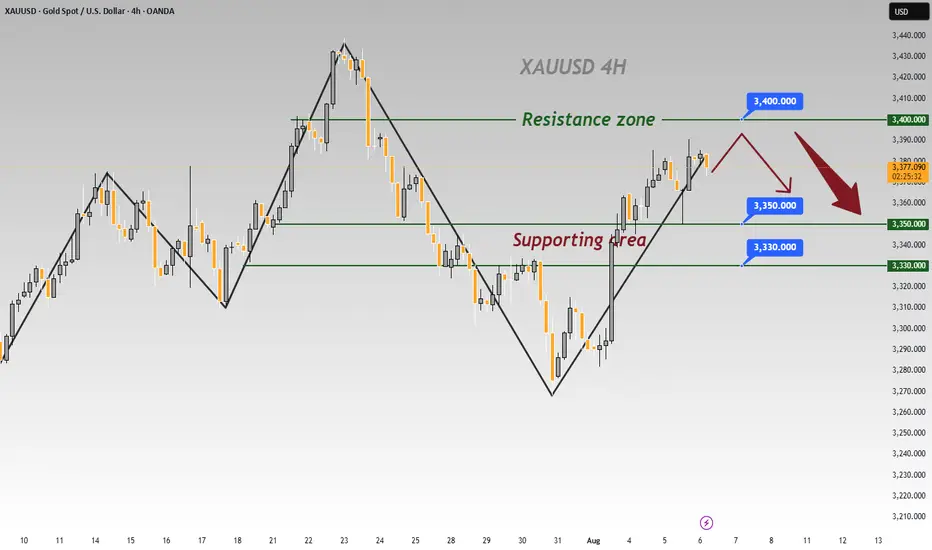
8/7: Continue to Focus on SellingGood afternoon, everyone!
During today’s session, gold successfully moved into the anticipated resistance zone of 3386–3398, and encountered significant selling pressure near 3398, resulting in a retracement to around 3372. While the price action aligned with prior expectations, the delayed timing has led to a bearish shift in the technical structure, which may hinder further upside momentum for the bulls.
That said, important economic data will be released during the US session later today. We’ll need to observe whether bulls can leverage the potential catalyst to break through the current resistance levels.
⚠️ Trading Strategy Recommendation:
Regardless of the data outcome, it is advisable to maintain a bearish bias in subsequent trades.
From a technical standpoint, the higher the price climbs, the greater the probability of a pullback, making short positions relatively less risky.
📌 Reference Range:
Continue to monitor and trade within the key zones outlined yesterday, adjusting entries and exits as per intraday developments.

XAUUSD - 3400Technical picture
Bullish momentum is strengthening: US jobs shortage has caused an influx into safe havens, which has contributed to gold's growth
A reversal signal is forming: a bounce from the lower line of Bollinger Bands is observed, and a bullish cross of EMA-8 and EMA-21 is also forming, plus a moderately positive MACD - a classic "buy on dip" entry pattern
Key levels:
Support: around $3,330 - a support zone coinciding with the 21- and 50-day SMAs. Below — potential for decline to $3,297-$3,283
Resistance: $3,380 — resistance, breakout of which could open the way to $3,440-$3,450
Structural pattern: breakout from triangle to the downside could signal a deeper correction
Industry consensus: Citi has revised its target range up to $3,300-$3,600 in the next three months, based on a weak US economy and rising geo-risk
Meanwhile, HSBC warns of possible weakness — forecast for 2025-2026 from $3,215 to $2,350 in a more bearish scenario
