Gold (XAU/USD) Technical Outlook: July 17, 2025🔷 Market Context and Current Price
As of July 17, 2025, gold (XAU/USD) is trading near $3,341, slightly above the week’s midpoint. The metal remains range-bound but shows signs of bullish resilience as it tests key structural support zones. Today’s analysis integrates advanced technical methodologies — including Price Action, Fibonacci tools, ICT and Smart Money Concepts — to present a clear directional bias and actionable trade ideas.
📊 4‑Hour Chart Analysis
1️⃣ Price Structure & Trend
Gold has maintained a sideways-to-upward bias, consolidating between $3,320 (support base) and $3,377 (range resistance). Higher lows since early July reinforce the short-term bullish narrative, though price remains capped by supply in the upper 3,370s.
No decisive Break of Structure (BOS) has yet occurred, keeping price within this range. However, minor bullish BOS signals have appeared near $3,332–$3,334, with a confirmed Change of Character (CHOCH) around $3,320–$3,324, as buyers repeatedly defended this level.
2️⃣ Smart Money Concepts & ICT Insights
Demand Zone / Order Block (OB): $3,332–$3,334. This zone aligns with a recent fair value gap and bullish order block.
Supply Zone / OB: $3,355–$3,359, corresponding to prior inefficiencies and institutional selling.
Liquidity Levels: Sell-side liquidity was swept near $3,320 earlier this week, suggesting smart money accumulation below prior lows.
Fair Value Gap (Imbalance): Present at $3,332–$3,333, partially filled and offering a strong risk-reward for long setups.
3️⃣ Fibonacci Levels
Using the recent swing low ($3,320) and swing high ($3,377), Fibonacci retracements show:
38.2%: ~$3,342 — currently being tested.
50%: ~$3,348 — an interim bullish target.
Fibonacci extensions project potential upside toward $3,401 if momentum strengthens beyond the range top.
4️⃣ Key Levels Summary (4H)
Zone Level
Demand / Buy Zone $3,332–$3,334
Structural Support $3,320
Interim Pivot $3,340–$3,342
Supply / Sell Zone $3,355–$3,359
Range Ceiling $3,375–$3,377
🔷 Directional Bias and Strategy
The 4-hour structure remains neutral-to-bullish, favoring upside so long as the $3,332–$3,334 demand zone holds. A confirmed BOS above $3,342–$3,344 could accelerate bullish momentum toward $3,355–$3,360 and even $3,375. Conversely, a breakdown below $3,332 risks revisiting $3,320 and potentially $3,300.
⏳ 1‑Hour Chart – Intraday Trade Setups
The 1-hour timeframe reveals tactical opportunities aligned with the broader bias:
Setup Direction Entry Stop Loss Take Profit
Setup A – Smart Money Long Long $3,334 $3,329 $3,348 / $3,355
Setup B – Breakout Long Long $3,344 (after breakout) $3,340 $3,355 / $3,375
Setup C – Range Short Short $3,355–$3,359 $3,362 $3,340 / $3,332
🏆 The Golden Setup
Setup A – Smart Money Long offers the highest statistical edge:
Entry: $3,334 (at demand OB / FVG)
Stop Loss: $3,329 (below structure)
Take Profits:
TP1: $3,348 (pivot)
TP2: $3,355 (supply zone)
R:R Ratio: ~2.8:1
This setup benefits from multi-timeframe confluences: demand zone, fair value gap, bullish CHOCH, and proximity to BOS, making it a high‑conviction trade.
🔷 External Consensus Check
An alignment scan of professional analyst views shows strong consensus:
Buy interest remains concentrated around $3,332–$3,335.
Profit-taking and caution advised as price approaches $3,355–$3,377.
No notable divergence in professional outlook — most remain cautiously bullish above $3,332.
📜 Summary Report
✅ Bias: Neutral-to-bullish above $3,332; downside risk below.
✅ Key Levels: $3,332–$3,334 (buy zone), $3,355–$3,359 (sell zone), $3,375–$3,377 (range ceiling).
✅ Top Trade: Long from $3,334 with stops under $3,329 and targets at $3,348/$3,355.
✅ Alternate Trades: Breakout long above $3,344 or short from supply near $3,355.
✅ Confidence Zones: Buyers dominate above $3,332; sellers reappear above $3,355.
Conclusion
Gold remains in a well‑defined range, with smart money likely accumulating near the lower boundary at $3,332. With structural supports intact and demand zones respected, the path of least resistance favors cautious upside toward $3,355 and possibly $3,375. Intraday traders are advised to focus on precise execution within the outlined confidence zones, maintaining discipline around stops and targets.
The current market structure rewards patience and alignment with institutional footprints — positioning ahead of breakout confirmation, while respecting range extremes.
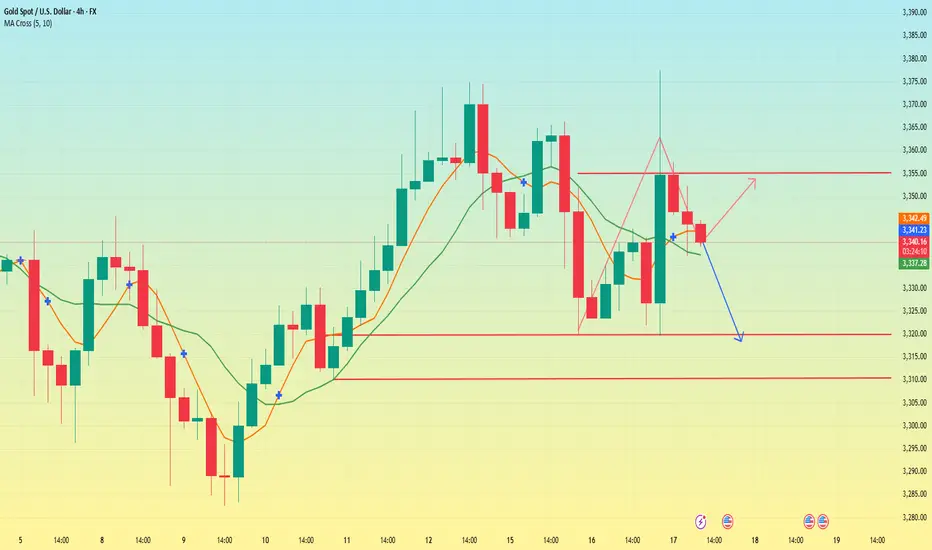
Xauusdsignal

TACO trading reappears. Gold is down.The news that Trump intends to fire Powell caused a decline in US stocks and bonds, and gold prices soared in response. But then Trump denied the news, and the market subsequently fell back to stabilize.
On Wednesday, the Asian market began to fluctuate and rise in the early trading. It rose to a high of 3343 in the European market and then fell to 3319 in the US market. Then it rose sharply due to the news. It rose to a high of 3377 and then fell to 3336. It fluctuated around 3350 in the late trading. The daily line closed with a positive line with an upper shadow line.
The recent market trend fluctuated violently. Since last Wednesday, there have been three consecutive positive rises. This week, there have been two consecutive negative declines on Monday and Tuesday. On Wednesday, it closed positive after washing up and down. At present, the MA5 and 10-day moving averages have formed a golden cross, but the direction is unclear. The Asian market opened above the moving average on Thursday. The overall pattern needs to pay attention to the breakthrough of the key points of long and short positions.
Today, the focus below is on the support near the low point of 3320, followed by the support near 3315 and 3310. This position is the trend line support formed by the previous low point connection. If it breaks down, we need to pay attention to the position of 3280. The upper resistance level is mainly concerned with the resistance near 3355, which is the rebound high point after the US market hit 3377.
Today, the operation needs to adjust the strategy according to the breakthrough of key points. In the volatile market, we need to be vigilant about the sudden fluctuations caused by the news. After breaking the key support or resistance, the trend direction may be further clarified.
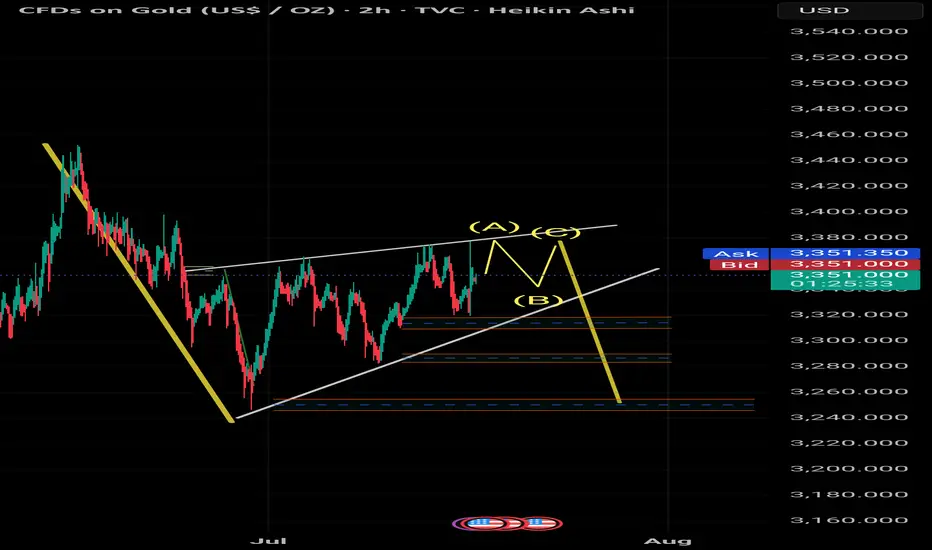
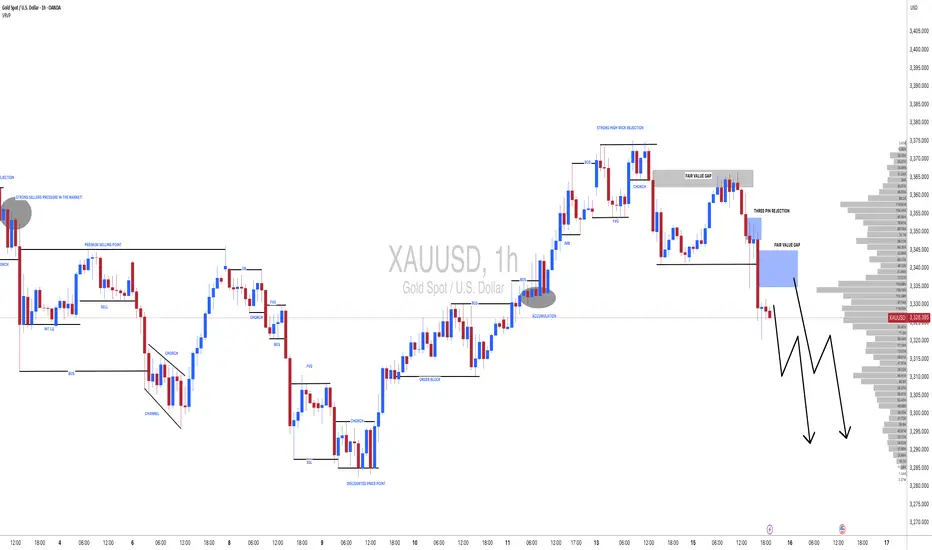
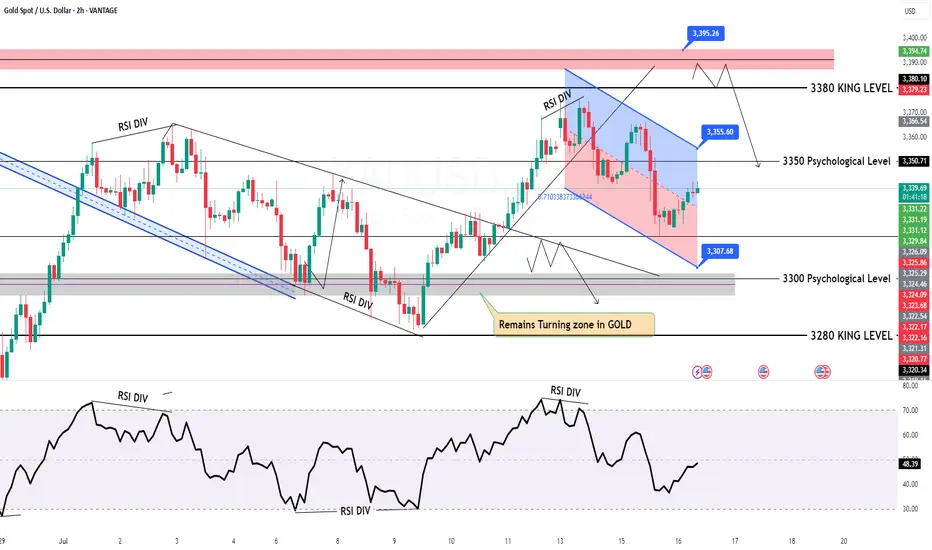
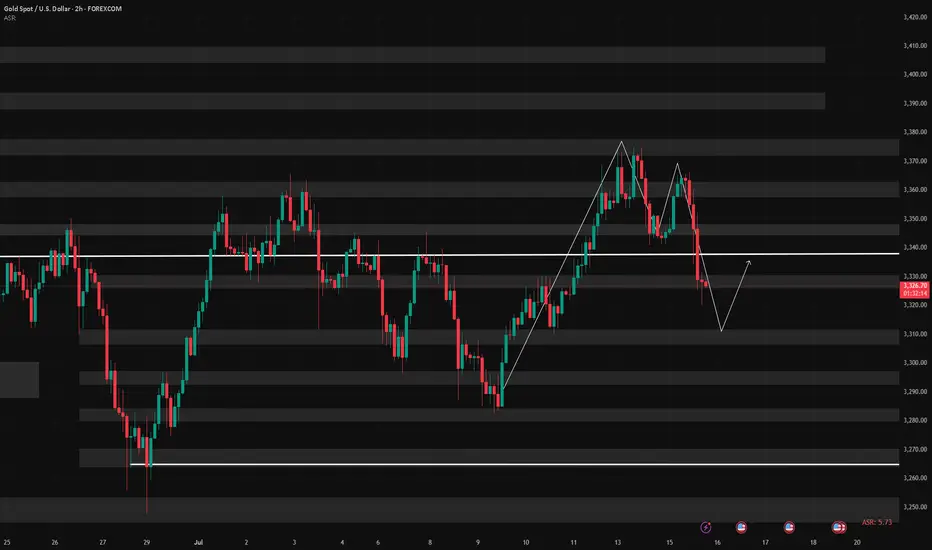
GOLD 2H STRUCTURE ROADMAP – JULY 2025🧭 GOLD 2H STRUCTURE ROADMAP – JULY 2025
📉 Market Structure | 📊 Liquidity Zones | 🎯 Bearish Scenario
---
📌 🧱 Structure Analysis – Bigger Picture
The current macro structure on Gold is clearly bearish, confirmed by:
A sequence of Lower Highs (LH) and Lower Lows (LL)
Price respecting a descending channel / wedge structure
Failure to hold above key break-of-structure (BOS) zones on prior rallies
Recent rallies forming corrective patterns, not impulsive bullish structure
This indicates that smart money is distributing at higher levels and planning liquidity raids before final markdowns.
---
🔁 Wedge + ABC Trap Formation
The chart shows a classic bearish wedge (rising contraction pattern) with an embedded ABC correction, which can trap long-biased retail traders before reversal.
Wave (A): Short-term rejection at previous minor high
Wave (B): Shallow pullback to create illusion of strength
Wave (C): Final liquidity sweep above the wedge → Perfect trap zone
---
💧 Triple Liquidity Targets – Smart Money Blueprint
Smart money often targets liquidity in layers. Below are the three major zones:
1. 🔻 First Liquidity Pool (~$3,320 – $3,310):
Minor internal structure lows with previous BOS area
2. 🔻 Second Pool (~$3,285 – $3,275):
Strong liquidity cluster near order block formed after impulsive move
3. 🔻 Final Demand Zone (~$3,245 – $3,260):
Deep liquidity + unmitigated bullish OB = High Probability Reaction Zone
---
⚔️ Bias & Trading Insight
✅ Bias: Bearish unless price closes above $3,400 with strength
🚫 Avoid chasing longs during (B)-(C) unless clear breakout + volume
🧠 Patience pays — Wait for sweep of all three zones before any long-term bullish commitment
---
> 🧠 Precision Analysis by: Mohsen Mozafarinezhad
👑 Presented under: PERSIAUX KING — A Legacy of Persian Discipline in Markets
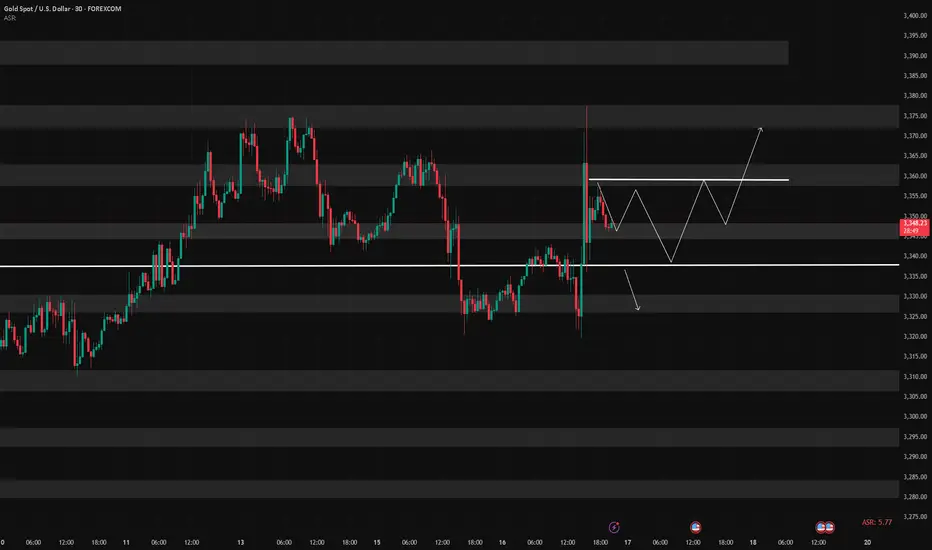
7/17: Key Support for Gold Bulls at 3343–3337During the Asian session today, gold rose as expected into the 3337–3343 resistance zone. After failing to break through, the price retraced during the European and U.S. sessions, reaching the 3323–3313 support area. A sharp rally followed due to unexpected news, pushing the price into the 3372–3378 resistance zone. Overall, the intraday bullish strategy performed well, yielding solid profits.
After this sharp volatility, price movement has stabilized somewhat. The MA60 support on the daily chart remains intact.
For tomorrow’s trading, key levels to watch are:
🔽 Support: 3343–3337, with secondary support at 3328–3323
🔼 Resistance: 3372–3378
On the 2-hour chart, bullish momentum appears likely to continue as long as price holds above the support zone.
Additionally, upcoming economic data releases and any further developments on the report regarding Trump potentially firing Powell could have a significant impact on market sentiment—these factors should be closely monitored.
In summary, tomorrow’s initial trading focus can remain within the 3337–3358 range, with strategies adjusted as market conditions evolve.
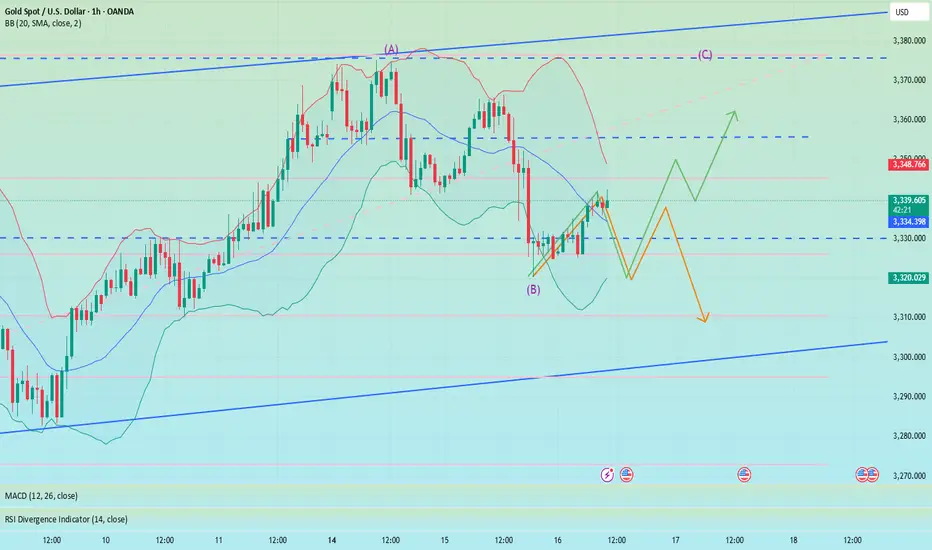
Falling correction, shorting in European session📰 News information:
1. Beige Book of Federal Reserve's economic situation
2. European and American tariff trade negotiations
📈 Technical Analysis:
Currently, gold continues to consolidate around 3340, and the daily MACD indicator is stuck to the zero axis. Two consecutive days of negative bars also indicate that the overall trend of gold is weak and volatile. The hourly Bollinger Bands are closing, with the upper band located near 3352. The corresponding positions of the upper pressure middle band and SMA60 are basically at 3335-3350, but it is expected to gradually decline over time. On the whole, there are no particularly clear trading signals at present. Both bulls and bears have certain opportunities. It is recommended to wait and see for the time being. Pay attention to the 3342-3352 area above. If the bearish trend is confirmed in the future, you can consider shorting when it rebounds here, with the target at 3330-3325. If gold retreats directly to 3325-3320 and gains effective support again, you can consider going long.
🎯 Trading Points:
SELL 3342-3352
TP 3330-3325
BUY 3325-3320
TP 3340-3350
In addition to investment, life also includes poetry, distant places, and Allen. Facing the market is actually facing yourself, correcting your shortcomings, facing your mistakes, and exercising strict self-discipline. I share free trading strategies and analysis ideas every day for reference by brothers. I hope my analysis can help you.
FXOPEN:XAUUSD TVC:GOLD FX:XAUUSD FOREXCOM:XAUUSD PEPPERSTONE:XAUUSD OANDA:XAUUSD
#XAUUSD(GOLD): Strong Sellers Hold, Further Drop Incoming! God dropped from our area of entry yesterday as we initially expected. However, since the massive drop, we are now seeing some short-term correction in the prices. In the coming time, we can expect further price drops around 3280 or 3250.
If you like our idea, please like and comment.
Team Setupsfx_
Gold: Bull-Bear Swings & Today's Trade Tips + AnalysisAnalysis of Gold News Drivers:
During the U.S. session on Wednesday (July 16th), spot gold surged sharply and is currently trading around 3,370 🚀. Trump stated that tariff letters will soon be sent to small countries, with rates likely slightly above 10%, providing safe-haven support for gold prices 🛡️.
Gold prices fell 0.5% on Tuesday, closing at 3,324.68, barely holding above the 55-day moving average of 3,222 📉. Earlier, the U.S. June CPI increase hit its highest level since January, pushing the U.S. dollar index to a nearly three-week high, while U.S. Treasury yields also climbed to a six-week peak, pressuring gold prices ⚖️. The dollar index has risen for four consecutive trading days, hitting a high of 98.70 on Tuesday, the highest since June 23rd 🆙. A stronger dollar makes dollar-denominated gold more expensive for investors holding other currencies, thereby weighing on gold prices 💸.
However, the market largely interprets the dollar's recent rally as a technical adjustment rather than a reversal of the long-term trend 🔄. Despite short-term pullbacks in gold prices, market sentiment has not fully turned pessimistic 😐. While gold is currently in a consolidation range since mid-May, uncertainties surrounding tariff policies may offer support 🔀. Overall, the long-term outlook for gold remains optimistic, with sustained market focus on tariff issues expected to drive a rebound in gold prices in the future 📈
Accurate signals are updated every day 📈 If you encounter any problems during trading, these signals can serve as your reliable guide 🧭 Feel free to refer to them! I sincerely hope they'll be of great help to you 🌟 👇
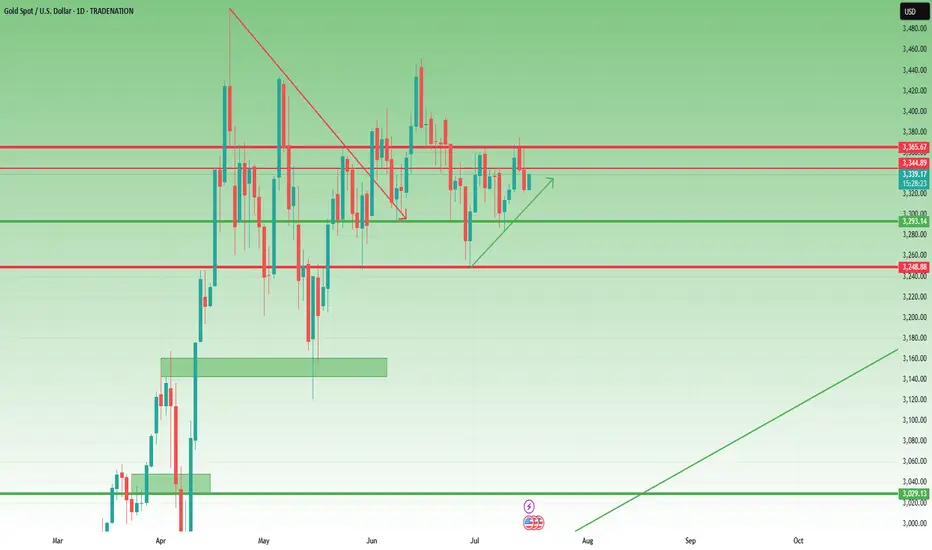
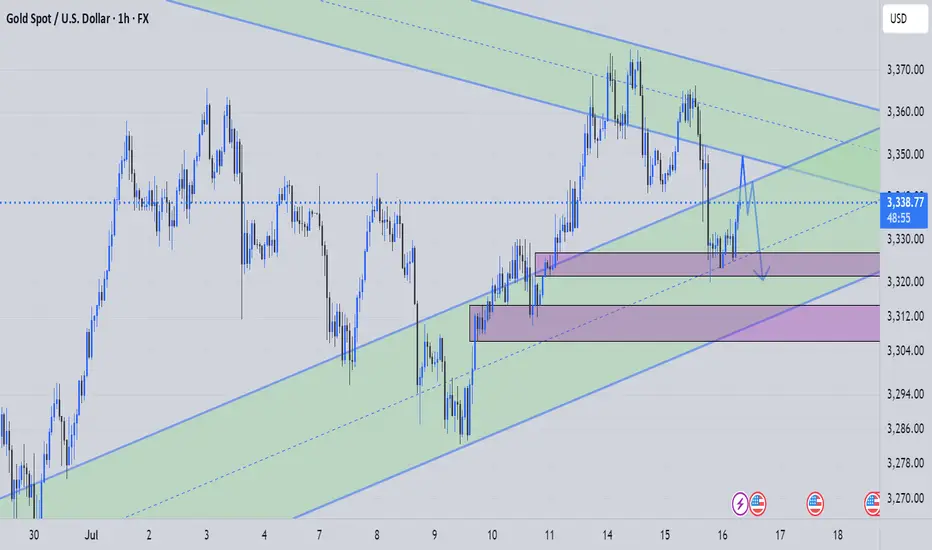
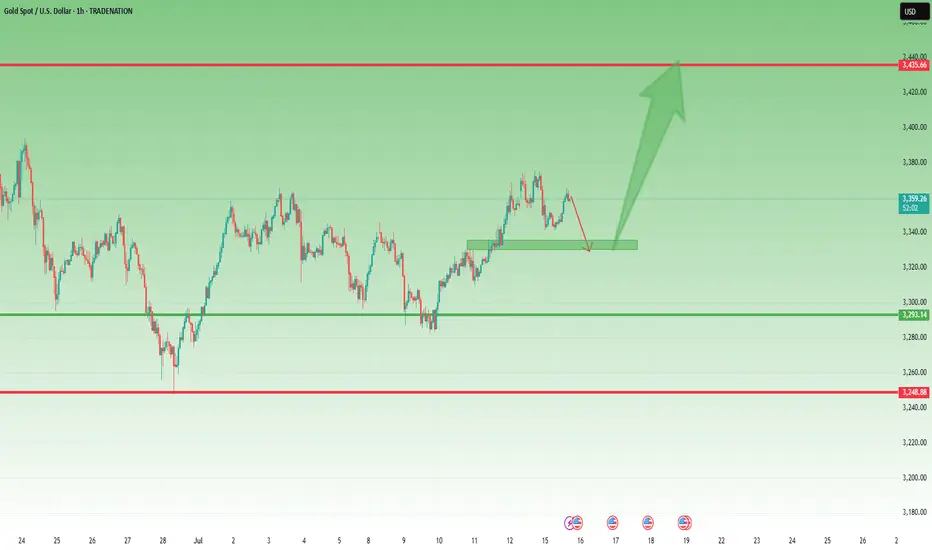
Gold – Bullish Structure Still Intact, but Bears are Knocking📉 What happened yesterday?
As expected, XAUUSD made another leg down, breaking even below my buy zone (3330–3335) and hitting a low at 3320. From there, we’re now seeing a modest rebound, with gold trading around 3333 at the time of writing.
📌 Current position:
I'm currently holding a long position. It hovers around break-even – fluctuating between small gains and small losses. Nothing solid yet.
❓ Key question:
Was this just a deep pullback within a bullish structure… or the beginning of a deeper trend reversal?
🔍 Why bulls still have a case:
• Price prints higher lows – bullish structure technically remains intact
• A clean break above 3350 would show short-term strength
• A confirmed break above 3375 would activate a bullish ascending triangle → targeting the 3450 zone
⚠️ But here's the concern:
• Yesterday’s dip to 3330 happened during the New York session (strong volume)
• The bounce from 3320 has been weak, with no follow-through
• Daily candle closed near the lows, showing a long upper wick → a classic bearish signal
• The confluence support now lies at 3310–3320. A red daily candle closing in this area could mean the medium-term trend is flipping
🎯 My trading plan:
Although I'm still holding my buy, if bulls don’t recover 3350 quickly, I will consider closing early. The break of 3310 would shift my bias bearish.
________________________________________
📌 Conclusion:
We’re in a critical zone. The bullish structure isn’t broken yet, but yesterday’s action was not encouraging. If buyers fail to reclaim control soon, the market may be preparing for a deeper correction. Stay sharp. 🚀
Disclosure: I am part of TradeNation's Influencer program and receive a monthly fee for using their TradingView charts in my analyses and educational articles.
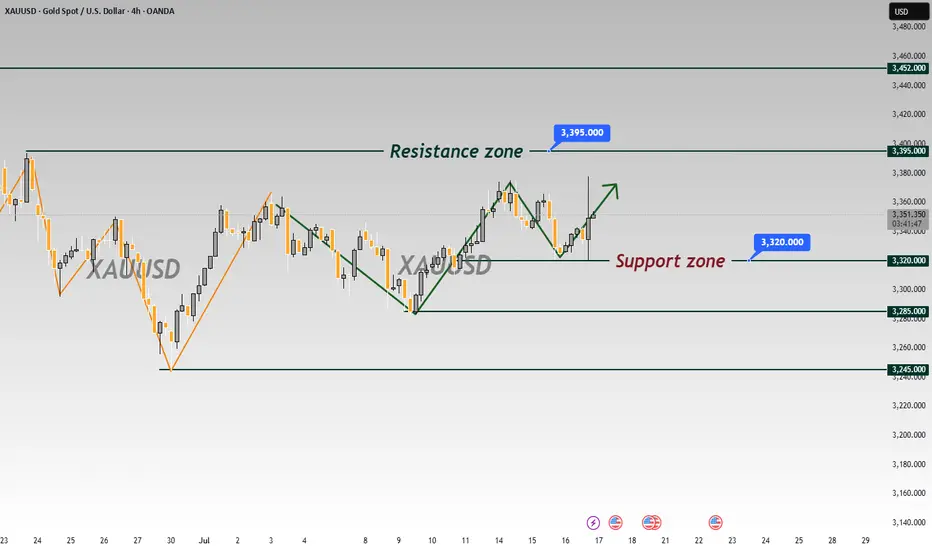
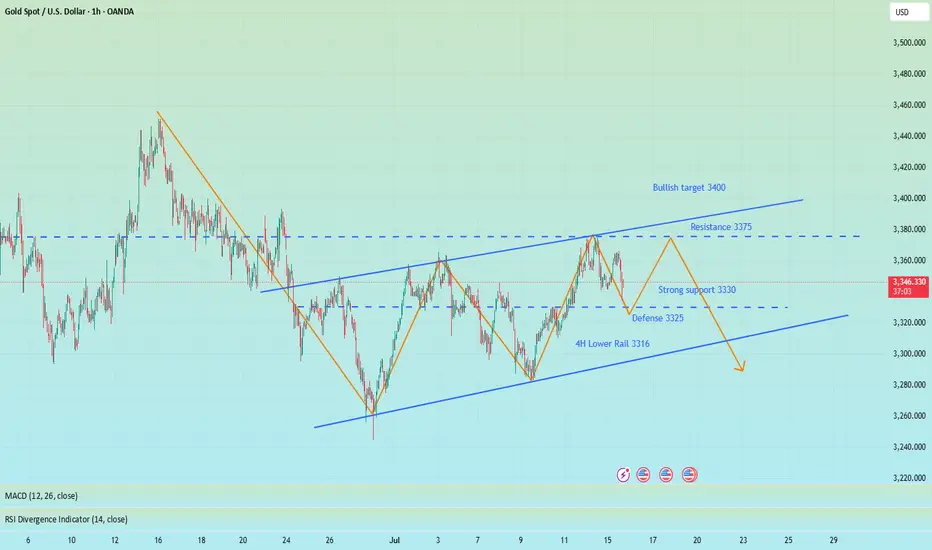
Gold Roadmap: Next Stop $3,325 After Ascending Channel Break?Gold ( OANDA:XAUUSD ) failed to touch the Potential Reversal Zone(PRZ) in the previous idea , and I took the position at $3,351 = Risk-free.
Gold is moving in the Resistance zone($3,366-$3,394) and has managed to break the lower line of the ascending channel .
In terms of Elliott Wave theory , with the break of the lower line of the ascending channel, it seems that gold has completed the Zigzag correction(ABC/5-3-5) .
I expect Gold to trend downward in the coming hours and succeed in breaking the Support zone($3,350-$3,325) and attacking the Support line again , and probably succeeding in breaking this line this time.
Note: Stop Loss (SL) = $3,396
Gold Analyze (XAUUSD), 1-hour time frame.
Be sure to follow the updated ideas.
Do not forget to put a Stop loss for your positions (For every position you want to open).
Please follow your strategy; this is just my idea, and I will gladly see your ideas in this post.
Please do not forget the ✅ ' like ' ✅ button 🙏😊 & Share it with your friends; thanks, and Trade safe.

Gold Spot Price (USD) - 4-Hour Chart (OANDA)4-hour performance of the Gold Spot price against the U.S. Dollar (OANDA). The current price is $3,223.660, reflecting a 1.3% decrease. Key levels include a resistance zone around $3,360.405 and a support zone near $3,294.070, with recent price action showing a potential breakout or reversal within these ranges.

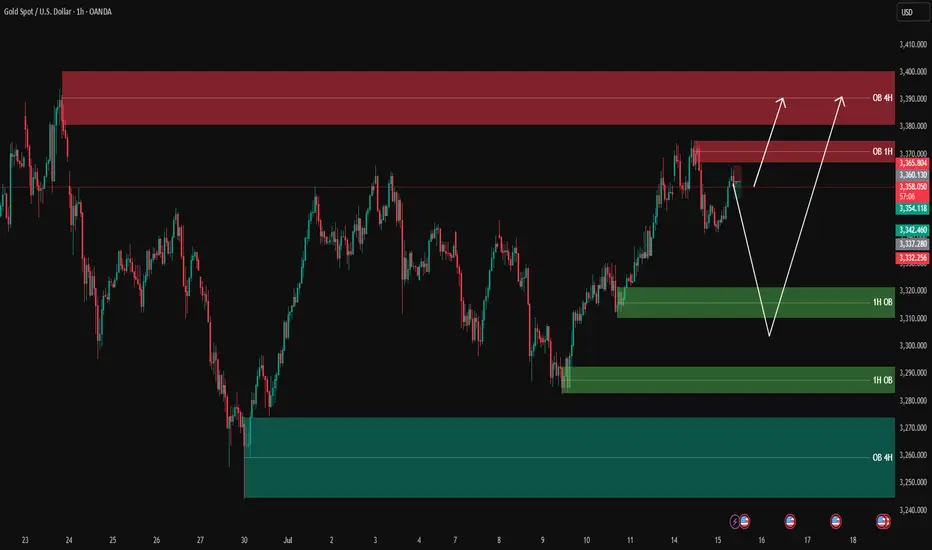
XAUUSD analysis - 1H FVG and OB Setups✅ Green boxes = Buy Order Blocks (OB)
✅ Red boxes = Sell Order Blocks (OB)
✅ Blue boxes = Fair Value Gaps (FVG) (none currently on this chart)
Currently, gold is approaching the 1H Sell OB (red) between 3360 – 3370, which is a strong resistance zone.
We have two clear scenarios:
1️⃣ If sellers step in and we get confirmation, we can look for a pullback down to the lower green buy OB zones:
3320 – 3330 (1H OB)
3290 – 3300 (1H OB)
These zones will be key for looking for buy opportunities with LTF confirmations.
2️⃣ If buyers break above 3370 with a strong close, we can expect a move towards the 4H Sell OB (red) at 3380 – 3395.
🎯 Summary:
✅ Currently looking for a potential sell at the red zone with LTF confirmations.
✅ Watching green zones below for clean buys on a pullback.
✅ If price breaks above, the next target will be 3380 – 3395.
Let price come to your levels, wait for confirmation on 3m/5m for clean entries, and stay disciplined with your plan.
—
📊 ProfitaminFX | Gold, BTC & EUR/USD
📚 Daily setups & educational trades
GOLD Intraday Chart Update For 16 July 2025Hello Traders,
Today we have major news is US PPI, currently market is in tight range between 3360 to 3310
all eyes on 3360 level breakout for the day for further upward continuation
Only break below 3315 market will goes further downside
Currently we also have Bearish channel in H2 TF
Disclaimer: Forex is Risky
Gold XAU/USD Analysis for July 15, 2025: Trading Strategy and KeThe market is showing a strong upward trend, as indicated by the yellow trendline.
Fibonacci Retracement Levels:
38.2% Fibonacci Level: 3,344.79
50% Fibonacci Level: 3,344.47
61.8% Fibonacci Level: 3,347.91
Resistance Zone: The price is approaching a strong resistance level at 3,370 USD.
Technical Observations:
Gold is currently moving upward but is encountering resistance at 3,361. The price tested the 61.8% Fibonacci level and is now facing some resistance.
The Fibonacci levels suggest that if the price breaks above 3,362, the next target could be 3,370 USD.
Support Zone: If the price retraces, support may emerge near the 3,340 region.
Gold XAU/USD Trading Strategy:
Bullish Scenario:
If the price breaks above resistance at 3,362, the next target would be the 3,370 level. This could be a signal to enter Long positions near the 3,344 to 3,348 range, with a target around 3,370.
Bearish Scenario:
A retracement to the support level at 3,340 is possible. If the price drops below 3,340, further downside could be expected. In this case, a Short position could be considered if the price falls below 3,340, with a target near 3,330.
With the current upward trend, gold XAU/USD may continue to rise if it breaks the 3,362 resistance level, with the next target being 3,370 USD. However, if the price turns lower and drops below the 3,340 support level, the market may continue to decline.
Note: Be sure to monitor the Fibonacci levels and price behavior closely to adjust your trading strategy accordingly for today. If this analysis was helpful, don't forget to save it and follow for more trading strategies!

Public short selling profit, NY short-term multiple layoutInterest rate futures data showed that the results were in line with our previous expectations, with a lower rate cut this month and a higher probability of a 25 basis point cut in September. In the short term, gold may first take profits and then rebound. NY session trading has just begun. Bros can pay attention to the 3335-3330 area below. If it falls back and stabilizes, you can consider participating in long positions, defending 3325 and targeting 3355-3365.
OANDA:XAUUSD

xauusd setup"🌟 Welcome to Golden Candle! 🌟
We're a team of 📈 passionate traders 📉 who love sharing our 🔍 technical analysis insights 🔎 with the TradingView community. 🌎
Our goal is to provide 💡 valuable perspectives 💡 on market trends and patterns, but 🚫 please note that our analyses are not intended as buy or sell recommendations. 🚫
Instead, they reflect our own 💭 personal attitudes and thoughts. 💭
Follow along and 📚 learn 📚 from our analyses! 📊💡"
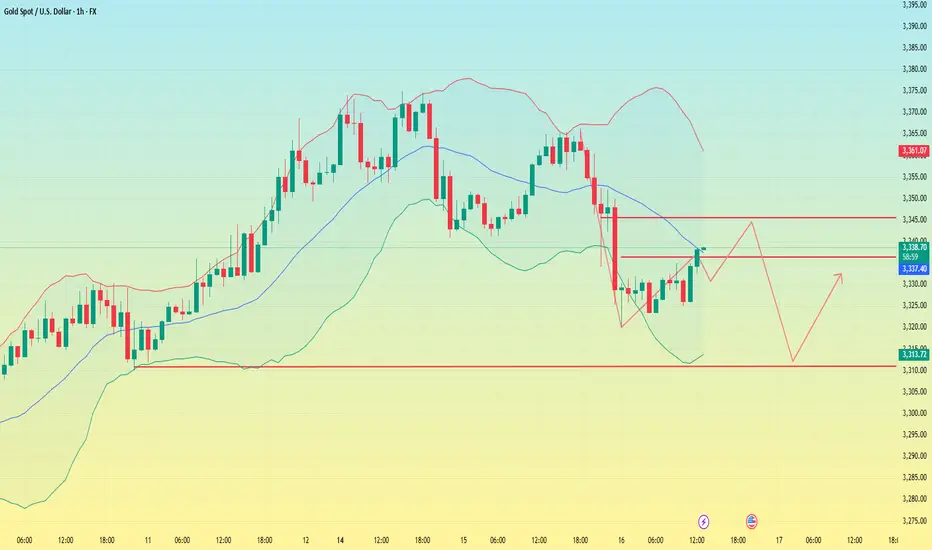
Gold fluctuates downward. Can it break through?The CPI data released is in line with expectations, the tariff storm is still continuing, inflation rebounds and the Fed's expectations of interest rate cuts have cooled. Gold rebounded to 3366 and then fell, and is currently fluctuating around 3330.
From the current trend, gold fell strongly and broke through the Bollinger middle rail and the moving average support. The daily line focuses on the Bollinger middle rail under pressure near 3340, and the short-term support is at 3310. At present, a staged top pattern has been formed and the K-line double top is around 3366. The Bollinger moves downward and the price is in a downward channel.
For short-term operations, Quaid believes that the strategy of rebound shorting can still be followed.
Short near 3345, stop loss 3355, profit range 3330-3310
Long near 3310, stop loss 3300, profit range 3330-3345
CPI triggers sell-off, 3330 can be short-term long📰 News information:
1. Focus on tomorrow's CPI data
2. Bowman's speech at the Federal Reserve
3. Tariff information outflows and countries' responses to tariff issues
📈 Technical Analysis:
The short-term trend flag pattern has been formed, and our short-selling strategy perfectly hits the TP. According to current news, Trump has once again urged the Federal Reserve to cut interest rates. While there is almost no possibility of a rate cut this month, there is a high probability that a 25 basis point rate cut will be completed in September, which is also in line with our previous prediction of market trends.
The big negative line in 4H pierced the middle Bollinger band. Although the CPI data is bullish, it has little impact based on the announced value. Market expectations have been digested in advance, so there is no room for a big drop. The upper points still focus on the short-term resistance of 3355-3365. If it rebounds to this area first in the short term, you can consider shorting again. Focus on the strong support of 3330 below. As long as the retracement entity does not fall below 3330, gold will rise again and touch the resistance line of 3375-3385.
🎯 Trading Points:
BUY 3335-3325
TP 3355-3365
In addition to investment, life also includes poetry, distant places, and Allen. Facing the market is actually facing yourself, correcting your shortcomings, facing your mistakes, and exercising strict self-discipline. I share free trading strategies and analysis ideas every day for reference by brothers. I hope my analysis can help you.
OANDA:XAUUSD PEPPERSTONE:XAUUSD FOREXCOM:XAUUSD FX:XAUUSD TVC:GOLD FXOPEN:XAUUSD
Gold Pullback in Play – Still Aiming for 3450 📌 In yesterday’s analysis, I argued that bulls likely won the battle and that a new leg up toward 3450 could be next from a swing trade perspective. I also mentioned that buying dips remains the preferred strategy.
And indeed – we got that dip.
📉 Price pulled back to 3340 and bounced,
but it hasn’t yet touched my key area of interest: 3330–3335.
What now?
My view stays the same –I still expect a move toward the 3450 zone,but I also believe a deeper dip toward support is still on the table – likely a liquidity grab before the next leg up.
Trading Plan:
✅ Buying dips remains the core strategy
🚫 Invalidation only comes on a break below 3305–3310
🎯 Upside target remains well above 3400, aiming for 1000+ pips
Let’s stay focused and let price come to us.
🚀
Disclosure: I am part of TradeNation's Influencer program and receive a monthly fee for using their TradingView charts in my analyses and educational articles.
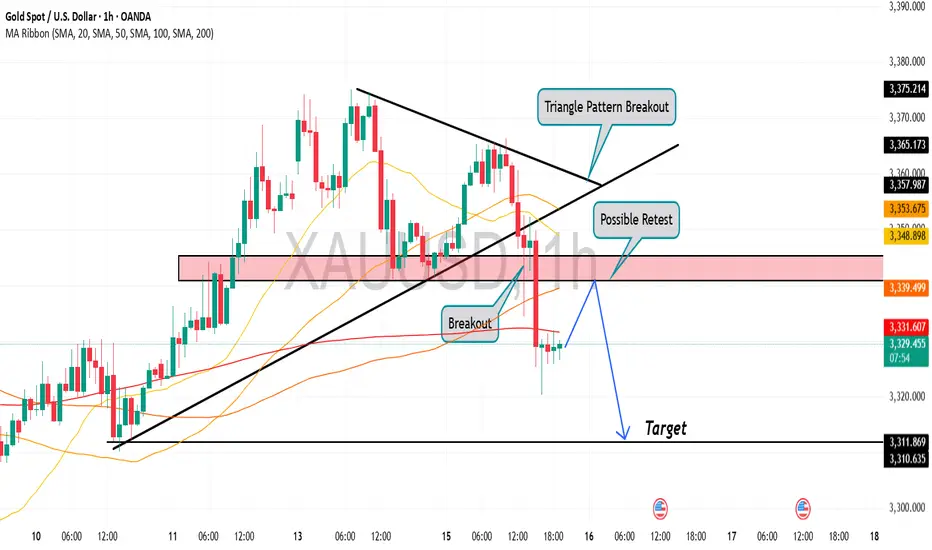
Gold is in the Bearish Direction after Breaking Triangle PatternHello Traders
In This Chart GOLD HOURLY Forex Forecast By FOREX PLANET
today Gold analysis 👆
🟢This Chart includes_ (GOLD market update)
🟢What is The Next Opportunity on GOLD Market
🟢how to Enter to the Valid Entry With Assurance Profit
This CHART is For Trader's that Want to Improve Their Technical Analysis Skills and Their Trading By Understanding How To Analyze The Market Using Multiple Timeframes and Understanding The Bigger Picture on the Charts
7/16: Will Gold Reclaim 3350 or Fall to 3250?During today’s session, gold briefly broke through the 3352–3358 resistance zone, but due to news-driven pressure during the pullback, bullish momentum weakened, and the price retreated to the MA60 support level on the daily chart.
Given the significant retracement, there is a possibility that a short-term bottom may form during the upcoming Asian session, potentially leading to a retest of the 3337-3343/3352-3358 resistance area:
If the price breaks above this zone and holds above it after a pullback, the bullish trend could resume;
However, if it fails to break through or is rejected again, caution is warranted, as this could signal a larger-scale downtrend on the weekly chart, possibly targeting the 3250 area.
7/15: Watch for Long Opportunities Around 3343 / 3332–3326Good morning, everyone!
Yesterday, gold rose into the resistance zone before pulling back, testing support around 3343. After today’s open, the price continues to consolidate near this support level.
On the 30-minute chart, there is a visible need for a technical rebound, while the 2-hour chart suggests that the broader downward movement may not be fully completed. The MA60 support area remains a key level to watch.
If support holds firm, the price may form a double bottom or a multi-bottom structure, potentially leading to a stronger rebound.
As such, the primary trading strategy for today is to look for long opportunities on pullbacks, with key levels as follows:
🔽 Support: 3343, and 3332–3326 zone
🔼 Resistance: 3352–3358, followed by the 3372–3378 upper resistance band

GOLD...Hello friends
Due to the entry of buyers and the strong breakdown of the indicated resistance, the price is expected to move to the indicated targets.
*Trade safely with us*

XAUUSD: Time For Swing Sell, 1 Hour Timeframe! Gold is currently trading at crucial level where we have witnessed a strong bearish presence. This is a small time frame overview and price may not complete the target fully, so close when you think it is the time. Good luck and trade safe!
Team Setupsfx_
