6/6 Gold Trading StrategyAfter a short rebound, gold is now hovering near key resistance levels.
The critical zone is around 3366 – if price breaks above this, the next upside targets are 3378–3388.
However, from a broader perspective, the 4H chart still shows an uncorrected bearish setup.
Without strong buying volume, the price may drop again — potentially below 3330, or even breach the 3300 level.
—
📅 Key Data Releases Today:
🔹 NFP (Non-Farm Payrolls)
🔹 US Unemployment Rate
Both events are expected to bring high volatility, so manage your risk carefully.
—
📊 My Intraday Trade Plan:
✅ Sell on rallies
🎯 Target: around 3330-3290
📌 Only if price reaches that support zone will I consider shifting to a bullish bias
Xauusdsignal

XAUUSD will it pump again? Gold free signal!!!Hello everyone.
I want share my idea about XAUUSD (Gold).
This week we started little bit bearish, week open we see big FVG at 4h chart which was not tested and till today it was coming down, but we see today after US news price was before into daily Gap zone and then show us aggressive buy.
Why we got aggressive buy today?
Gold (XAU/USD) staged an aggressive rally, climbing from a one-month low near $3,155 to around $3,219.81. The catalyst? U.S. economic news, likely softer-than-expected PPI data and growing concerns over a $1.049 trillion fiscal 2025 deficit, sparked safe-haven demand. A weaker dollar and renewed Fed rate-cut bets (possibly starting October) further fueled the surge. Gold’s appeal as a hedge against uncertainty shone through as markets digested mixed signals on Trump’s tariff policies.
Gold’s technical rebound could push it toward $3,400 if it holds above $3,200, but trade optimism or a hawkish Fed might cap gains. Long-term, analysts see gold hitting $3,700 by year-end, driven by inflation and policy risks.
Here is the setup for long side trade, my technical analysis is simple i am following trend, we have some shifting but that's not problem for, only i will be wrong if DXY will continue uptrend.
3212 open long position
3150 stop loss
3400 take profit
In my last analysis about gold i was wrong, my prediction was long but as i mentioned in my last post there was 2h FVG which worked well, and broke daily FVG zone plus last week low. If you want see my last post about gold it will be linked in this post.

Short gold after reboundOvernight, gold broke through the 3400 mark due to the intensification of geopolitical risks, but plunged sharply due to the reduction of the risk of Sino-US trade decoupling. Because the news swept up and down, it brought certain difficulties to the transaction. Today, we will focus on the NFP market!
After overnight gold plunged to around 3340, it is currently maintaining a small rebound state. Relatively speaking, the rebound potential is weak, and with the sharp plunge of gold in the short term, the market bulls' confidence has been hit. At present, without major good news, it is difficult to make breakthrough progress based on technical support alone. The upper side faces short-term resistance of 3365-3375 area resistance. If gold cannot break through this area in the short term, gold will be weak!
Trading strategy:
Consider shorting gold in the 3370-3380 area, TP: 3355-3345
XAUUSD:Go long in batches
Gold in recent two days of strong performance in Asia and Europe, the US is slightly weak, the shock range expanded, below 3340-45 is the rise point of these two times, currently back to around 3365, although the price back before, but the income did not expand. At present, gold is not a strong one-sided rise, is still volatile up, near this position into the long order to hold, is expected to break the probability of today's data is small.
On the trade, buy long in batches around 3365 and 3340-45, and look above the target at 3390-92 first
Trading Strategy:
Long orders near 3365 continue to hold
3340-45 can buy long orders twice
TP:3390-92
↓↓↓ More detailed strategies and trading will be notified here ↗↗↗
↓↓↓ Keep updated, come to "get" ↗↗↗

Before the non-agricultural data, gold is waiting for the trendToday, the market will focus on the US non-agricultural employment data. The market expects that 130,000 new jobs will be added and the unemployment rate will remain unchanged at 4.2%. If the non-agricultural data is far worse than expected, it may continue to hit the US dollar and stimulate a sharp rise in gold prices. On the contrary, if it is higher than expected, it may also cause the US dollar to rebound, and gold will continue to maintain the possibility of low consolidation.
Yesterday, the US stock market collapsed across the board due to the debate between Trump and Musk. Therefore, I am worried that Trump will continue to make remarks to boost the US stock market today. Once the US stock market rebounds again, gold may continue to fall, or remain at a low level for consolidation.
From the 4-hour chart, it can be seen that gold has been rising along the 4-hour trend line. However, from the current chart, gold has not yet stepped back. Therefore, it is not ruled out that gold will continue to step back to 3330-3340 and then choose a direction again. 3330-3340 is a critical position. Once it falls below 3330 again, it is very likely to directly touch 3300. On the contrary, if it stabilizes at 3330-3340 again, then gold will definitely stabilize above 3400 if it goes up again.
Secondly, from the perspective of the US dollar:
The bottom divergence structure appears here in the 4-hour chart. Therefore, once the divergence of the US dollar takes shape, it will also cause gold to return to a low level again.
Therefore, be careful when going long on gold today. The position where you can go long today is in the range of 3330-3340. Secondly, if gold falls below 3330 today, it will test around 3300, so another long position for gold is around 3300. On the contrary, if it falls below 3300, there will be no chance to go long on gold, and the subsequent decline may accelerate.
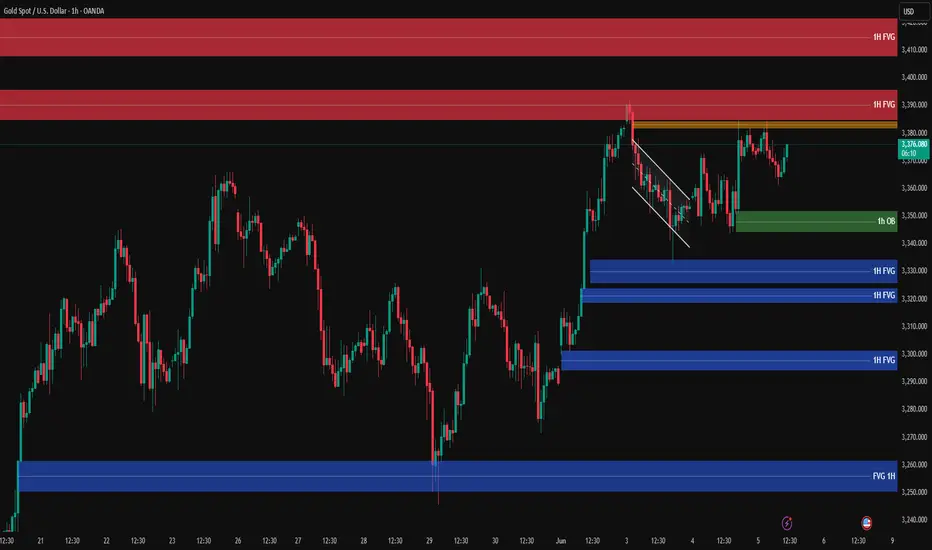
Gold Analysis – Likely Scenario📍 Gold is currently trading around 3375 USD and gaining bullish momentum with the London session opening.
🔸 Key Zones:
🟨 Critical Resistance (Orange Zone):
📍 3378 – 3384✅ Price consolidation zone – if broken with strong volume, a bullish continuation is likely.
🔴 Supply Zones (FVG):
1️⃣ Upper FVG 1H:📍 3386 – 3397
2️⃣ Main Supply Zone FVG 1H:📍 3405 – 3422
🟢 Demand Zone (1H OB):
📍 3345 – 3350✅ Strong buy zone after the breakout of falling wedge structure.
🔵 Lower Demand FVGs:
3330 – 3335
3315 – 3325
3290 – 3300
3260 – 3270
✳️ Likely Scenario:
If the orange resistance zone breaks, price is likely to rally toward the 3386 – 3397 FVG, and potentially 3405 – 3422.
If price gets rejected, watch for reactions at the 3345 – 3350 OB for potential long entries.
🔍 Insight by ProfitaminFX
If this outlook aligns with your bias, or if you see it differently, feel free to share your perspective in the comments. Let’s grow together 📈
Gold Update – The Reversal Is Still in PlayYesterday’s price action confirmed what we’ve been discussing in recent updates: the upside is vulnerable, and the real move could be lower.
Gold did push toward the 3400 zone, as expected — but that test was short-lived. Sellers stepped in aggressively, and price dropped back toward the 3350 support zone, closing the day with a bearish engulfing candle on the daily chart.
Will we have a new leg down?
That’s the big question now. While bulls are hoping for continuation, the current rebound is weak and seems to be shaping into a bear flag.
Why I Expect More Downside:
- Strong rejection from 3400 key level
- Daily chart printed a bearish engulfing
- Rebound structure looks corrective, not impulsive
Trading Plan:
I continue to look for selling opportunities on spikes, especially near resistance levels like 3375–3385.
If the 3340-3350 zone falls, I expect down acceleration and a drop even to 3200 zone.
Disclosure: I am part of TradeNation's Influencer program and receive a monthly fee for using their TradingView charts in my analyses and educational articles.

Non-agricultural data is coming. Disrupt the market?Market analysis:
The market once again staged a long-short trend yesterday. Due to the intensification of geopolitical risks, gold has been advancing all the way. Because of the easing of Sino-US trade relations, prices have fallen sharply. From the current market point of view, non-agricultural data is the key today. After a sharp drop in the early morning, it fluctuated sideways and maintained a small rebound.
According to the ADP data on Wednesday, there is a high probability that the data will be bullish today. The support in the early trading will focus on around 3345. Under the condition that the upward trend remains unchanged, the current market prompts a risk of retracement, but it will not prompt shorts to enter the market; before the non-agricultural data, it is still a low-multiple idea.
Non-agricultural data analysis:
Non-agricultural, recently affected by tariff conflicts, employment is very bad, especially Wednesday's ADP data, which is far below expectations, and this month's non-agricultural is expected to be 130,000. Although the expectation is lower than 177,000 last month, this number is still relatively high compared to ADP.
If the data released is higher than 177,000, it will be bearish for gold, but in terms of tariffs and ADP, this possibility is extremely small. The data is higher than 130,000 and lower than 177,000, which is also likely to be bearish for gold.
If it is lower than 130,000, gold may take this opportunity to rise sharply.
I think according to Wednesday's ADP, today's non-agricultural data is likely to be lower than 130,000, and the market will rise.
Positions to pay attention to today:
First support level: 3345, second support level: 3330, third support level: 3300
First resistance level: 3375, second resistance level: 3390, third resistance level: 3410
Operation strategy:
Aggressive trading-currently long at 3370, after the release of non-agricultural data, the gold price is likely to rise above 3400 points, which is also our profit range.
Steady trading-long at around 3350, the profit range is still at 3400 points after the release of non-agricultural data.

GOLD Intraday M30 Chart For 6 June 25As you can see that Market still is in strong range and we are still waiting for clear breakout
NFP main event of the day and remains watchable
If Market break 3335 successfully today then it will move towards 3310
above 3345-50 market remain slightly Bullish
Disclaimer: Forex is Risky

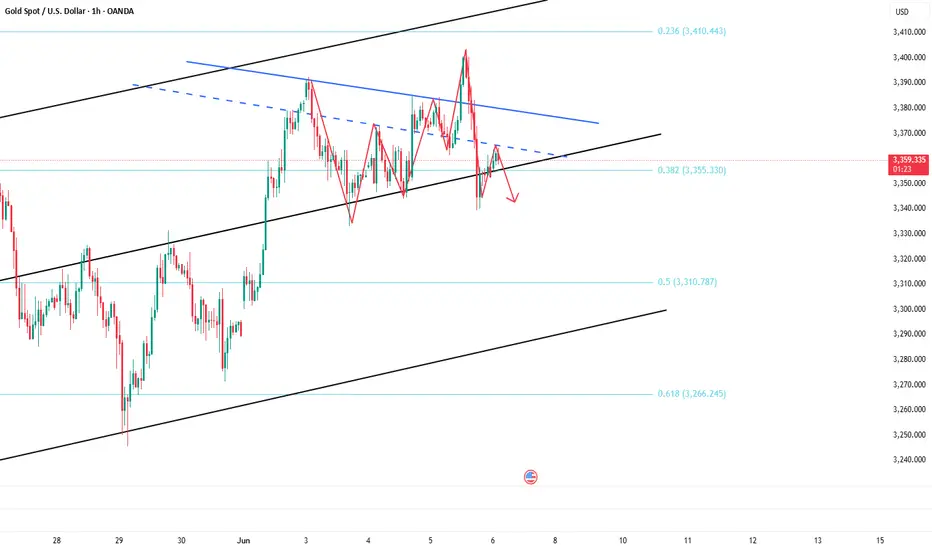
XAUUSD – Bearish Outlook from Resistance Zone📊 XAUUSD – Bearish Outlook from Resistance Zone
🕒 Date: June 5, 2025
💰 Instrument: Gold (XAUUSD)
📍 Current Price: 3,352.730 USD
🟨 Key Resistance Level
🔴 Price has sharply reacted from the 3,375–3,400 USD zone, highlighted as a strong resistance area.
📉 This zone has previously triggered significant sell-offs, confirmed again by the current bearish rejection (red arrow 🔻).
📉 Bearish Market Structure
The price structure suggests a classic lower high rejection scenario with potential for further downside:
🔻 Immediate Drop Expected
After rejection from resistance, the price shows early signs of breakdown. A minor pullback is expected before continuation.
🧭 TP1 – First Target Zone:
📍 3,245.560 USD
This level aligns with a previous demand area (light red box), likely to act as temporary support or reaction point.
🎯 TP2 – Final Bearish Target:
📍 3,127.527 USD
This blue demand zone is a major support level, previously a strong rally base (green arrow 🟢). Expect buyers to step in here again.
🔄 Trade Idea Summary
💼 Setup Type: Resistance Rejection
🛑 Bias: Bearish
📍 Entry Zone: ~3,350–3,360 USD (confirmed rejection)
🎯 Take Profit 1: 3,245.560 USD
🎯 Take Profit 2: 3,127.527 USD
🔒 Stop Loss: Above 3,400 USD (outside resistance zone)
📌 Observations:
🔁 The market repeated its previous pattern: bouncing from the blue demand zone and rejecting at the yellow resistance zone.
🧱 A solid breakdown below TP1 could accelerate movement toward TP2.
🔍 Watch for any bullish reaction around TP2 for potential reversal setups.
📉 Bias: Bearish
📆 Outlook: Short-term to mid-term swing

Is there still a chance for a bull market in gold's decline?📰 Impact of news:
1. European Central Bank deposit facility rate in the eurozone as of June 5
2. Initial jobless claims data
3. Non-farm payroll data
4. Worsening geopolitical situation
5. Watch the impact of the dialogue between Trump and Xi Jinping on gold
📈 Market analysis:
This round of geopolitical conflict caused an upward breakthrough, but the price has cooled down due to the negotiations between China and the United States. The current market is swaying at 3374. In fact, gold has not yet taken a more obvious direction. After all, tomorrow, Friday, is a key node in the data market game. At the 4H level, today's European session has reached the 3404 line, and encountered resistance and pressure here. The current retracement is in line with our expectations, and we expect to go long. As long as the key position of the middle track is maintained, it will continue to rise after being pulled down. At present, I still hold long orders.
🏅 Trading strategies:
BUY 3390-3385-3375
TP 3400-3410
If you agree with this view, or have a better idea, please leave a message in the comment area. I look forward to hearing different voices.
TVC:GOLD FXOPEN:XAUUSD FOREXCOM:XAUUSD FX:XAUUSD OANDA:XAUUSD

XAUUSDThe trend of XAUUSD is fluctuating.
Wednesday: XAUUSD in the Asian market rose sharply to 3372 and then quickly dropped to 3348. The current quotation is 3360.
It is a good trading opportunity for traders who bought low yesterday. The lowest yesterday fell to 3333. The operating space fluctuates by about $40/ounce. Many people have no idea. The profit of trading 1 lot of buy orders is 4. The profit of trading 5 lots is 20k.
This week is the monthly data news week. Including ADP. ECB interest rate decision, big non-agricultural data that have a significant impact on the economy.
Trend observation. There is still an intention to continue to rise. In terms of operation, you can focus on buying at low levels.
Pressure range: 3400-3390
Support range: 3340-3350
Under the influence of news. Many trends will be distorted due to the influence of data news. So I have been reminding you not to trade alone. If you want to follow good swing trading instructions to make reasonable trades and expand your profits, please leave us a message.

gold on bullish#XAUUSD price have breakout the 3403, now we expect new formation before any possible move. Between 3390-3392 shows rejection on sell.
Buy on multiple breakout Between 3390-3392, TP 3415-3420, SL 3380.
If possible the next H1 drops and close below 3380 then bearish retracment will occur till 3370-3355.

Gold= Breaks Resistance by Bullish Patterns + Geopolitical BoostGold ( OANDA:XAUUSD ) touched $3,337 as I expected in my previous idea .
Gold has now managed to break the Resistance lines and is trying to break the Resistance zone($3,387-$3,357) .
From a Classic Technical Analysis perspective, two Bullish Reversal Patterns are clearly visible on the Gold chart :
Descending Broadening Wedge Pattern
Inverse Head and Shoulders Pattern
According to Elliott Wave theory , by breaking the Resistance zone($3,387-$3,357) , we can confirm the start of an impulsive wave .
Also, given the increasing tension between Ukraine and Russia in recent days, there is a possibility that the price of Gold will increase due to the increased tensions .
I expect Gold to start rising again after a pullback to the neckline and resistance lines , and after breaking the Resistance zone($3,387-$3,357) , to rise to the target I have indicated on the chart.
Note: If Gold touches $3,299 , we should expect further declines.
Note: There is a possibility of emotional movements in the chart today when Fed Chair Powell speaks.
Gold Analyze ( XAUUSD ), 2-hour time frame.
Be sure to follow the updated ideas.
Do not forget to put a Stop loss for your positions (For every position you want to open).
Please follow your strategy; this is just my idea, and I will gladly see your ideas in this post.
Please do not forget the ✅' like '✅ button 🙏😊 & Share it with your friends; thanks, and Trade safe.

Bull market returns? Aiming at 3400?📰 Impact of news:
1. New uncertainty in Russia-Ukraine negotiations
📈 Market analysis:
The current trend of gold prices is erratic and discontinuous, and only swing trading can be adopted during the day. In the short term, there is a certain pressure at 3385-3395 above. If this resistance area is broken, the gold price is expected to continue to rise. The short-term support below FOREXCOM:XAUUSD is at 3350-3340. At present, the news has a greater impact on the gold price, coupled with the support of market risk aversion, so in the short term, attention should be paid to the break of the upper resistance.
🏅 Trading strategies:
BUY 3370-3365
TP 3385-3395-3400
SELL 3395-3400
TP 3380-3370
BUY 3350-3340
TP 3370-3380
If you agree with this view, or have a better idea, please leave a message in the comment area. I look forward to hearing different voices.
OANDA:XAUUSD FX:XAUUSD FXOPEN:XAUUSD TVC:GOLD

GOLD Intraday Update for 5 June 25as you can see that we already captured nice move since yesterday from 3345 to 3383
for market trading range is 3350-80 if market successfully breaks 3390 then it will move towards 3400 or even 3420
below 3350 it will move towards 3335 level
Disclaimer: Forex is Risky

Gold price fluctuates before NFP data, be careful📰 Impact of news:
1. European Central Bank deposit facility rate in the eurozone as of June 5
2. Initial jobless claims data
3. Non-farm payroll data
4. Worsening geopolitical situation
📈 Market analysis:
Since the release of ADP data last night, gold prices have been rising all the way, reaching a high of around 3382, which is in line with the expected resistance of 3385-3395 we saw yesterday. Currently, the bulls are stable above 3330, and the gold price is still in a bullish trend on the daily chart. Although the current market is in a state of consolidation, there is a possibility of a surge and fall in the short term. Only after a negative line correction occurs, it may continue to be bullish. In short-term trading, pay attention to 3385-3395 on the top and the opportunity to retreat to 3365-3355 on the bottom. Pay attention to data such as initial jobless claims and tomorrow's non-agricultural data.
🏅 Trading strategies:
BUY 3365-3355-3345
TP 3370-3380-3400
If you agree with this view, or have a better idea, please leave a message in the comment area. I look forward to hearing different voices.
TVC:GOLD FXOPEN:XAUUSD FOREXCOM:XAUUSD FX:XAUUSD OANDA:XAUUSD

XAUUSD FREE DAYTRADE SIGNAL!!!hello everyone i want share my free signal at XAUUSD.
Price tested well 30 FVG, we have bullish trend at all at gold and after consolidation golf found buyer + Dollar is bearish.
Here is my setup:
Open long position at 3368
Stop loss at 3364
Profit target 1 at 3377 profit target 2 at 3384
ALWAYS MAKE YOUR OWN RESEARCH !!!!

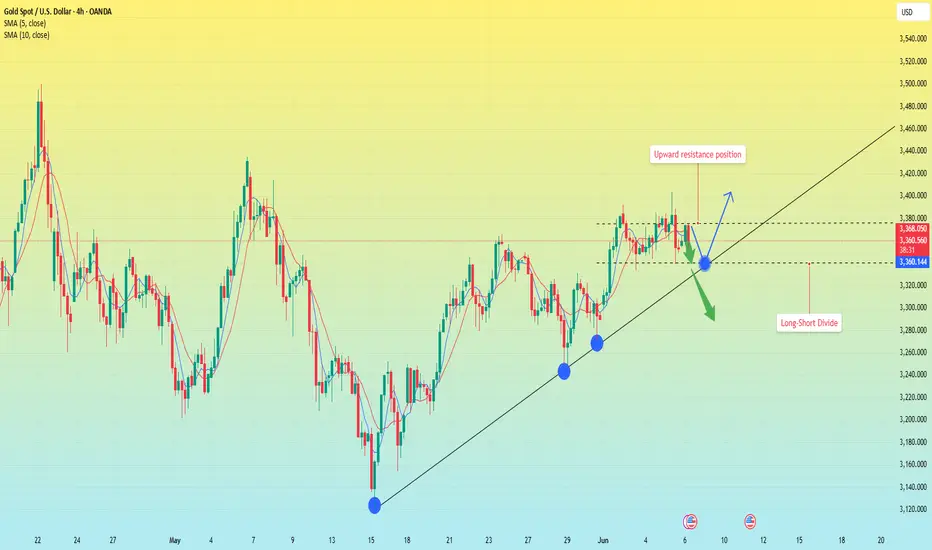
Gold points to 3400, madness before data release.Market analysis:
Gold fell slightly to around 3361 in early trading on Wednesday. After falling to around 3346, it quickly rose to around 3372, then was blocked and fluctuated and fell. It fell to 3344 in the European session and then rebounded. It rose strongly to 3384 in the US session and fluctuated above 3370 in the late trading.
The daily line of gold showed a trend of alternating yin and yang. But the overall trend was upward. The 5-day moving average and the 10-day moving average formed a golden cross and extended upward, which provided moving average support for the gold price, allowing gold to maintain a strong and volatile trend. At present, the 5-day moving average is around 3352, and the 10-day moving average is around 3335. The first thing to pay attention to is the resistance of Tuesday's high of 3392. If the gold price can break through this resistance level, it is expected to continue the bullish trend.
In terms of points, first pay attention to the support near MA5/MAA10 below, and focus on the support of MA20 moving average. The downward exploration on Tuesday and Wednesday both defended the MA20 moving average position. Above this, it is treated as a strong shock. Secondly, pay attention to the support near 3335, which is the low point on Tuesday and the key to the short-term structure. Secondly, pay attention to the support near 3335, which is the low point on Tuesday and the key to the short-term structure. First pay attention to the resistance near 3395 above, and then pay attention to the resistance near 3415 and 3430, which are the previous high points.
Operation strategy:
Short near 3395, stop loss 3410, profit range 3380-3360
Long near 3360, stop loss 3350, profit range 3375-3380-3390-3400.

Trading Strategy After ADP Nonfarm NewsPay attention to the trading range in the US session when ADP news is released. 3365 and 3343 are sideways ranges.
We can wait for a breakout trading strategy of this price range.
H1 closes above 3350, we will have a trading strategy towards 3365 and wait for the reaction in the next range. If it breaks, DCA will go up to 3390.
If it closes below 3351, wait for it to close below 3343 and retest to SELL to 3325

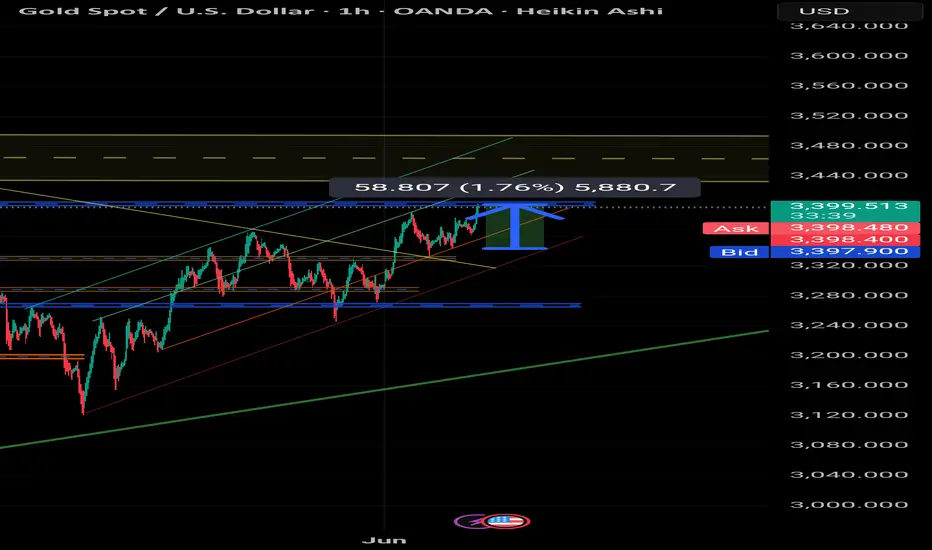
Safe-Haven Demand May Drive Gold Prices Higher✅ Today’s ADP report came in bullish for gold,
✅ Meanwhile, the Federal Reserve’s Beige Book reveals:
A slight slowdown in economic activity
Increased policy uncertainty and price pressures for businesses and consumers
An overall pessimistic economic outlook
📌 Combined with ongoing geopolitical tensions, this creates a supportive backdrop for safe-haven buying in gold.
🔍 Technical Outlook (1D Chart):
Gold is still facing a bearish divergence on the daily chart. For this to resolve, the market must choose between:
1️⃣ A strong breakout with volume, pushing toward 3430–3450
2️⃣ A pullback to repair structure, including filling the gap below 3300, which may later fuel a rally toward 3500+ if bullish catalysts arise
📅 Key Events to Watch This Week:
Thursday: Initial Jobless Claims
Friday: NFP (Nonfarm Payrolls)
⚠️ Also monitor developments on trade tariffs, which may affect market sentiment
📊 Short-Term Trade Plan (Range Strategy):
🎯 Key levels to watch:
Resistance: around 3400
Support: near 3366
📌 Consider range trading between 3408–3358, selling highs and buying dips with strict risk control.

Short-term bearish correction, within a potential bullish setupHere is a more detailed explanation of the chart analysis for XAU/USD (Gold Spot vs. U.S. Dollar) on the 30-minute timeframe:
📊 Chart Summary:
Instrument: XAU/USD (Gold Spot vs. U.S. Dollar)
Timeframe: 30-minute
Current Price: Around 3,359.945 USD
Trend: Short-term bearish correction, within a potential bullish setup
📌 Key Technical Levels:
1. Support Zone 🟩
Level: 3,342.605 USD
This is the zone where buyers are likely to step in. It's a previous demand area where price may reverse or consolidate before moving higher.
2. Resistance Level 🟥
Level: 3,391.323 USD
A key level to watch. If price breaks above this, it signals bullish strength and continuation.
3. Demand Zone 🟦
Level: 3,409.880 – 3,410.342 USD
Target area where strong buying activity previously occurred. Price may gravitate toward this if bullish momentum builds.
🔄 Price Projection Path (Expected Movement):
Price may test the support at 3,342.605, forming a potential reversal base.
A bullish move is expected toward the resistance at 3,391.323.
If broken, price could continue its upward trajectory toward the demand zone around 3,410.342.
🧠 Trading Implication:
Bullish Setup: Look for confirmation near the support zone for a long entry.
Breakout Traders: Watch for breakout above resistance for continuation trades.
Risk Management: Use tight stops below support; consider scaling out near resistance.
Let me know if you'd like a trading strategy or signals based on this analysis.
