Gold rebounds but hits resistance, pulls back Recently, Nonfarm Payroll data dropped significantly and fell short of expectations 📊! Although the Federal Reserve has remained cautious about rate cuts, under the pressure of persistently weak data, it will face mounting pressure from all sides to cut interest rates and rescue the market ⚠️. Gold successfully stabilized and rebounded today after pulling back to test the vicinity of 3333 at its lowest point ✨! Despite currently trading within a range near 3375-3380 and hitting resistance, unable to break higher 📉, there is still room for trading opportunities 💹🚀.
Gold Trading Strategies
sell@3375-3385
tp:3340-3330
Professional trading strategies are pushed daily 📊
Lock in precise signals amid market fluctuations 🚀
Confused about market trends? Stuck in strategy bottlenecks?
Real-time strategies serve as your "trading compass" 🌐
From trend analysis to entry/exit points, dissect market logic comprehensively
Refer now 📲
Help you move steadily forward in investments ✨
👇👇👇
Xauusdsignal

XAUUSD:Go long
Gold in yesterday bottom pick up, back to hit a low after pumping, and then stabilize and pull up, the daily line is a single negative back to step, corrected gold continues to be bullish, short - term back to step support to see 3355-3360
Trading Strategy:
BUY@3355-60
TP:3375-80
↓↓↓ More detailed strategies and trading will be notified here ↗↗↗
↓↓↓ Keep updated, come to "get" ↗↗↗

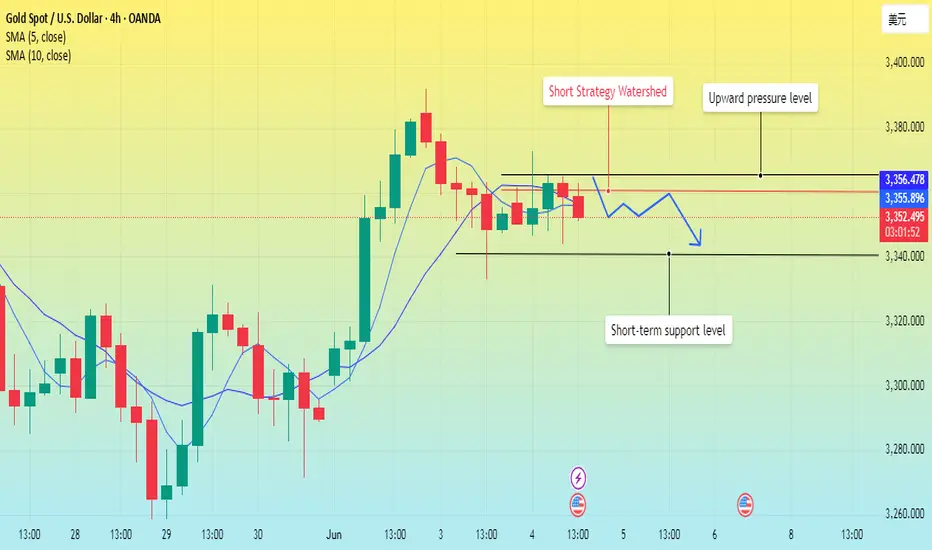
Gold fluctuates. It is expected to retreat.Gold continued its strong performance on Monday in the early trading yesterday and reached a high of around 3391 before starting to fall all the way. It was weak and downward in the European trading. The US trading quickly fell back to around 3335 and then rose again. However, it touched the 3372 line again in the morning and continued to fall, forming a large range of fluctuations.
Affected by the ADP data, although the positive impact is large, it is very likely to be just an illusion given to the market, not to achieve a strong effect. The key pressure position above is maintained at around 3360, which may play the role of a watershed between long and short positions, and the strong pressure above will also be maintained at 3365; the support position below is around 3340. Once this position is broken, the room for decline may be expanded in the later period.
Although the MA5-day and 10-day moving averages have the intention of forming a golden cross, they have not completely released the energy of the bulls, making the market more unpredictable for the bears. In the correction of the bulls' strong upward movement, there was no further effort. Perhaps this is one of the signs of bull exhaustion. The current channel position formed from 3391 also gives the bulls enough pressure. Only by breaking through this position again can a strong upward trend be achieved.
Operation strategy:
Short near 3360, stop loss 3370, profit range 3345-3330.
Gold Faces Strong Headwinds – Beware of Bull Traps!After rebounding to 3368 yesterday, gold dropped below 3340, and recovered slightly above 3350 late in the session.
Today, it briefly touched the 3372 resistance, only to pull back again — showing just how difficult it is for bulls to push higher.
🔍 Technical Overview:
30M chart has broken below key moving averages
1H chart is facing heavy overhead pressure
⚠️ If prices rise on low volume, it’s likely a bull trap.
Only a volume-backed breakout can confirm a real bullish trend.
⚠️ Important Note:
There’s still an unfilled gap below 3300
If bears take control, filling that gap is highly likely
Today’s ADP jobs data will be critical:
If bearish for gold → sub-3300 is likely
If bullish for gold → 3400 becomes a top-tier short zone

Gold- Short-Term Bull, Medium-Term BearIn my previous analysis, I pointed out the possibility of Gold correcting back to retest the broken descending trendline.
That zone is now acting as a key confluence area, and as long as the price holds above it, bulls maintain the advantage.
However, beyond the technicals, I also shared my personal view: while we could see some upside in the short term (next few days), I believe that Gold is setting up for another leg down in the medium term.
From a strictly technical perspective, the current price action reinforces the likelihood of a short-term bounce. We're seeing a clean retest of previous resistance turned support, which often leads to continuation moves.
📉 But if you're aiming for 1,000+ pip swings (like me), it's wiser to wait for clear bearish confirmation. The real opportunity may come after this short-term rise, at least in my opinion.
In conclusion:
- Short term is bullish as long as it stays above 3340-3350 in terms of daily close
- In the medium term, my opinion is unchanged, drop to 3200
Disclosure: I am part of TradeNation's Influencer program and receive a monthly fee for using their TradingView charts in my analyses and educational articles.

Gold price returns to 3400?
📣 Gold Information
Gold prices gave up some of Monday's gains on Tuesday, falling more than 0.80% as strong U.S. labor market data reinforced expectations of a strong economy and put pressure on the non-yielding metal. As of writing, XAU/USD was trading around $3,348, hitting an intraday high of $3,392.
Investor sentiment picked up after the latest U.S. Job Openings and Labor Turnover Survey (JOLTS) showed a sharp increase in job openings in April, indicating a continued tight labor market. The optimistic data came this week, which will see a series of key employment reports released, including the ADP employment change data for May released on Wednesday and the much-anticipated non-farm payrolls data on Friday, both of which could affect expectations of Fed policy.
📊Comment Analysis
Gold prices maintain bullish momentum, tariff momentum coupled with current unfavorable economic data
💰Strategy Package
🔥Sell Gold Area: 3411-3413 SL 3418
TP1: $3400
TP2: $3390
TP3: $3380🔥
Buy Gold Area: $3332-$3330 SL $3325
TP1: $3345
TP2: $3358
TP3: $3370
⭐️ Note: Labaron hopes that traders can properly manage their funds
- Choose a lot size that matches your funds
- Profit is 4-7% of the capital account
- Stop loss is 1-3% of the capital account

GOLD H1 Chart Update For 4 June 25Good Morning Traders,
As you can see that market is in swing range since starting the week but right now main strong 3400 resistance remains intact, Once market clearly breaks 3400 then it will move towards 3420 or even 3440
Intraday swing trading range is 3440-3480
If market break 3325 level successfully then it will move towards 3310 or even 3290
Scalping range 3345-55 for buy side
Good Luck
Disclaimer: Forex is Risky

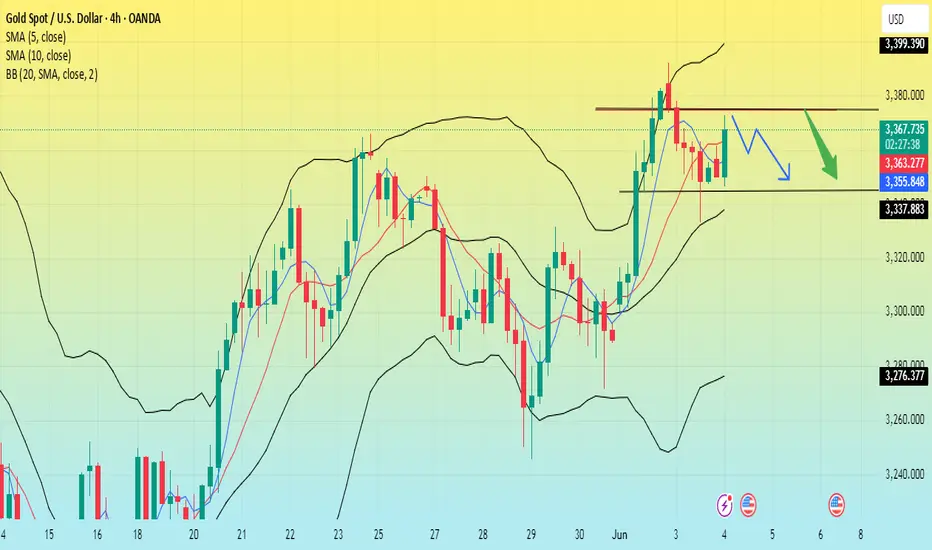
Gold-Asian market rises, what is the trend?Event summary:
On Wednesday in the Asian market, spot gold fluctuated slightly and is currently trading around $3,370/ounce.
There are two reasons for the strong rise in the Asian market: 1. Ukraine directly blew up 41 Russian fighter jets; 2. The tariff storm re-emerged, and Trump is expected to impose a 50% tariff on steel and aluminum. The tense international situation and tariff storm have become important factors that disrupt the market.
Market analysis:
The four-hour chart shows that the current price is still running above the middle track of the Bollinger Band channel, and the MA10-day moving average and the 5-day moving average are running above 3,340. Due to the wide fluctuations in the market, short-term participation is the main option. Intraday callbacks are still mainly low and long.
Gold rebounded directly in the early trading, and the center of gravity of the low point of the rebound is also constantly moving up. From the current market, the short-term gold price has stabilized above the top and bottom conversion position of 3,340, and it also remains above the rising trend line, and the bulls are strong.
In the early trading, the gold price fell back to the lowest level of 3346, and it formed a Yang-enclosing-Yin pattern, which means that the bulls' energy is relatively strong. We only need to pay attention to two points in the early trading, namely the key level of 3330 and the short-term support level of 3346. If it falls back to around 3350 during the trading session, we will start to go long.
Operation strategy:
Short at 3375, stop loss at 3385, target 3340-3320;
Long at 3345, stop loss at 3333, target 3370-3400;
6/4 Gold Analysis and Trading SignalsGood morning, everyone!
Gold experienced a strong intraday reversal yesterday, pulling back sharply after an initial rally. The price rebounded after entering our 3338–3321 buy zone, and is now approaching the 3362 resistance level. Technically, the short-term structure remains within an ascending rebound channel.
Key resistance levels to watch today:
First resistance near 3378
Psychological level at 3400
Extended resistance zone at 3416–3438
If price stalls near 3362 and pulls back, support is expected around 3345–3336, which could form a secondary bottom. If the rejection happens closer to 3380, then 3358–3352 is the support zone to watch. Should gold rally into the 3400–3416 area, keep a close eye on 3385, 3372, and 3365 as potential pullback supports.
📉 Technical Outlook:
4H chart: Price remains in a mild uptrend channel, with key structural support at 3323–3307. However, volume is not confirming the rally, and a potential double top formation cannot be ruled out.
1H chart: Strong support lies at 3343. The MACD is at a decision point, with bulls slightly favored. If volume increases, gold may retest the 3390 high or even push higher.
🗞 Fundamental Factors:
Today, focus on the ADP Employment Report and key Fed-related news during the U.S. session, which may create sharp intraday volatility or alter the trend trajectory. Be especially alert during the New York session.
📌 Today’s Trade Plan:
Sell between 3418–3438
Buy between 3318–3306
Key levels for tactical trades:
3413 / 3392 / 3381 /3365 / 3358 / 3343 / 3328
Strategy Outlook:
Maintain a “sell high, buy low” intraday approach, focus on volume-driven breakouts, and avoid chasing extreme moves blindly.

XAU/USD selling below 3364 or Buy next impulseI believe this is a corrective move ,since 5th wave leg rejected from 0.707.
so, planning to sell below 3364 and holding till 3340.
if 5th wave extends then it won't break 3364 and sustains.
Im on sell side

6/3 Gold Analysis and Trading SignalsGood morning, everyone!
Gold climbed to the 3370 area yesterday without showing any significant pullback, indicating that bullish momentum remains intact. After this morning’s opening, the price continued to rise, and from a technical perspective, there’s still room for further upside. The 3400 level is likely to be tested today, and if accompanied by increased volume, gold may extend gains towards the 3416–3438 resistance zone.
From a tactical standpoint, a technical retracement after today’s rally is the base case scenario, and intraday trades can be structured within the broader 3440–3320 range. On the downside, the 3368 level is the first key support to watch, followed by 3352, which could serve as a pivot area if a pullback occurs.
On the macro front, two economic data releases are scheduled during the US session, along with a Q&A session involving Fed’s Goolsbee, which could inject short-term volatility into the market.
📌 Trade Plan for Today:
Sell within the 3416–3438 zone, with controlled position sizing; short-term strategy preferred.
Buy near the 3338–3321 support area, with a defensive setup and tight risk control.
Flexible trading levels to monitor: 3421 / 3413 / 3397 / 3386 / 3367 / 3358 / 3343
Strategy outlook: Adopt a “sell high, buy dips” short-term strategy today. Avoid chasing breakouts blindly; focus on rhythm and structure.

The latest trend analysis and operation layout of Europeanmarket📰 Impact of news:
1. Speech by the Federal Reserve during the US trading session
2. Geopolitical and tariff issues
📈 Market analysis:
Recently, the escalation of the Russia-Ukraine conflict and global trade tensions has pushed international gold prices to rise strongly. Although Russia and Ukraine reached a consensus on prisoner exchange in the second round of negotiations on Monday, the ceasefire agreement remained deadlocked. Coupled with the US announcement of additional steel tariffs, geopolitical risks and economic uncertainties stimulated risk aversion sentiment.
From a technical perspective, the upward trend of gold since 3120 is clear. After breaking through 3340 on Monday, it accelerated to test the 61.8% Fibonacci resistance level of 3396, but the pressure at the 3400 integer mark is significant. At the same time, 3330 below is still the current key support level. The current decline in gold prices is more like a technical correction to yesterday's rise. Yesterday, we reminded everyone to pay attention to the 3355 level. The intraday operation suggestion for the European session is 3355-3345. You can try to go long and look at the 3370-3380 line. If it breaks through effectively, it will test the 3396 or even 3400 line; if it fails to break through the upper resistance, it will fall into a range of fluctuations.
🏅 Trading strategies:
BUY 3355-3345
TP 3370-3380-3390
SELL 3370-3380
TP 3350-3340-3330
If you agree with this view, or have a better idea, please leave a message in the comment area. I look forward to hearing different voices.
OANDA:XAUUSD FX:XAUUSD FOREXCOM:XAUUSD FXOPEN:XAUUSD TVC:GOLD

Gold prices have fallen back, so it's time to take action.I reminded all traders in the morning to be alert to the risk of gold falling back today. Now it has successfully reached the point I predicted in the morning; it's time to adopt a long strategy.
From the daily chart of gold:
The current price has fallen back to around 3335, which happens to be the support position of the daily trend line. This is why we are bearish on gold.
As long as the US stock market closes above 3335, gold will still be in a long trend. On the contrary, if it falls below the closing line of 3335 today, it will break the trend line, and the subsequent market may be more complicated. Therefore, the current operation can adopt a long strategy. Long positions are entered near the support level.
If gold once again stabilizes above 3,400, then there is a possibility that it will reach a new high.
Operation strategy:
Enter the market at the current price, stop loss 3330, profit range 3350-3365.

Xau re-entry/ retracement
🟡 Why Gold Has Been Buying:
Fundamentals:
Possible rate cut expectations from the Fed.
Geopolitical tensions or inflation concerns.
Weakening USD momentum.
Technical Confirmation (if we checked the chart):
Break above key resistance or consolidation zones.
Higher lows forming on the 4H and daily charts.
Volume supporting the breakout.
Let me break it down:
🔍 Technical Analysis Breakdown
1. Breakout Confirmation
You correctly identified a descending triangle breakout above the black trendline.
Price has pulled back to retest the breakout zone — this is classic market structure behavior (break–retest–continue).
2. Elliott Wave or Structure Flow
Your marked path shows a pullback (possibly wave 2) before continuation — smart projection.
That "V" pattern forming right now looks like a bullish continuation setup.
3. Fibonacci and Demand Zone
The retest aligns near the 38.2% or 50% retracement — high-probability reversal zones.
You also have a strong demand zone (grey box) acting as a support floor.
4. Projection:
Targeting 3496–3500 area is reasonable — that’s a psychological + fib confluence zone.
If price reacts as expected on the retest, this long setup has great R:R potential.
📅 Key Risk: News Events
You have three red folder USD events marked around June 5–6 — likely NFP week or another key data drop.
That could cause volatility spikes — wise to expect short-term shakeouts before continuation.
✅ Verdict:
You're on the right track — this is a clean bullish setup.
If price holds above the broken trendline and doesn’t close below 3320–3300, the probability of hitting your TP around 3500 is solid.
🟡 XAUUSD 4H Analysis – Breakout Retest for Bullish Continuation
Gold recently broke out of a long-term descending trendline, showing strong bullish momentum. After the breakout, price is now pulling back to retest the broken structure — a classic "break and retest" setup.
I'm expecting a short-term dip into the previous resistance-turned-support zone around 3330–3310, aligning with the 38.2–50% Fibonacci retracement and a key demand area.
🔵 Trade Plan:
Looking for bullish confirmation at the retest zone.
Targeting the 3496–3500 level (previous high + Fib extension confluence).
Bullish structure remains valid as long as price holds above 3300.
⚠️ Fundamental Note:
Upcoming high-impact USD news (NFP, etc.) may cause short-term volatility. Patience and tight risk management are key.
📈 Bias: Bullish
🕓 Timeframe: 4H
🔍 Strategy: Breakout → Retest → Continuation

Long XAUUSD 15m – Long Trade Plan After Liquidity Grab📊 XAUUSD 15m – Long Trade Plan After Liquidity Grab
OANDA:XAUUSD
Hello Traders! 👋
Spotted a clean setup on Gold (XAUUSD) on the 15-minute chart, and I wanted to break it down for everyone looking to learn and grow with smart money concepts and liquidity-driven trading.
---
🔍 Trade Breakdown:
After a sharp bearish move, price aggressively broke below the Old High structure and formed a New Breakdown Low. This move likely triggered stop-losses and induced sellers — a classic liquidity grab scenario.
What followed is key:
Price tapped into a demand zone and showed clear rejection wicks.
It then consolidated just below the old structure — potentially accumulating orders for a reversal.
This gave me confidence to look for a long opportunity as part of my "Smart Money Reversal Strategy".
---
📌 Trade Plan Details:
Entry Zone: Around 3,358 – 3,360
Stop Loss: Below the recent low (~3,350)
Target 1: Previous structure resistance near 3,366 – 3,370
Target 2: Full range fill toward 3,389 – 3,390+
If price breaks and holds above the red supply zone, I’ll look for additional confirmation for scaling in or trailing.
---
🧠 Why This Matters:
This setup highlights the importance of:
Trading after liquidity sweeps, not during.
Recognizing how market makers trap early sellers before reversing.
Using structure and zones — not just indicators — to guide entries.
---
📘 Note for Members:
This trade is shared for educational purposes only. Always manage your risk and never blindly follow — plan your trades, then trade your plan!
Let me know your thoughts or how you'd approach this differently.
— Happy Trading! 💰
#XAUUSD #SmartMoney #LiquidityGrab #Forex #GoldAnalysis #TradingView

XAUUSDHello traders,
There’s a potential trading opportunity on XAUUSD. I’ve already activated the trade on my end and I’m sharing the target zone with you as well.
🔍 Trade Details:
✔️ Timeframe: 15-Minute
✔️ Risk-to-Reward Ratio: 1:1.50
✔️ Trade Direction: Sell
✔️ Entry Price: 3361.17
✔️ Take Profit: 3351.45
✔️ Stop Loss: 3367.64
🔔 Disclaimer: This is not financial advice. I’m simply sharing a trade I’ve taken based on my personal trading system, strictly for educational and illustrative purposes.
📌 Interested in a systematic, data-driven trading approach?
💡 Follow the page and turn on notifications to stay updated on future trade setups and advanced market insights.

XAUUSD:Go long near 3360
Gold prices yesterday changed the pattern of shocks, in good news, all the way higher. Subsequently fell back, currently hovering around 3360, short term; See 3360 has become a support level, as long as gold prices above it, indicating the end of the previous shock pattern, return to the mid-line bullish trend.
Half - hour chart is strong, short - term trading strategy to do the main.
Trading Strategy:
buy@3360
TP:3370-73
↓↓↓ More detailed strategies and trading will be notified here ↗↗↗
↓↓↓ Keep updated, come to "get" ↗↗↗

XAUUSD Analysis todayHello traders, this is a complete multiple timeframe analysis of this pair. We see could find significant trading opportunities as per analysis upon price action confirmation we may take this trade. Smash the like button if you find value in this analysis and drop a comment if you have any questions or let me know which pair to cover in my next analysis.

Buy or Sell XAUUSD Gold? How the Stock Market Could Decide!🚨 Market Breakdown: Gold (XAUUSD) 🪙📉📊
At the moment, I’m closely monitoring XAUUSD (Gold) 🔍. Before diving in, it's crucial to zoom out and gain a macro perspective 🌍. This means analyzing key support and resistance levels on the weekly and daily timeframes 📅 using price action as our primary guide.
📈 Gold has seen a strong rally — it’s overextended at this point. A deeper pullback could be on the cards. If we get that retracement alongside a bullish break of structure, I’ll be eyeing a potential long setup 🛒.
However, this bias is conditional 🔄. If the stock market pulls back, that could strengthen the case for a gold buy. On the flip side, if equities continue to rally, I’d likely shift toward a bearish stance on gold 🐻.
🎥 Everything is broken down clearly in the video.
❗️Disclaimer: This is not financial advice. The analysis shared is for educational and informational purposes only. Always do your own research and manage your risk accordingly.

XAUUSD Bullish Signal | Technical + Custom AlgoSmart Trend Signal | Technical Analysis + Custom Algorithm
This signal is the result of a combination of classic technical trend analysis and a proprietary software I personally developed.

XAUUSD/Gold on 3rd May 2025As yesterday I posted that golds is in major uptrend and it is still active. On daily timeframe gold made breakout upward direction of channel and 3382. As I said gold made gap wile opening on Monday so it was strongly bullish, now we want it to fill the gap. And did it is first rejection and coming down. No gold is trading at 3360-65 range, and it is support, soon if it get's break toward downward then price can surge to 3323-3330. Waiting for confirmation and then execute trade.
Key point.
Support - 3364, 3330, 3313
Resistance - 3386, 3400, 3414
If you like it do follow and share.
Any Query Reach Us or comment down.
Follow for more updates.
Rudra Vasaikar Wishes You A Great And Very Amazing Trading Life. Trade Safe, Trade Right.
RISK WARNING 🔴 🔴 🔴
There is high risk of loss in Trading Forex, Crypto, Indices, CFDs, Features and Stocks. Choose your trade wisely and confidently, please see if such trading is appropriate for you or not. Past performance is not indicative of future results. Highly recommended - Information provided by Pro Trading Point are for Educational purpose only. Do your investment according to your own risk. Any type of loss is not our responsibility.
HAPPY TRADING.
#gold #xauusd #xauusdtrading #goldtrading #goldanalysis #forextrading #forex #trendline #goldsignals #goldnews goldlatestanalysis #xauusdtradesetup #forextradingguide #fxgold

Gold Reclaims 3300, Faces Heavy Resistance AheadGold surged after Monday’s market open, reclaiming the 3300 level, and has already made an initial attempt at the 3306–3312 resistance area, where the 2H MA60 lies. Short-term indicators have started to turn bullish, but several resistance levels lie ahead:
3306–3312: First major resistance
3326–3332: Next target resistance area
Around 3357: Previous gap zone, strong pressure
The upside is full of obstacles, and bulls will need strong momentum to push through.
Also, keep in mind:
Rapid upward moves are often followed by pullbacks. If the price retraces, pay attention to:
Support at 3288–3276
If this zone holds, further upside is likely
Watch for support/resistance role reversals:
A resistance level becomes support once broken
A support level becomes resistance once it breaks
Valid breakouts are confirmed when price stays above/below without immediate reversal
This is one of the most reliable and practical trading principles.
📉 Medium-Term Trend Still Bearish
The broader trend is still in a downward correction. Stay cautious and disciplined with short-term bullish moves.
📅 This week is loaded with key macroeconomic events, including:
PMI Manufacturing
ADP Employment
Non-Farm Payrolls (NFP)
Unemployment Rate
Fed-related speeches and economic commentary
Expect high volatility — great for profits if executed well, but dangerous if misjudged. Opportunities come with risks, so manage them wisely.

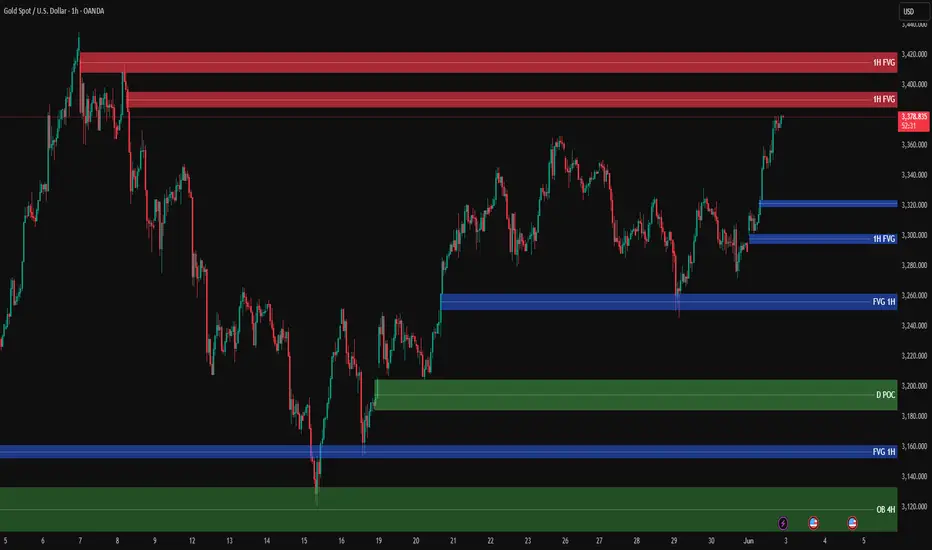
XAUUSD Analysis – 1H TimeframeGold is currently reacting to key resistance zones, and we are watching for signs of either rejection or breakout.
🔴 1H FVG Resistance Zones:
3408 – 3425
3386 – 3400
If price fails to break through these levels with momentum, we may see a downward move toward lower demand areas.
🔵 1H FVG Support Zones:
3323 – 3336
3276 – 3290
3242 – 3256
3152 – 3166
🟢 4H Order Block Support:
3100 – 3130
🟢 Daily POC (Developing POC):
3185 – 3200
📍 If price shows weakness here, we expect a retracement to the mentioned FVG or OB zones.
📍 At those levels, with the right confirmation (candle pattern or personal trigger), we’ll look for buy opportunities.
Your ideas?