XAUUSD Daytrade Signal!!!!Hello everyone i want share my trade at XAUUSD.
I will make full analysis tonight at gold.
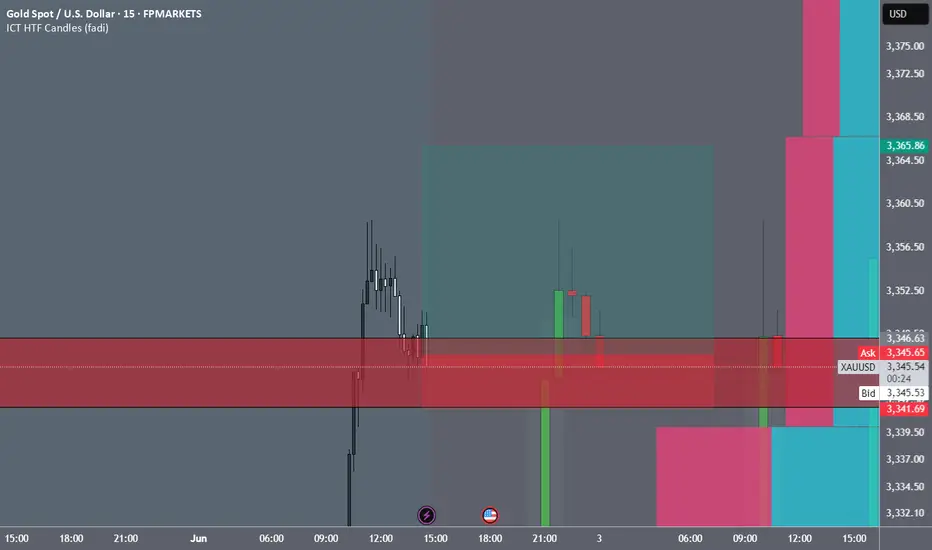
Open long position at 3346
Stop loss at 3342
Take profit at 3366
Always make your own research!!!!
Xauusdsignal
6/2 Gold Analysis and Trading SignalsGood evening, traders!
Gold surged more than $70 today, reaching an intraday high of 3363.
If you held short positions from last Friday’s close based on my plan, I hope your SL protected you from major losses.
📉 Technical Insight:
The rapid rally has triggered overbought signals and correction pressure
Watch for pullback support levels at:
3342
3328–3321 zone
If these hold, price might retest 3400 tomorrow
🎯 Trading Plan:
📉 Sell around 3360–3372 (with tight stop)
📈 Buy near 3328–3318 (if price stabilizes)
🔁 Scalp zones:
3332 / 3338 / 3343 / 3352 / 3366

Gold 1D timeframe. What Next Moment?Hello everyone, I am back after 3 years. Finally I have decided to continue my trade journey in forex and crypto professionally.
Here is the analysis of XAUUSD/Gold.
Gold has taken a big bold moment of Uptrend since strong resistance breakout on march of 1st, 2024. Since that time Gold didn't looked back & continued it's rally in uptrend. So our major trend is Uptrend in 1D and 4H timeframe. Gold did some downtrend and sideway rally and again took another uptrend rally on Dec of 18th, 2024. Gold break all top high and made new high 3500.
If I talk in 1D timeframe gold is trading in bullish flag, and I am not wishing it right now to break upward. But has you know it is gold anything can happen. While today is Monday and market opening was in gap. So it needs to fill the gap after that we can execute a trade. Still now needs some confirmation that it will come down. So have patience and watch the market carefully.
Key point.
Resistance - 3356, 3369, 3396
Support - 3343, 3323, 3304
Any Query Reach Us or comment down
Rudra Vasaikar Wishes You A Great And Very Amazing Trading Life. Trade Safe, Trade Right.
RISK WARNING 🔴 🔴 🔴
There is high risk of loss in Trading Forex, Crypto, Indices, CFDs, Features and Stocks. Choose your trade wisely and confidently, please see if such trading is appropriate for you or not. Past performance is not indicative of future results. Highly recommended - Information provided by Pro Trading Point are for Educational purpose only. Do your investment according to your own risk. Any type of loss is not our responsibility.
HAPPY TRADING.
#gold #xauusd #xauusdtrading #goldtrading #goldanalysis #forextrading #forex #trendline #goldsignals #goldnews goldlatestanalysis #xauusdtradesetup #forextradingguide #fxgold

Will Gold drop to 3200 zone next week?🟡 1. What happened last week with Gold (XAUUSD)
Gold began last week by testing the 3350 resistance zone, hinting the end of the correction and the potential for an upside breakout.
However, in the following days, the market reversed aggressively, reaching as low as 3250 on Thursday — a drop of nearly 1000 pips from the local top and resistance zone.
After this sharp fall, Gold bounced back above 3300, retested the 3325–3330 area, but failed once again — closing the week below 3300.
❓ 2. Key question: Has the rebound ended or is it just a deeper trap?
The market has shown a fake-out followed by compression under resistance.
So the real question becomes: Will the 3280–3290 support finally give in, or will bulls defend it again?
________________________________________
🔻 3. Why I expect a continuation to the downside
Here’s what the chart structure tells us:
• Clear lower highs and lower lows — the trend remains bearish
• 3330 has turned into major confluence resistance
• Every bounce is sold, showing fading bullish momentum
• The support at 3280–3290 is being squeezed repeatedly
If 3280 breaks cleanly, price action will likely accelerate downward.
________________________________________
🧭 4. Trading Plan for Next Week
Focus remains on selling rallies, especially if price rises above 3300.
📉 Invalidation: any clean break and hold above 3330
🎯 Target Zones:
• 3250 = Soft target (first reaction zone)
• 3200 = Real target (bearish continuation zone if structure unfolds as expected)
Use structure, not emotion. Let the breakout confirm the plan.
________________________________________
🚀 5. Final thoughts
The price action around 3280 will likely set the tone for next week.
A breakdown here confirms the bearish structure and opens the door to 3250, then 3200.
Until then: sell rallies, manage risk, and wait for the chart to validate your edge.
Stay sharp. 🚀
Disclosure: I am part of TradeNation's Influencer program and receive a monthly fee for using their TradingView charts in my analyses and educational articles.

XAUUSD:BUYAfter the good news came out. XAUUSD followed my expectations. Continued to rise above 3300. The current quotation is 3317.
The tariff issue was released again over the weekend. Inflation fermented again, and the Russian-Ukrainian negotiations reached a tense and uncertain stage again.
Traders who followed me to buy near 3290 successfully made good profits.
Trading reference
XAUUSD:
Pressure position: 3360-3350
Support position: 3305-3295
BTCUSD:
Pressure position: 107000-106000
Support position: 103000-102000
This week, there is the impact of the release of non-agricultural data.
Usually divided into the front, middle, and back end of the triple impact. For traders, every time is a good trading opportunity. The impact is also very large.
This week, we will focus on the impact of news and the stimulation of news to layout the wonderful transactions of XAUUSD and BTCUSD. Remember not to trade independently to avoid losses. If you have any ideas, remember to leave a message to me and my assistant.

Is the positive news fading? The latest analysis of gold📰 Impact of news:
1. The conflict between Russia and Ukraine breaks out again, exacerbating the uncertainty of the situation
2. The tension in the Middle East continues, Iran claims to be ready to defend its airspace at any time, and the Houthi armed forces attack Israeli airports
3. May PMI data released
📈 Market analysis:
As geopolitical conflicts between Russia and Ukraine and the Middle East broke out again over the weekend, gold jumped higher today. From a technical perspective, the 1H chart shows a bullish arrangement, but the gold price is in a downward channel at the daily level. The gold price is currently near the middle track of the Bollinger Band and is obviously suppressed by the downward channel. The 4H level Bollinger Bands narrowed, the moving averages adhered, the long and short positions were in a stalemate, and the MACD indicator hovered around the 0 axis. 3330 - 3335 above is the key resistance area. If it breaks through 3340, it is expected to continue to see new highs. At the same time, there is short-term support in the 3285-3280 range below. 3270 - 3265 becomes the key important support. If it falls below, it may fall to 3245. For short-term operations in the Asian and European sessions today, if the resistance area of 3325-3335 cannot be effectively broken through, you can consider shorting and look towards 3310-3290 in the short term.
🏅 Trading strategies:
SELL 3325-3335
TP 3310-3290
If you agree with this view, or have a better idea, please leave a message in the comment area. I look forward to hearing different voices.
TVC:GOLD FXOPEN:XAUUSD FOREXCOM:XAUUSD FX:XAUUSD OANDA:XAUUSD

Here's a weekly buy-side analysis🟢 Bias: Bullish (Buy)
Gold remains in a long-term uptrend, with fundamental and technical factors supporting continued upside.
50 & 100 EMA: Price is well above both EMAs, confirming bullish momentum.
RSI: Around 60–70 on the weekly; no bearish divergence yet.
MACD: Histogram ticking upward with bullish crossover in play.⚠️ Risk Factors
Sudden USD strength due to surprise Fed hawkishness.
Strong U.S. labor or inflation data that pushes bond yields higher.
Gold profit-taking near ATH could cause sharp but temporary pullbacks.

Trade conflicts are re-emerging, will gold rise?Information summary:
Gold prices rose slightly in early Asian trading on Monday, affected by the long-term uncertainty of tariffs and international geopolitical conflicts, which increased the demand for safe-haven assets.
Trump made a statement earlier that China had violated the Sino-US trade negotiation regulations in a big way; then the US Treasury Secretary assured that the United States would never default. This has once again led to tensions in Sino-US trade relations, and investors are also cautious about this news.
This news has undoubtedly disrupted the international market and supported the rise in gold prices.
Traders need to pay attention to the May ISM manufacturing report to be released by the United States today, which may affect the new trend of gold.
Trading analysis:
I think the repeated emotions of the United States on tariffs will cause gold prices to rebound after a downward adjustment, and then fall slightly.
If gold cannot break through the upward 3350 cycle pressure level strongly and stabilize above this position. Then the price will fall back below this position.
Operation strategy:
Long at 3340, stop loss at 3330, take profit at 3350.
Short at 3350, stop loss at 3365, profit range is around the early support level of 3300-3390.
If you want to trade steadily, you can continue to wait and see for some time, because there are too many black swan events in the Asian market today, and the market is full of uncertainty.

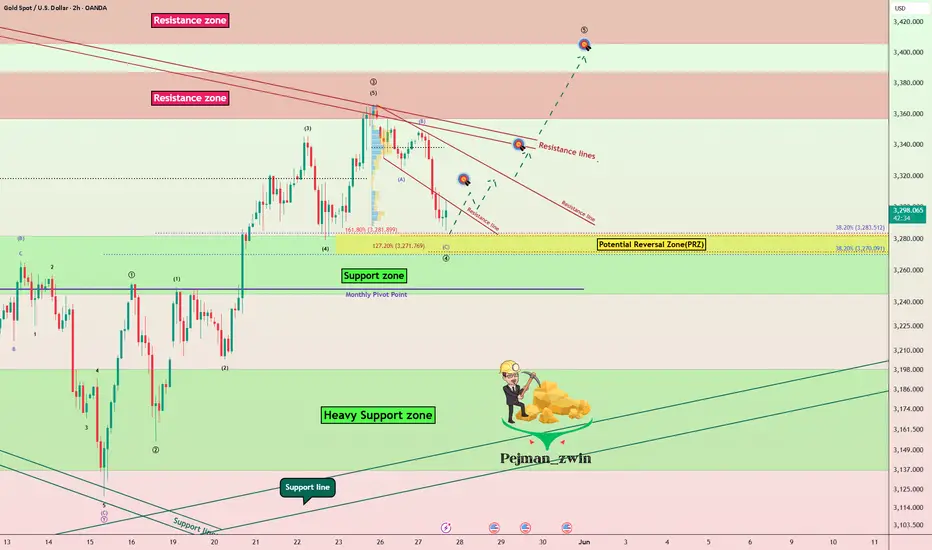
Gold Finds Support in PRZ – $3,337 in Sight? As I expected in my previous idea , Gold ( OANDA:XAUUSD ) moved towards the Support zone($3,280-$3,245) after breaking the lower line of the ascending channel.
Gold is moving near the Support zone($3,280-$3,245) , Potential Reversal Zone(PRZ) and Monthly Pivot Point .
In terms of Elliott Wave theory , Gold appears to be completing a main wave 4 . The structure of the main wave 4 can be complex . Confirmation of the end of the main wave 4 requires a break of the Resistance lines and Resistance zone($3,387-$3,357) .
I expect Gold to move up after entering the Potential Reversal Zone(PRZ) and the first target could be $3,314 and the second target could be $3,337 . If the momentum is high for Gold, you can consider higher targets for Gold to increase .
Note: If Gold touches $3,245 , we should expect further declines.
Gold Analyze ( XAUUSD ), 2-hour time frame.
Be sure to follow the updated ideas.
Do not forget to put a Stop loss for your positions (For every position you want to open).
Please follow your strategy; this is just my idea, and I will gladly see your ideas in this post.
Please do not forget the ✅' like '✅ button 🙏😊 & Share it with your friends; thanks, and Trade safe.
GOLD H1 Chart Update For 2 June 25As you can see that there are some important zones mentioned on the chart
First read all details carefully market is in sideways for now once market will break 3330 level then it will move further higher towards 3360 even 3370
3300 Psychological Remains in focus once market breaks 3300 then it will try to fill the OPENING GAP which is due on 3289
for today if market sustains below 3280 level then it will move towards 3240-50 zone
Scalping or shorter term range in 3295-3320
Remember always use SL
Disclaimer: Forex is Risky

The international situation is turbulent, how is the trend of goInformation summary:
On June 1, Russia and Ukraine continued to clash. Ukrainian drones attacked several Russian military airports, including military bases in eastern Siberia, more than 40 aircraft were damaged, and the loss was about 2 billion US dollars. This was the first time that a military base in Siberia was attacked by a drone. Murmansk Oblast was also attacked by a drone on the same day.
However, on the same day, Russia and Ukraine planned to hold a second round of ceasefire negotiations in Istanbul on June 2. The United States said that it was not informed of the Ukrainian attack in advance. Russia and the US Foreign Minister discussed the negotiation plan by phone. The Hungarian Prime Minister revealed that the mediation in 2024 was unsuccessful, and the two sides had obvious differences on the timing of the ceasefire.
The current situation is complicated, the prospects for peace talks are unclear, and market risk aversion and economic data (this week's employment report, central bank interest rate decision, etc.) have become new focuses.
Gold trend analysis:
From the daily chart, the current daily support position is around 3280. This position is the key to the gold band trend. Since the price has broken upward recently, it has stepped back many times and finally closed above the daily support, so the position of the daily support is still the key. Before falling below this support level, the price will most likely maintain a range of 3320-3280 US dollars.
Operation strategy:
Buy near 3280, stop loss 3270, profit position 3320.

The dollar is strong, will gold break through the consolidation?At the beginning of this week, the US dollar index fell to a one-month low due to Trump's sudden change in the direction of the EU policy. Subsequently, due to the contest between Trump and the US Trade Court ruling, the prices of gold and the US dollar fluctuated greatly.
I think the US dollar will start to rise next week with the help of non-farm payrolls data. I am afraid that a new round of price fluctuations is coming.
If the US dollar is to have a new upward trend in June, gold will also be affected. Judging from the current daily line of gold, the overall trend is also to be adjusted downward.
The high point of gold in May was 3438, and the low point was 3120. I also drew the Fibonacci dividing line in the figure. The most critical position is 3317 at the 0.382 position and 3280 at the 0.5 position.
Gold is still maintaining a consolidation of 3317-3280. Although there have been breakthroughs above and below, they are all within the daily range. Next week, as long as gold can close below 3280 on the daily line, it will start a correction trend step by step. The first target below is around 3250, and the second is 3180-3200.
As long as the daily line of gold can close below 3180, then we will usher in a big bearish trend at the daily level. On the contrary, the daily line of gold cannot close above 3317 again. In a better situation, it may touch around 3340 again and then retreat again.
The bad result is that it directly breaks through the pressure level and stands above the 3340 trend line. If this happens, the price of gold may move towards a new high.

Gold Analysis
Last week's movement so far on the chart moved as expected. To continue this week's path, expect another step to correct to two support areas, first the 3264-3255 range, and if lost to the support area 3265-3232. It can be considered that from one of these two supports, the upward movement for the liquidity above it will continue. The resistance/support areas will change their nature if lost.

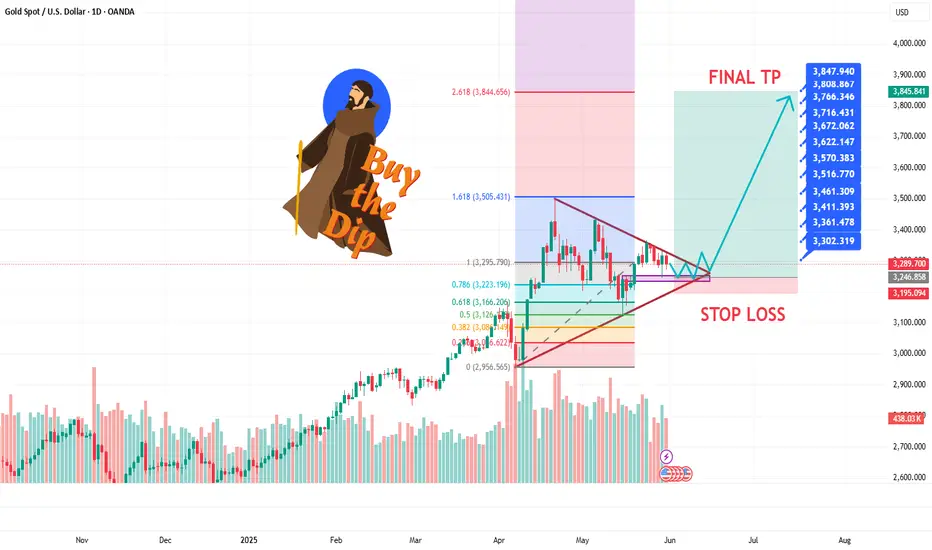
GOLD AND WAR NEXT TO 4K$Hello traders
as i can see gold is trading in a Decending Triangle zone and it had tested Fibo 0.61 ratio in month of may dip as we can see gold close monthly candle above 3280 zone which is a clear sign that big players and banks are still prefer Safe haven we can see US econmey in a bad recession zone unemployment and higher inflation is a big problrm for $ and on all these things Mr. Trump Tariffs is a game changer in commodities markets if we see Geopolitical issues around the world it esculating more war in diffrent regions of the world.. Now Israiel & US have a new biggest problem Iran which is showing us a attack on Iran can be happen incoming days as we can see 6 meetings was unsucessful in Oman for a Deal to Stop Iran's Nucler Enrichment Program which is not good... other then fundamental Charts are crystal clear and showing us a clear view for a New ATH on Gold our Risk reward ratio is prefect for us have a proper research before taking any trade its just an trade idea share your thoughts with us it will help many other traders Comments are open we love your comments and support the channel so it can diliver to many other new traders Stay Tuned for new updates ..
Gold Channel Rejection ZoneGold (XAUUSD) remains in a strong long-term uptrend, respecting a well-defined ascending channel on the weekly timeframe. Price is currently testing the upper boundary of this channel, suggesting potential exhaustion near the resistance zone.
A bearish rejection from this area could trigger a corrective move toward the lower boundary of the channel, aligning with a healthy pullback in an overall bullish structure. The chart also highlights a clear risk-to-reward setup, with a stop loss positioned above the recent highs and a target toward channel support.
As long as price remains below the channel top, downside pressure is likely in the incoming weeks. A confirmed breakout above the channel, however, would invalidate the bearish move and signal continuation of the bullish momentum.
Stop loss: 3443
Take profit: Around 2895 ( EMA 200 Daily )

Technical Analysis → Gold will remain stableThroughout May, the news backdrop, including international trade tariffs and geopolitical turmoil, led to a technical peak of around $3,430 and a low near $3,130 in gold. As of now, the price per ounce is stable at around $3,300, roughly the same level as at the beginning of the month.
This shows that supply and demand forces are basically balanced, and prices are maintained between these two extremes. Gold technicals further confirm this and highlight the importance of the $3,300 level.
Bearish perspective: The A→B→C→D→E sequence forms a peak high and a cycle low, which is a clear downtrend signal. The trajectory is marked in red, and the upper line constitutes resistance.
Bullish perspective: Since the beginning of 2025, the price of gold has been in an upward trend, represented by the blue channel, and its lower boundary constitutes key support (marked with arrows).
It is worth noting that these support and resistance lines are converging, forming a narrowing triangle. This shows that supply and demand are balancing and the market has reached a consensus around the $3,300 level, which is exactly the central axis of the triangle.
Based on this, we can reasonably assume that the technical side of gold in June may continue to fluctuate within this triangle unless a special event occurs that causes a significant break in the current balance.

5/30 Gold Analysis and Trading SignalsGood morning everyone!
Yesterday, we successfully executed short at 3290 and long at 3250, and also entered the 3316–3328 short zone near the close. All signals were hit, and profits were solid ✅.
📉 Technical Outlook:
The 1-hour chart remains in a clear bearish trend, indicating that this pullback is not yet complete.
Initial support at 3296 is very likely to break
Focus shifts to 3278 support, though it appears technically weak
If price hits 3278, a minor bounce is expected, but it's likely just a retracement, not a reversal
🗞 Fundamental Watch:
The U.S. Consumer Confidence Index will be released during the U.S. session today.
Market reaction is expected to be similar to yesterday’s initial jobless claims — possibly triggering short-term moves, but not changing the broader trend.
📈 Trade Plan for Today:
📉 Sell in the 3316–3328 zone (key resistance)
📈 Buy in the 3238–3221 zone (key support area)
🔁 Scalp/flexible trading zones:
3303 / 3288 / 3276 / 3265 / 3252 / 3238
Stick to proper risk management, and stay alert during U.S. data releases.
Trade with the trend and close the week strong!
Additionally, on the 30-minute chart, gold appears to be forming a potential inverse head and shoulders pattern. If this pattern completes and breaks the neckline successfully, the price may surge toward the 3336–3352 area, or even up to 3360.
For those considering short positions, it’s crucial to control position size and avoid entering too early. Try to wait for price action to reach higher resistance levels before making a move. Don’t worry about missing a perfect entry — even if one trade is missed, it won’t affect your overall profitability for the week.
The market always offers opportunities. Stay calm, stick to your strategy, and remember: consistency and patience lead to long-term success.

Data is out. Gold is fluctuating.Information summary:
On Wednesday, US time, the Trade Court ordered an immediate halt to tariffs; the next day, the Federal Court of Appeals immediately resumed the policy. At the same time, the Trade Court was required to respond by June 5, and the government by June 9. Tariff policies are back and forth, and it is difficult to figure out. In other words, don't expect the US government to come up with any good news.
Today, the annual rate of the US core PCE price index in April was 2.6% in the previous value and 2.5% in the expected value. The expectation seen at the beginning of the week was 2.6%. Now the expectation is directly lowered. Is it to leave room for this announcement? If the increase is not higher than the previous value, it is not a significant increase, but it leaves room for interest rate cuts. For gold, the increase is not higher than the previous value, and the short position is limited.
This mediocre data can directly provide a basis for speculation on the current economic situation in the United States.
After yesterday's strong rise, with a very long lower shadow left on the middle track of the Bollinger Band, after stabilizing the middle track, the fast and slow lines further converged and flattened, indicating that the main funds are also hesitating. From this perspective, today's market may continue to fluctuate within the middle track.
At the same time, the closing line is also the most critical, which is around 3285-90 near the middle track.
Operation strategy:
Today's trading needs to pay attention to the cycle suppression position of 3315-3330 on the upper side, and the cycle support level of 3385-3380 on the lower side. This range can be maintained for scalping trading.
If the gold price breaks through strongly upward or downward, the new trend will be realized in a very short time, so traders need to make profits and stop losses in time.

Gold Update – Has the Downside Ended or Just Taking a Break?📉 What happened yesterday on Gold (XAUUSD)
I started the day under a good omen – 🎯 my 3250 target being hit perfectly.
However, what initially looked like a standard correction turned into a stronger bounce.
Gold broke back above my re-selling zone and even pushed above 3310, triggering my stop loss, and worth nothing that we are now back under 3300- I take it like a man and move forward:).
❓ Has Gold finished with the downside, or is this just a pause before another drop?
🔍 Reasons to expect more downside:
- Although Gold reversed strongly from the 3250 support, the confluence resistance around 3330 capped the move, and sellers stepped in, dragging the price back under 3300.
- The fact that price returned to support so quickly signals weak bullish momentum – buyers couldn’t sustain the rally.
- Gold failed to stabilize above the 3330 zone, which would’ve been a key bullish sign – instead, it got rejected.
- And here’s the part that doesn’t sit right – Gold came back to the 3290 zone too easily, as if the market wanted to offer a second chance to buyers who missed the initial bounce. That usually doesn’t end well.
🧭 Trading Plan
I’m currently out of the market after the stop loss hit, but my bearish bias remains unchanged.
Watching the 3280–3290 area closely – if we drop back below, I’ll look to re-enter short trades.
🚀 Final thought
Yesterday’s move reminded me who’s boss – the market . But unless bulls break key resistance and hold above, the bearish case still has more to say.
Disclosure: I am part of TradeNation's Influencer program and receive a monthly fee for using their TradingView charts in my analyses and educational articles.

Gold Poised for a Breakout After Sideways ConsolidationGold has retraced to the 3300 level and remained range-bound for an extended period. This prolonged consolidation suggests that a sharp breakout may be imminent, with the next move — whether up or down — likely to be swift and volatile.
Looking at the 2-hour chart, the current price structure is complex. It could be interpreted as a potential double top, but it also resembles the early formation of an inverse head and shoulders, which makes trading decisions more challenging.
From a technical standpoint:
Moving averages are aligned in a bearish setup, and the area above remains densely packed with resistance.
MACD on the 2H chart shows a bearish crossover, signaling a potential continuation of the downtrend.
However, on the 30-minute chart, MACD shows some short-term bullish momentum, with the next resistance near 3306.
For bulls, if the price attempts to rise toward the 3306–3312 zone but then quickly pulls back, this would indicate weak buying pressure, and caution is advised.
In summary, short-term signals are bullish, but the medium-term trend remains bearish. With the market in a sideways range, it's best to remain patient and watch for breakout signals. The two trading opportunities shared yesterday remain valid and worth monitoring closely.

Monthly closing bet. Opening a falling gap?Information summary:
At 8:30 a.m. on Friday, U.S. time, the U.S. Bureau of Economic Analysis will release the personal consumption expenditure (PCE) price index for April. As the most favored inflation indicator of the Federal Reserve, the year-on-year change in the core PCE price index has a greater impact on policymakers.
If the data is released, the core PCE price index in April rises faster than expected, and the direct reaction of the market may lead investors to prefer the policy rate to remain unchanged in July. In this case, the U.S. dollar may gather strength, causing gold prices to fall before the weekend.
Market analysis:
Gold prices rose as high as 3322 in the early Asian session, and then fell without a dollar line. As of now, the lowest price has retreated to the 3290 U.S. dollar line. At present, it is not ruled out that gold will fluctuate widely; but the trend view is still biased towards the short side. The strength of the current rebound still depends on the strength of the European session. In the European session, the operation will focus on the vicinity of 3310 U.S. dollars first, and the pressure will still look down to 3280 U.S. dollars.
However, if the European session falls directly below $3,285, there is still room for decline, and the support is around 3,250. In addition, today is the last day of the monthly line closing, and the range of fluctuations has not yet left, so you can continue the short strategy.
Operation strategy:
Short around $3,310, stop loss at $3,320, and profit range around $3,250.

GOLD Intraday Chart For H1 30 May 2025Good Morning Traders,
As you can see that there are some strong zones mentioned on chart,
For Intraday all eyes between 3280-3300 zone,
If market clearly goes below 3280 then it will move towards 3250 else market sustains above 3280 it will move towards 3300 and after clear breakout of 3300 then move towards 3325 initially
Furthermore you can read the chart details carefully, Remember, Always Trade with SL
Today US PCE PRICE INDEX due today
Monthly Closing Due Today as well
Disclaimer: Forex in Risky

Tariff policy reversed again? Be careful on Friday.Yesterday, Trump and the US Trade Court ruled that the US International Trade Court had stopped the tariff policy. Gold once fell to a low of 3245, while the US dollar rushed all the way to a high of 100.5. Then it reversed, and gold began to rectify and rise. As of now, it has once touched a high of 3330, close to a rebound of $85.
Today, it reversed again. The US Court of Appeals allowed Trump's tariff policy to continue to take effect temporarily. And impose tariffs on most areas of the global economy, including allowing tariffs of up to 15% within 150 days to address trade imbalances with other countries. Compared with the tariff policy that was deemed illegal this week, this step is more legally defensible.
Looking at the current gold, it is likely that gold will fall sharply today. After gold fell yesterday, everyone wanted to short gold, but gold rebounded all the way.
So, today, Friday, is an opportunity for short-selling strategies. The short positions have been eliminated, so gold has every reason to fall, and it will fall sharply.
Once it falls below 3280 in the downward trend, it will test the low point of yesterday near 3250. If it breaks through 3250 again, it will go directly to the low point near 3200. The current short-selling strategy has little to do with technical analysis, it is completely a test of human nature.
