Gold is going down? Is the trend going to change?The previous rally continued in the early Asian session on Thursday, reaching a high of around 3345.
However, it then began to fall rapidly. So far, gold has fallen below the 3300 mark again, with the lowest point reaching around 3280.
From the daily chart:
Gold is currently at 3280, which is the moving average support position. If it falls below 3280, the market will test 3250-3260 below. This position is not only the current daily moving average support position, but also an important barrier position in the past. This is an important suppression position for the upward trend of gold this time.
Similarly, if it wants to fall, 3250-60 is also an important support position.
Secondly, let's look at the 4-hour chart:
If it really falls below the bottom of the range at 3280, then as I said above, it will test 3250-3260. However, if it fails to break the support near 3280, it is very likely to maintain consolidation in the 4-hour range.
And from the range point of view, the fluctuation range is very large. It is basically maintained in the range of 3320-3280, which is about 40 US dollars. I suggest that we should still pay attention to whether the support here at 3280 can stabilize. If it can stabilize at this position, and there is a bottom signal at 3280, then you can go long near 3280. Sell high and buy low according to the range of 3280-3320.
On the contrary, if it falls below the support of 3280, don’t go long. It is very likely to directly test the support position of 3250-60 later.
Xauusdsignal

5/22 Gold Trading SignalsGood afternoon everyone!
Yesterday's trading session was a bit bumpy, but in the end, we achieved considerable profits.
Today, gold rose to around 3346 and then began to pull back. It is now approaching the 3300 support level.
🔍 From a technical perspective, the candlestick structure and several indicators suggest that bears may still attempt further downside:
Primary support area: 3288–3276 — if this holds, a rebound is expected, with resistance around 3309–3316.
Secondary support area: 3263–3248 — if it breaks lower, watch for a short-term bounce around 3276-3282.
📰 On the news front, Initial Jobless Claims and PMI data will be released today. These could trigger short-term volatility.
📌 Trading strategy for today includes two key scenarios:
If the data is bearish for the dollar and gold drops to 3253, look for buy opportunities.
If the data is bullish and gold rises to 3358, it's a good spot to sell into strength.
📈 Today’s Trading Recommendations:
📉 Sell near 3358–3372 (Resistance zone)
📈 Buy near 3263–3248 (Support zone)
🔁 Flexible intraday levels: 3253 / 3268 / 3277 / 3286 / 3298 / 3309 / 3316 / 3328 / 3348
Wishing everyone a smooth trading day. Feel free to leave a comment if you have any questions—I’ll get back to you as soon as possible.

XAUUSD✅ Second Trade of the Day – XAUUSD
The second trade of the day comes from Gold (XAUUSD).
Just like BTC, gold has shown strong bullish momentum in recent days. I’m looking to take advantage of this minor pullback within the broader uptrend — a classic continuation setup on the 15-minute chart.
🔍 Trade Details:
✔️ Timeframe: 15-Minute
✔️ Risk-to-Reward Ratio: 1:2
✔️ Trade Direction: Buy
✔️ Entry Price: 3330.72
✔️ Take Profit: 3341.37
✔️ Stop Loss: 3325.42
🔔 Disclaimer: This is not financial advice. I'm simply sharing a trade I'm personally taking based on my own system, strictly for educational and illustrative purposes.
📌 If you're interested in a more systematic and data-driven trading approach:
💡 Follow the page and enable notifications to stay updated on future trade setups and advanced market insights.

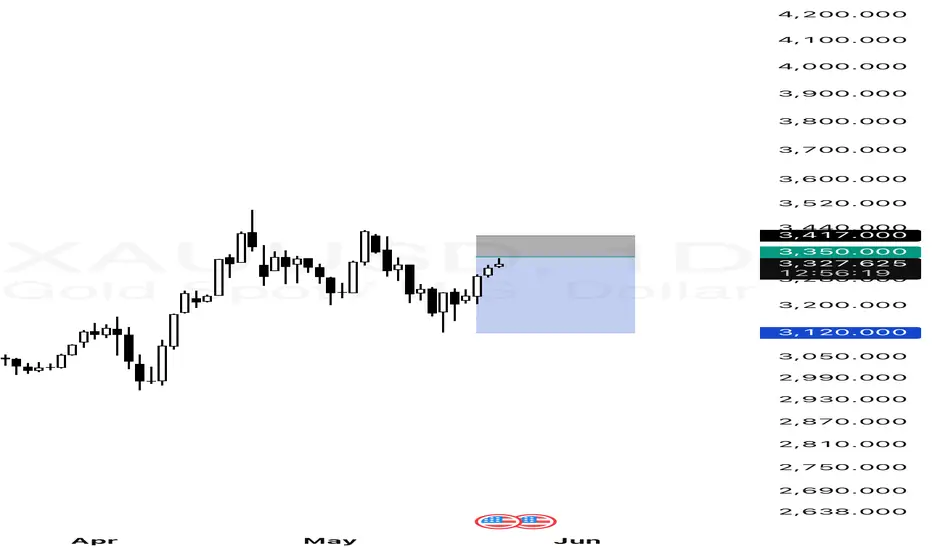
Gold Short Setup: Selling Into Strength at Key Supply ZoneI’m eyeing a high-probability setup on XAUUSD (Gold) based on clean price action and structure on the daily timeframe. After a strong bullish push from the recent lows around 3,120, price has formed a clear bullish engulfing structure, breaking short-term resistance levels.
The market has now entered a key supply zone (highlighted in grey), where previous price action saw sharp rejections. I’ve placed my sell limit just below 3,350, targeting a return toward the 3,120 zone, where strong demand previously stepped in. My stop-loss is placed above the recent swing high, giving this trade a favorable risk-to-reward ratio.
This trade idea is built on the expectation of a short-term correction or rejection from this supply area, aligning with market structure and historical reaction zones. I’ll be monitoring price closely for any signs of weakness like bearish candlestick confirmations within the zone.
Gold consolidates. Changing trend?Asian market: Gold continues to rise, and the current highest is near the high of $3345.
The next trend is very critical, let's look at it from the 4-hour chart.
It can be seen that there is absolute suppression at $3340. It is just near the top of the trend line, and it is difficult to break through directly.
Therefore, it will definitely be maintained near $3340 for consolidation in the future.
In addition, from the 1-hour chart:
I think the most critical bottom support position today is $3315. As long as gold is above this point, it will be in a consolidation and rise, or it will be maintained at $3315-3340 for consolidation. The position above that needs to be paid attention to is near $3350. Once it breaks through $3340 and stabilizes above $3350, gold may rise further to test $3360-3370.
However, if gold falls below $3315, it may trigger a sharp decline.
Operation strategy:
I suggest you focus on the fluctuation range of 3315-3340 USD and buy low and sell high.
However, it should be noted that once the upper or lower range is broken, you should be alert to the possible trend change.

Bullish AB=CD Pattern on XAUUSD – PRZ at 3142–3172This chart shows a clear Bullish AB=CD pattern forming on the daily timeframe of XAUUSD (Gold Spot).
In this setup:
The CD leg equals AB in both length and time symmetry, forming a classic AB=CD structure.
The pattern completes in the Potential Reversal Zone (PRZ) between 3142 and 3172, where:
The CD leg extends to 113% of AB at 3172.58
A confluence of Fibonacci projections (including 200% extension of BC) enhances the significance of 3142.23
The price reacted from the PRZ, hinting at a potential bullish reversal.
🔹 Key Technical Levels:
PRZ (Potential Reversal Zone): 3142 – 3172
AB = CD Completion: Near 3172
200% BC Extension: 3142
🎯 Trade Idea:
Entry Zone: Between 3142 – 3172
Stop Loss: Below 3140 (breakdown invalidates the structure)
Target 1: 3311 (61.8% retracement of CD)
Target 2: 3365 (78.6% retracement of CD)
📌 Conclusion:
The AB=CD pattern is a powerful harmonic structure, especially when accompanied by Fibonacci confluence. As long as price holds above the PRZ, a bullish move toward 3311 and 3365 remains likely. A break below 3140 would negate this idea.

Is the gold price far from 3,400?Information summary:
The trade war is a continuous war, and it has just begun. During Trump's four years in office, trade conflicts will continue to occur. Trade conflicts are means, not ends. The goal of the United States is to transfuse blood to its own economy through trade negotiations.
In addition, US inflation fell to a historic low of 2.3% in April. The Federal Reserve has not cut interest rates on the grounds that inflation will rebound. The Federal Reserve can't hold on for long. Cutting interest rates is the only antidote to boost the economy, and it is also a special medicine.
Next, once the Federal Reserve releases the wind of interest rate cuts, the market's risk aversion will be ignited again. In June, 6 trillion US bonds will mature. Regardless of the result this time, market sentiment will be worried, which is the key to driving price fluctuations.
Market analysis:
The 1-hour gold price broke through yesterday's high of $3,320. The previous pressure formed a new top-bottom conversion position, and the strong market was only a small correction in the middle. There is no need to worry about whether it will peak, but there must be a standard for judging the peak; this standard is: breaking the support position before the last decline, and the second rebound does not set a new high.
Operation strategy:
Go long when the price falls back to around $3,330, stop loss at $3,320, and profit range at $3,365-3,380.

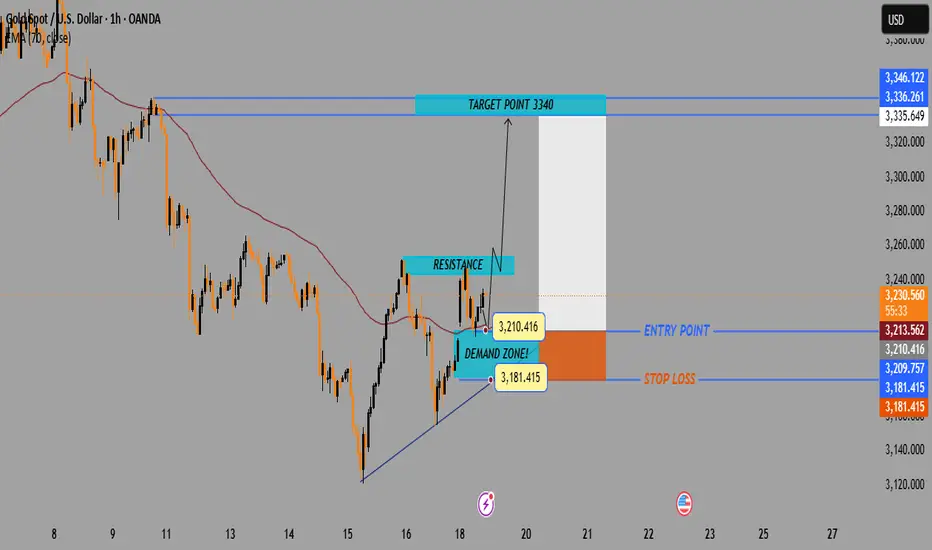
Gold 1-Hour Breakout Play • 3 210 3 340 • R : R 1 : 4🔍 Quick Chart Take
* 📉 Overall trend: down (still under the 200-MA)
* 🔺 Pattern forming: ascending triangle / wedge ➡️ potential breakout
📦 Zones
* 🟢 Demand / Entry: 3 181 – 3 210
* 🚧 Resistance cap: 3 235 – 3 250
* 🎯 Target: 3 340
⚔️ Trade idea
* ✨ Long at 3 210
* 🛑 Stop-loss 3 181
* 🏆 Take-profit 3 340
* 📏 R : R ≈ 1 : 4
👀 Watch for
* ✅ 1-h close above 3 250 ➡️ breakout confirmed
* ❌ Break of rising trendline or dip under 3 181 ➡️ idea dead
* 🗓️ Upcoming USD news (flag icon) & Dollar Index moves
🔑 Bottom line: Bullish pop inside a bigger bear trend—momentum play, keep the stop tight!
XAU USD NEXT POSSIBLE MOVE WITH SO MUCH UP AND DOWNIn hourly time frame it takes rejection and after opening session we can see two scenarios...
After opening new session if it comes down then tgt: 3385, from here have 90% chances to reverse for tgt: 3340, if it will not reverse and continue down side then we can go for the tgt:3275 to 3209

As gold's rally stalls, do bears have a chance?Technical aspect:
Gold is currently fluctuating in a narrow range around 3310, and the short-term direction is not clear. However, the rebound potential is relatively weak, but for the London market, gold's willingness to retreat is not strong; however, from a technical perspective, the current gold structure is still biased towards bulls, and gold still has the potential to continue to rebound to the area around 3330, or even the area around 3350;
However, after the rise of gold stagnates, we still cannot aggressively chase gold in trading, one is to prevent technical retracement after the sharp rise of gold; the other is to prevent the retracement of gold in order to grab liquidity after the rise of gold stagnates. In the short term, the support area we must pay attention to is in the 3285-3275 area, followed by the 3260-3250 area. If gold cannot break through the 3320-3330 area in the short term, gold may still continue to test the support area.
Trading strategy:
1. If gold still cannot effectively break through the area around 3320 in the short term, you can consider trying to short gold in small quantities around 3310-3320; TP: 3280-3270, set up protection to prevent gold from continuing to rise to 3330 or even 3350;
2. Consider going long on gold when gold retreats to the 3285-3280 area, set up protection to prevent gold from continuing to retreat to the 3260 area.

7 Gold Trades That Banked Over $2,500 LAST WEEK – Steal My StratMy strategy is straightforward: I trade order blocks, target premium/discount zones, and capitalize on liquidity sweeps. When these three signals align on the chart, I enter without hesitation.
Gold triggered a strong reaction off a bullish order block at $3192-3120 after forming it on May 15th( also can be seen as STB), confirming a robust uptrend and a global reversal from a deep discount zone( can be seen on 4h time frame). For the bullish momentum to solidify, price must break and close above $3250
So i will keep an eye on GOLD chart and prefer long trader to shorts

5/21 Gold Trading SignalsGood afternoon, everyone!
In yesterday’s trading, our buy-side positions performed well, but unfortunately, sell orders around 3280 weren't closed in time, resulting in a partial loss of profit.
Today, gold has shown impressive strength, breaking above the 3300 level and forming an irregular inverse head-and-shoulders pattern. Technically, this implies further upside potential.
🔍 Based on price action and technical patterns, this rally could extend beyond 3330, and even test 3350+. However, the 3346–3369 zone marks a strong resistance band, making it an ideal zone for medium-term selling opportunities.
📉 On the downside, we identify the first major support at 3278, followed by the 3261–3246 zone.
📰 On the news front, several Fed officials expressed economic concerns in speeches early this morning. Meanwhile, reports of Israel preparing to strike Iran’s nuclear facilities fueled safe-haven demand, pushing gold strongly back above the 3300 mark.
📌 Today's Trading Strategy:
Sell between 3346–3373 (consider scaling in)
Buy between 3260–3243
Flexible trading in the zones: 3338 - 3326 - 3318 -3309 -3298 - 3288 - 3272
Lastly, a heartfelt thought:
Living in a peaceful country like China, it's truly heartbreaking to see so many innocent children suffering or even losing their lives due to war. Let us hope for peace soon—so all people may live safely, freely, and happily.

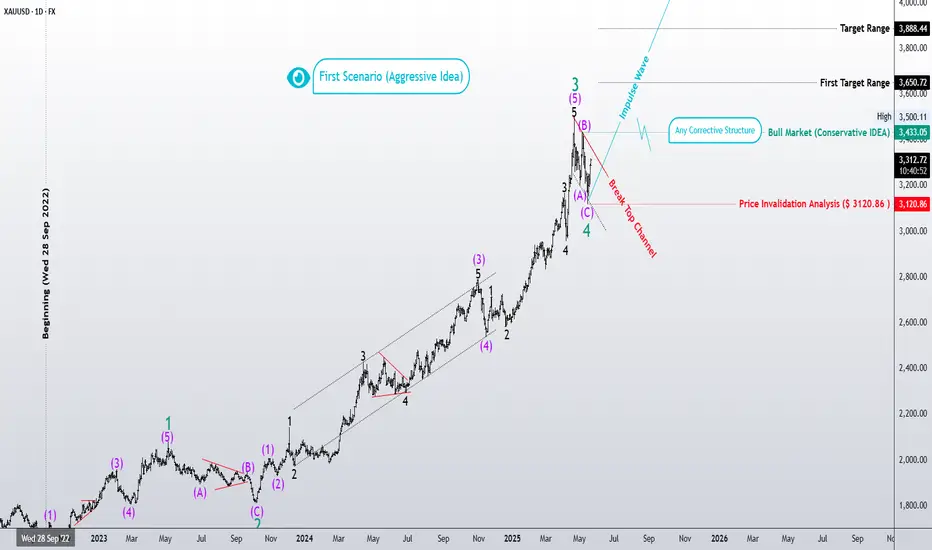
“Gold Surfer – Is Wave 5 About to Begin?”📈 This daily Elliott Wave analysis of the gold market (XAUUSD) tracks the impulsive advance from the September 2022 low ($1614). We now stand at a critical juncture: has Wave 4 completed, opening the path for Wave 5?
🔹 **Aggressive Scenario:** If the correction (ABC) is over, a new bullish Wave 5 could take gold first toward the $3884 zone, and potentially to expanded targets of $4126–$4275.
🔹 **Conservative Scenario:** If the correction continues, alternate patterns (flat, triangle, or complex correction) may still unfold. However, as long as price holds **above $3120**, the bullish wave structure remains valid.
🔻 **Invalidation Level:** $3120.86
🟢 The wave structure so far aligns with Elliott’s classic principles, and the bullish momentum still has room to unfold.
– Patterns whisper. I listen.
– Mr. Nobody 🎧📊
Inverse H&S + Triangle = Gold’s Perfect Setup for a BreakoutAs I expected in my previous idea , Gold ( OANDA:XAUUSD ) started to rise after a correction and made another attack on the Resistance zone($3,280-$3,245) .
Gold is currently moving near the Resistance zone($3,280-$3,245) and Yearly Resistance (2) .
If we look at the Gold chart from a Classic Technical Analysis perspective, two Classic Patterns are clearly visible.
1- Inverse Head and Shoulders pattern , which is a good sign for a Resistance zone($3,280-$3,245) breakout.
2- Symmetrical Triangle Pattern is also a sign of a continuation of the recent bullish trend
In terms of Elliott Wave theory , Gold seems to have completed the corrective waves , and we can expect the start of an impulsive wave . Breaking the Resistance zone($3,280-$3,245 ) can be a good sign for the start of an impulsive wave and a gold pump .
I expect Gold to trend higher in this week , and the first sign could be a break of the Resistance zone($3,280-$3,245) . The targets are clear on the chart.
Note: If Gold touches $3,179 , we should expect a drop.
Gold Analyze ( XAUUSD ), 1-hour time frame.
Be sure to follow the updated ideas.
Do not forget to put a Stop loss for your positions (For every position you want to open).
Please follow your strategy; this is just my idea, and I will gladly see your ideas in this post.
Please do not forget the ✅' like '✅ button 🙏😊 & Share it with your friends; thanks, and Trade safe.

May 19. Trading opportunities in the London market.A new week of trading opportunities is about to begin.
There is a lot of news over the weekend. There is an increase in geopolitical uncertainty. This is undoubtedly a heavy news. At the same time, the instability of tariffs makes the trend of XAUUSD even stronger.
The current price around 3230 needs to be tested to see if it stabilizes. If not, choose a lower position to buy. If the current price can stabilize, buy directly.
Target 3245-3250
Share at least 4-5 accurate trading signals for trading every day.
More operating opportunities. Lower risk. Greater profit.
If you don’t know how to trade. Follow me.

XAUUSDGold kicks off the week with a strong bullish move — and the same applies to BTC, which is now getting very close to its all-time high.
Gold is also showing impressive strength, so despite being on a lower time frame, I’ve decided to activate a Buy position on XAUUSD.
🔍 Trade Details:
✔️ Timeframe: 15-Minute
✔️ Risk-to-Reward Ratio: 1:1.50
✔️ Trade Direction: Buy
✔️ Entry Price: 3308.62
✔️ Take Profit: 3315.25
✔️ Stop Loss: 3304.20
🔔 Disclaimer: This is not financial advice. I'm sharing a trade I'm personally taking based on my own strategy, strictly for educational and illustrative purposes.
📌 If you're interested in a systematic and data-driven approach to trading:
💡 Follow the page and enable notifications to stay updated on future setups, analysis, and strategic insights.

XAUUSD DESCENDING CHANNEL IN 15MXAUUSD CHART ANALYSIS IN 15M
Price Movement
The chart shows a descending channel (highlighted in blue), indicating a downtrend.
Gold price has been making lower highs and lower lows, consistent with a bearish pattern
Trend Analysis
The channel indicates that sellers are in control, pushing prices gradually lower.
Until there’s a breakout above the upper boundary of the channel, the bias remains bearish.

Gold is on bull or bear, let's see how it goes? {21/05/2025}Educational Analysis says that XAUUSD may give countertrend opportunities from this range, according to my technical analysis.
Broker - Pepperstone
So, my analysis is based on a top-down approach from weekly to trend range to internal trend range.
So my analysis comprises of two structures: 1) Break of structure on weekly range and 2) Trading Range to fill the remaining fair value gap
Let's see what this pair brings to the table for us in the future.
Please check the comment section to see how this turned out.
DISCLAIMER:-
This is not an entry signal. THIS IS FOR EDUCATIONAL PURPOSES ONLY.
I HAVE NO CONCERNS WITH YOUR PROFIT OR LOSS,
Happy Trading, Fx Dollars.

Ready to Rob the Gold Market? XAU/USD Heist Plan Revealed!🌟 Gold Heist Masterplan: XAU/USD Profit Raid 🚀💰
Thieves and profit hunters! 🤑 Ready to raid the XAU/USD gold market? This *Thief Trading Style* fuses sharp technicals with key fundamentals for a slick long-entry plan targeting the high-stakes Red Zone. Let’s grab those gains! 📈🎯
**Entry Plan 📈**
Strike when the breakout hits! Watch for a Moving Average crossover at 3380.00 to jump in for bullish profits. 🔔
- Set *buy stop orders* above the MA for breakout trades.
- Prefer pullbacks? Place *buy limit orders* at recent swing low/high on 15M or 30M timeframes.
📌 *Tip*: Set a chart alert to catch the breakout candle in action! 🚨
**Stop Loss 🛑**
Guard your stash with a *Thief SL* at the recent 4H swing low/high (3200.00).
Tweak your SL based on risk tolerance, lot size, and open orders. Stay alert! 🔍
**Profit Target 🎯**
Aim high for 3680.00, or lock in gains early to avoid overplaying your hand. Stay disciplined! 💪
**Scalper’s Edge 👀**
Scalpers, stick to quick long-side trades. Big players can dive in now; smaller traders, ride the swing with a trailing SL to secure profits. 💰
**Market Pulse 💵**
XAU/USD is charging bullish, driven by macro trends, COT data, sentiment, quantitative signals, and intermarket flows. Keep your eyes on fast-moving fundamentals! 🌎📊
**Latest Market Snapshot (UTC+1, May 21, 2025)**
- *Forex (XAU/USD)*: Hovering around 3155.00, testing key 200-day SMA support after a 2%+ sell-off.
- *COT Report (May 16, 2025)*: Non-commercial net long positions up by 5,200 contracts, reflecting strong bullish sentiment among speculators.
- *Commodities & Metals*: Gold stabilizing near monthly lows; oil prices steady, supporting commodity-linked currencies.
- *Indices & Crypto*: Risk-on sentiment in global indices aligns with bullish XAU/USD bias; crypto inflows up $785M last week.
**Trading Caution 📰**
Steer clear of new trades during major news to avoid volatility spikes.
Use trailing stops to protect open positions and lock in profits. 🚫
**Power Up the Heist! 💥**
Smash that Boost Button to fuel our trading crew! 🤝 With the *Thief Trading Style*, we’re snatching profits daily. Watch for the next plan! 🐱👤🚀
Happy trading, and let’s stack that cash! 💸🎉

GOLD: Look To Buy After The RetracementPrice is showing bullish structure on M15/H1/H4. Price is tapping into a H4 bearish supply zone 3295-3310 so we may see a retracement to fill some imbalances or retest demand.
Possible Buy Limit Zones: 3275-3280 or 3251-3245
Set those alerts!

Gold Gains on US Credit Downgrade, Tax RiskTVC:GOLD OANDA:XAUUSD Gold (XAU/USD) surged to a one-week high of $3,306 on Tuesday, fueled by rising concerns over the U.S. economic outlook. The metal benefited from a weaker dollar, following Moody’s downgrade of the U.S. credit rating and renewed fears over President Trump’s proposed tax cuts, which could add $3–5 trillion to the national debt. Global risk sentiment also took a hit, with ongoing U.S.-Japan trade tensions and muted progress in U.S.-China talks.
Technically, gold is approaching key resistance at $3,306. A firm breakout above $3,306 would signal bullish continuation, while short-term support lies at $3,288 and $3,240. The RSI around 60 suggests consolidation may precede another push higher.
With central banks citing U.S. policy uncertainty and geopolitical risks lingering, gold’s safe-haven appeal remains intact.
Resistance : $3,306 , $3,364
Support : $3,288 , $3,240

XAUUSD Chart 4H Analysis BUY GoldXAUUSD Chart 4H Analysis BUY Gold Doesn't Have To Be Hard Profit Surging!
The provided XAUUSD (Gold Spot/U.S. Dollar) 4-hour chart outlines a structured technical setup with clearly defined entry points, retracement zone, and multiple take-profit (TP) targets.
The current price at the time of analysis is **$3,198.67**, with the potential for a bullish continuation upon confirmation within the valid setup zone. Let’s break this down in detail:
**Current Price and Entry Strategy**
* **Current Price:** $3,198.67
* **Recommendation:** Look for better entry around or near the green support zone. The setup is bullish-biased, suggesting a buy-on-dip opportunity.
* **Support/Invalidation Zone:** If the price **closes below the green zone**, the setup will be **invalidated**. Hence, risk management and confirmation are crucial before taking any position.
**Target Levels Identified**
Three Take-Profit (TP) levels are established in the chart, each indicating potential upward momentum if the price respects the support and begins to rise again:
* **TP1: $3,220.67**
✔️ Gain of **22 USD (220 pips)** from current price
✔️ Represents an initial move post-entry confirmation
✔️ Ideal for short-term scalpers or conservative traders
* **TP2: $3,252.67**
✔️ Gain of **54 USD (540 pips)** from current price
✔️ Mid-level target indicating strong bullish continuation
✔️ Can be a good point for partial profit booking
* **TP3: $3,284.67**
✔️ Gain of **86 USD (860 pips)** from current price
✔️ Long-term or full swing trade target
✔️ Represents full bullish momentum with higher reward-to-risk ratio

5/20 Gold Trading SignalsGood afternoon, everyone!
Last Friday and yesterday, gold did not reach our primary buy or sell zones, instead moving within a narrow range. We captured two trades, gaining about $32 in total movement, resulting in moderate but stable profits.
After opening today, the price pulled back toward the 3200 area, which holds technical support. However, resistance remains dense above, especially between 3226 and 3243. For bulls to break through, stronger momentum and volume will be required.
On the news front, there are no major economic events or key speeches scheduled today, so technical trading will dominate.
Currently, gold continues to consolidate. If intraday volatility remains limited, traders can look to buy low and sell high within the 3243–3189 range. Watch for resistance around 3226 and support at 3198 as key technical levels.
📌 Trading Strategy for Today:
🟢 Buy Zone: 3189 – 3168 (Near support, suitable for bottom fishing)
🔴 Sell Zone: 3267 – 3288 (Close to resistance, good for shorting)
🔄 Scalping/Flexible Zones:
▫️3198-3218-3226-3238-3247-3255
📌 Note: Maintain proper position sizing, set clear take-profit/stop-loss levels, and stay flexible. If there's unexpected news or a breakout during the U.S. session, strategies will be adjusted accordingly.
