Gold Recovers After Dip – Is a New ATH Next?After reaching its recent all-time high exactly one week ago, Gold began a correction, dropping to $3,000, where buyers stepped in. This led to a recovery, pushing the price above a key resistance zone at $3,025–$3,030.
At the time of writing, the price is sitting at the upper boundary of this support zone. If it stabilizes above this level, a new ATH could be on the horizon.
I remain bullish as long as the daily close stays above this zone.
Disclosure: I am part of Trade Nation's Influencer program and receive a monthly fee for using their TradingView charts in my analyses and educational articles.
Xauusdsignals

XAUUSD:The price of gold has risen strongly once againYesterday's oscillatory price action for market cleansing and the continuous intensification of recent US tariff policies have once again stoked up the global risk sentiment. Coupled with the continuous increase in gold holdings by global physical gold-invested institutional ETFs, the bullish sentiment has propelled the price of gold to climb steadily.
The opening of today's morning session has once again maintained the strong momentum and kept breaking historical records. Currently, in terms of trading strategies, it is advisable to mainly go long on pullbacks. Pay attention to the resistance level near the trend line at around 3080 on the upside. When the price reaches below 3080 for the first time, a short position can be taken.
XAUUSD Trading Strategy:
buy@3050-3055
TP:3070-3080
sell@3075-3080
TP:3055-3050
Get daily trading signals that ensure continuous profits! With an astonishing 90% accuracy rate, I'm the record - holder of an 800% monthly return. Click the link below the article to obtain accurate signals now!

Bollinger Bands Warning: Is Gold Losing Uptrend?Gold ( OANDA:XAUUSD ) has succeeded in creating a New All-Time High(ATH) as I expected in my previous post . Now, the question is whether Gold can continue its upward trend.
Gold is currently moving in the Resistance zone($3,058-$3,045) .
The upper and lower lines of the Bollinger Bands indicator also play the role of resistance and support well on the 1-hour time frame .
Also, we can see the Regular Divergence(RD-) between Consecutive Peaks( Bollinger Bands indicator and Price ).
Educational Note : A divergence forms when the price chart and the indicator behave in contrast to each other. Divergence sell signals mostly form at the end of an upward trend, where the price chart forms a peak above the Bollinger upper band and another peak after, below the upper band. These signals are considered negative Regular Divergences(RD-) , hinting at a potential market reversal and a downward trend.
In terms of Elliott Wave theory , I think the main wave 4 is NOT yet complete, and we can expect another corrective wave .
I expect Gold to bearish trend in the coming hours and drop to at least $3,036 , with the next target being an attack on the Support zone($3,032-$3,021 ) .
Note: If Gold goes above $3068.29, we should expect more Pumps.
Gold Analyze ( XAUUSD ), 1-hour time frame.
Be sure to follow the updated ideas.
Do not forget to put a Stop loss for your positions (For every position you want to open).
Please follow your strategy; this is just my idea, and I will gladly see your ideas in this post.
Please do not forget the ✅' like '✅ button 🙏😊 & Share it with your friends; thanks, and Trade safe.

XAUUSD:End-of-Session Trading StrategyToday, gold experienced a shakeout after a period of volatility and made a strong assault on 3060. The trading idea for the end of the trading session is now extremely clear. We have chosen to enter a short position for the second time below the previous historical high range of 3055-57. The short positions established at 3052-55 have currently retreated to around 3035 at the lowest. Since there has been a pullback from the high level, it indicates that the bullish momentum is not that strong. There has been no decisive breakthrough in one go, and the probability of breaking through 3055 tonight is gradually decreasing. It is highly likely that the gold price will consolidate within the range of 3030-50 at the end of the trading session. When the price pulls back to around 3031-33 at the lower end, one can reverse the position and enter a long position, with a stop-loss set at around 3025. Once there is another rebound to around 50-52, a short position can still be taken. The key focus is on the closing price tonight.
XAUUSD Trading Strategy:
sell@3055-3060
tp:3040-3030
sell@3031-3033
tp:3045-3055
Get daily trading signals that ensure continuous profits! With an astonishing 90% accuracy rate, I'm the record - holder of an 800% monthly return. Click the link below the article to obtain accurate signals now!

GOLD (XAUUSD): New ATH Soon?!
I see a bullish accumulation pattern - the ascending triangle formation
on Gold on a daily.
In a strong uptrend, such a pattern usually indicates a highly probable
bullish continuation.
The main focus now is on the underlined blue resistance based on a current ATH.
Its breakout and a daily candle close will open a potential for much more growth.
Next resistance will be 3100.
❤️Please, support my work with like, thank you!❤️
I am part of Trade Nation's Influencer program and receive a monthly fee for using their TradingView charts in my analysis.

GOLD Bullish Breakout!
HI,Traders !
GOLD was trading
Beneath the falling
Resistance line but now
We are seeing a bullish
Breakout, pullback and a
Rebound so we are locally
Bullish biased now and we
Will be expecting a further
Local bullish move up !
Comment and subscribe to help us grow !

XAUUSD:Gold trade profitable, keep shortingToday, gold is still oscillating repeatedly within a range. We adhere to the strategy of short - selling at high levels. The short - selling signals in the range of 3032 - 3035 were directly and publicly indicated in the article.
We reaped profits as the gold price declined again.
The bullish sentiment for gold is not strong. Wait for a rebound and then continue to short.
XAUUSD Trading Strategy:
sell@3030-3035
TP1:3010
TP2:3000
Get daily trading signals that ensure continuous profits! With an astonishing 90% accuracy rate, I'm the record - holder of an 800% monthly return. Click the link below the article to obtain accurate signals now!

Gold signal: buy at 3021-3016Gold has a second chance to rise, so you can continue to go long. Pay attention to the resistance near the previous high of 3035-3038. If you can't break through, close the order in time. If you break through, 3042-3046 will be a short-term strong resistance level.
If the price falls, I personally think that the support will give priority to 3016-3011, followed by 3007

Gold Likely to Extend Decline Toward the 2995-2985 ZoneGold encountered resistance and pulled back after reaching around 3026 during the rebound, failing to break the descending channel effectively. In the short term, bearish momentum remains dominant. On the daily chart, gold has closed with three consecutive bearish candlesticks, it weakens rebound expectations and suggests further downside remains possible.
The key short-term level to watch is around 3010. If gold breaks below this level during the pullback, the downtrend structure will become more pronounced. This would likely lead to another test of the 3000 level, with further downside potential extending toward the 2995-2985 range.
I remain committed to shorting gold on rebounds. My primary plan is to enter short positions within the 3020-3030 range. I will make more detailed trading plans and trading signals every day according to the real-time market situation, which is also the testimony of every successful transaction and profit of mine; the article has a certain lag, if you want to copy the trading signals to make a profit, or master independent trading skills and thinking, you can choose to join the channel at the bottom of the article

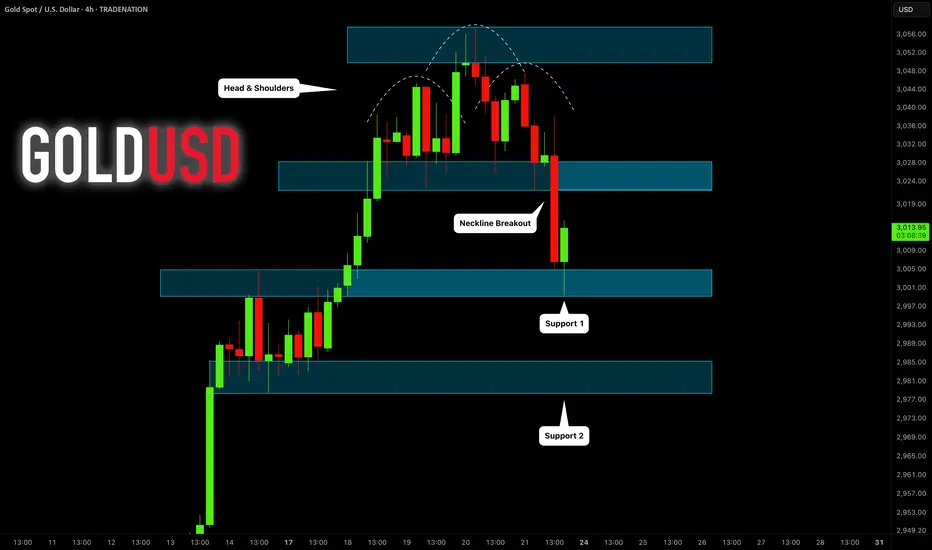
Gold’s Bearish Setup – What’s Next for $XAUUSD?Gold ( OANDA:XAUUSD ) fell to $3,003 as I expected in my previous post . Of course, since this is a round number , we can expect good support .
In terms of Classic Technical Analysis , Gold appears to have succeeded in breaking the neckline of the two patterns , the Head and Shoulders Pattern and the Three Falling Peaks Pattern .
Educational Note : The Three Falling Peaks is a bearish reversal pattern that occurs after an uptrend, where the price forms three consecutive lower peaks. Each peak represents a failed attempt to continue the uptrend, signaling weakening bullish momentum. A breakdown below the support confirms the pattern and signals a potential downtrend.
In terms of Elliott Wave theory , it seems that Gold has completed 5 impulsive waves and we should wait for corrective waves .
I expect Gold to attack the $3,000 at least once more after completing the pullback , and the next target could be the Support zone($2,989-$2,976) .
Note: If Gold goes above $3,039, we should expect more pumps.
Gold Analyze ( XAUUSD ), 1-hour time frame.
Be sure to follow the updated ideas.
Do not forget to put a Stop loss for your positions (For every position you want to open).
Please follow your strategy; this is just my idea, and I will gladly see your ideas in this post.
Please do not forget the ✅' like '✅ button 🙏😊 & Share it with your friends; thanks, and Trade safe.

The rebound presents a perfect opportunity to short gold.📍Gold has once again rebounded to the 3020-3025 range in the short term. You might think the bulls have regained control, but I see this rebound as a prime opportunity to short gold.
📍Currently, a new descending channel has formed within gold’s short-term structure. Despite multiple rebound attempts, the price has failed to break above this channel, further reinforcing its downward pressure. Additionally, on the daily chart, gold has printed three consecutive bearish candlesticks, undermining bullish sentiment and weakening confidence. This has also diminished the effectiveness of the 3000 support level, increasing the likelihood of further downside.
🔎Trade Idea:
Xauusd: Sell at 3015-3025
TP:3005-2995
SL:Adjust according to risk tolerance.
📩Trading means that everything has results and everything has feedback. I have been committed to market trading and trading strategy sharing, striving to improve the winning rate of trading and maximize profits. If you want to copy trading signals to make a profit, or master independent trading skills and thinking, you can follow the channel at the bottom of the article to copy trading strategies and signals

The downward channel appears, or there will be a deep callback📍Gold's current upward momentum appears weak, with signs of a descending channel forming in the short-term technical structure. If gold fails to decisively break through the 3015-3025 resistance zone, it will confirm and reinforce the descending channel pattern, exerting further technical pressure on the metal.
📍Moreover, if gold breaks below the critical 3000 level during its decline, it would severely undermine bullish confidence, triggering further downside. In this scenario, the downside potential would expand, with gold likely extending its decline toward the 2990-2980 support zone.
🔎Trade Idea:
Xauusd: Sell at 3015-3025
TP:3005-2995
SL:Adjust according to risk tolerance.
📩Trading means that everything has results and everything has feedback. I have been committed to market trading and trading strategy sharing, striving to improve the winning rate of trading and maximize profits. If you want to copy trading signals to make a profit, or master independent trading skills and thinking, you can follow the channel at the bottom of the article to copy trading strategies and signals

XAUUSD, Expecting sell now XAUUSD, I am expecting Gold sell now at the price 3015, with the targets of 3004 & 2992 area respectively,
good luck

Bearish Bias Under Head and Shoulders Formation📍Gold is currently leaning towards a bearish trend under the pressure of a well-defined head and shoulders pattern. Therefore, our primary trading approach remains focused on short positions.
📍In the short term, the key resistance to watch is in the 3030-3040 zone. However, it's worth noting that on Friday, gold quickly recovered most of its losses after testing the 3000 level, indicating the presence of strong buying interest and solid support below.
📍From a trading perspective, there is still an opportunity to capture profits from potential technical rebounds. The main support levels to monitor are:
📌3010-3000 as the initial support zone
📌2995 as the secondary support level
🔎Trade Idea:
1. Xauusd: Sell at 3035-3045
TP:3020-3010
SL:Adjust according to risk tolerance.
📎But if gold shows signs of holding support, a short-term rebound could provide opportunities for counter-trend trades.
2. Xauusd: Buy at 3015-3005
TP:3025-3035
SL:Adjust according to risk tolerance.
📩Trading means that everything has results and everything has feedback. I have been committed to market trading and trading strategy sharing, striving to improve the winning rate of trading and maximize profits. If you want to copy trading signals to make a profit, or master independent trading skills and thinking, you can follow the channel at the bottom of the article to copy trading strategies and signals

Gold: Trading signals during the European sessionGold is now making its first attempt at resistance. In this process, we can use the black trend line below and the purple trend line as reference support.
If the price does not actually fall below the test, there is a high probability that it will reach the 3037-3044 area. Therefore, during the European trading period, the 3037-3044 area can be used as an opportunity to enter the short position.
At the same time, pay attention to the long opportunities brought by the support area. For conservative trading, the area near 3025 can be used as an entry time.

XAUUSD The 4H MA50 makes all the difference.Gold (XAUUSD) is so far maintaining its long-term bullish trend and will continues to do so even on the short-term, as long as it holds the 4H MA50 (blue trend-line). There are three different Channel Up patterns involved and as long as the 4H MA50 holds, the (dotted) short-term Channel targets 3080 at least.
If the price breaks below the 4H MA50 and the dotted Channel Up, it would be best to close any buys and short instead, targeting the 4H MA200 (orange trend-line) at 2960. It has to be said that every time the 4H RSI traded downwards as it has since Wednesday, a stronger pull-back to the bottom of the long-term Channel Up took place, so that has to favor 2960.
-------------------------------------------------------------------------------
** Please LIKE 👍, FOLLOW ✅, SHARE 🙌 and COMMENT ✍ if you enjoy this idea! Also share your ideas and charts in the comments section below! This is best way to keep it relevant, support us, keep the content here free and allow the idea to reach as many people as possible. **
-------------------------------------------------------------------------------
Disclosure: I am part of Trade Nation's Influencer program and receive a monthly fee for using their TradingView charts in my analysis.
💸💸💸💸💸💸
👇 👇 👇 👇 👇 👇

GOLD (XAUUSD): Support & Resistance Analysis For Next Week
Here is my latest support & resistance analysis
for Gold for next week.
Consider these structures for pullback/breakout trading.
❤️Please, support my work with like, thank you!❤️
I am part of Trade Nation's Influencer program and receive a monthly fee for using their TradingView charts in my analysis.

XAUUSD/GOLD WEEKLY BUY PROJECTION 23.03.25Gold's recent bullish trend is largely driven by factors like geopolitical uncertainty, inflation concerns, and central bank actions, which lead investors to seek the perceived safety of gold as an asset.

GOLD (XAUUSD): Selling Now is HIGH RISK
The head & shoulders pattern that I spotted earlier
perfectly played out and we saw a strong bearish move after the
NY session opening.
HOWEVER, be extremely careful.
Many traders started to sell heavily, anticipating an extended bearish reversal.
For now the price nicely respected 3000 psychological support
that previously was a resistance.
I suggest not placing any short trades this week.
Let's wait till Monday and how the market opens.
❤️Please, support my work with like, thank you!❤️
I am part of Trade Nation's Influencer program and receive a monthly fee for using their TradingView charts in my analysis.
The bearish trend will continue📍Since the day before yesterday, I've been sincerely inviting everyone to watch the bear dance.Gold has decisively broken below the recent support zone at 3030-3026 and extended its decline to around 3021. Based on this price action, two key conclusions can be drawn:
1. 3057 is now confirmed as the current high.
2. Gold has successfully formed a head and shoulders pattern in the short term.
📍This indicates that bearish momentum remains strong and far from exhausted. Under the pressure of structural resistance, gold is likely to continue testing lower support levels around 3010-3000, with a possible extension toward 2995.
🔎Trade Idea:
Xauusd: Sell at 3035-3045
TP:3015-3005
SL:Adjust according to risk tolerance.
📩Trading means that everything has results and everything has feedback. I have been committed to market trading and trading strategy sharing, striving to improve the winning rate of trading and maximize profits. If you want to copy trading signals to make a profit, or master independent trading skills and thinking, you can follow the channel at the bottom of the article to copy trading strategies and signals

Watch as the bears are about to dance!📍Bros, we must pay attention to the 3040-3050 area next. If gold cannot break through this area during the rebound, then the technical level may build a head and shoulders top structure, further stimulating the decline of gold. The market bullish factors for gold have all appeared. If there is no extra force to support the rise of gold, then the bears will fully wake up and may even go down to the 3020-3010 area.
📌So in terms of short-term trading, we can try to short gold in the 3040-3050 area.
🔎Xauusd:@3040-3050 Sell
📩Trading means that everything has results and everything has feedback. I have been committed to market trading and trading strategy sharing, striving to improve the winning rate of trading and maximize profits. If you want to copy trading signals to make a profit, or master independent trading skills and thinking, you can follow the channel at the bottom of the article to copy trading strategies and signals

XAU/USD "Gold vs U.S Dollar" Metals Market Heist Plan🌟Hi! Hola! Ola! Bonjour! Hallo! Marhaba!🌟
Dear Money Makers & Robbers, 🤑 💰💸✈️
Based on 🔥Thief Trading style technical and fundamental analysis🔥, here is our master plan to heist the XAU/USD "Gold vs U.S Dollar" Metals Market. Please adhere to the strategy I've outlined in the chart, which emphasizes long entry. Our aim is the high-risk Red Zone. Risky level, overbought market, consolidation, trend reversal, trap at the level where traders and bearish robbers are stronger. 🏆💸Book Profits Be wealthy and safe trade.💪🏆🎉
Entry 📈 : "The vault is wide open! Swipe the Bullish loot at any price - the heist is on!
however I advise to Place buy limit orders within a 15 or 30 minute timeframe most recent or swing, low or high level. I Highly recommended you to put alert in your chart.
Stop Loss 🛑:
Thief SL placed at the recent / nearest low level Using the 30mins timeframe (2984)
SL is based on your risk of the trade, lot size and how many multiple orders you have to take.
🏴☠️Target 🎯: 3048 (or) Escape Before the Target
🧲Scalpers, take note 👀 : only scalp on the Long side. If you have a lot of money, you can go straight away; if not, you can join swing traders and carry out the robbery plan. Use trailing SL to safeguard your money 💰.
XAU/USD "Gold vs U.S Dollar" Metals Market Heist Plan is currently experiencing a bullishness,., driven by several key factors.
📰🗞️Get & Read the Fundamental analysis, Macro Economics, COT Report, Sentimental Outlook, Positioning and future trend...
Before start the heist plan read it.👉👉👉
📌Keep in mind that these factors can change rapidly, and it's essential to stay up-to-date with market developments and adjust your analysis accordingly.
⚠️Trading Alert : News Releases and Position Management 📰 🗞️ 🚫🚏
As a reminder, news releases can have a significant impact on market prices and volatility. To minimize potential losses and protect your running positions,
we recommend the following:
Avoid taking new trades during news releases
Use trailing stop-loss orders to protect your running positions and lock in profits
💖Supporting our robbery plan 💥Hit the Boost Button💥 will enable us to effortlessly make and steal money 💰💵. Boost the strength of our robbery team. Every day in this market make money with ease by using the Thief Trading Style.🏆💪🤝❤️🎉🚀
I'll see you soon with another heist plan, so stay tuned 🤑🐱👤🤗🤩

How to Trade News!Heads up, everyone! The Federal Reserve's interest rate decision will be announced in one hour! Currently, gold is consolidating in a narrow range around the 3035 level. At this point, it's not advisable to enter short positions on gold just yet.
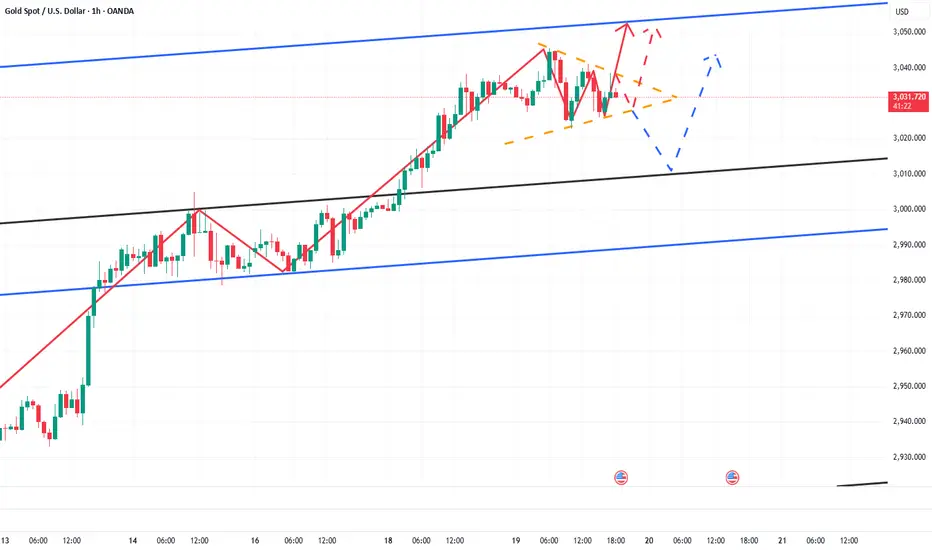
📍From a technical perspective, gold has formed an ascending triangle pattern. If it fails to break below the 3027-3025 support zone, the bullish momentum could persist, with an upside target in the 3045-3055 range. Therefore, it's best to hold off on aggressive short positions for now.
📍However, if gold, driven by the upcoming announcement, struggles to break above the 3045-3055 resistance area, 3045 may establish itself as a short-term top. In that scenario, short positions can be considered using the 3040-3050 zone as a resistance level.
🔎Xauusd:@3040-3050 Sell,TP:3030-3020;
📍On the other hand, if gold decisively breaks below the 3025-3020 support level, attention should be focused on the 3010-3000 range. Should gold find support and stabilize within this range, it may present a favorable opportunity to go long once again.
🔎Xauusd:@3010-3000 Buy, TP:3030-3040
📩Trading means that everything has results and everything has feedback. I have been committed to market trading and trading strategy sharing, striving to improve the winning rate of trading and maximize profits. If you want to copy trading signals to make a profit, or master independent trading skills and thinking, you can follow the channel at the bottom of the article to copy trading strategies and signals