Bears are about to revive, short gold!Gold has rebounded to around 3040 once again. It is undeniable that the risk of going long is gradually increasing. At this level, the primary strategy should be to avoid blindly chasing long positions in gold to mitigate the risk of a significant pullback.
Additionally, during the recent retracement, gold only briefly touched the 3023 level before rebounding. Given the insufficient depth of the pullback, this swift rebound suggests that gold may continue to test its short-term highs. Currently, there is no clear technical topping pattern, and the candlestick formations remain strong, indicating further upward potential. Gold could extend its gains toward the 3050-3060 range.
From a trading perspective, it may be prudent to consider short positions in the 3045-3055 range.Trading means that everything has results and everything has feedback. I have been committed to market trading and trading strategy sharing, striving to improve the winning rate of trading and maximize profits. If you want to copy trading signals to make a profit, or master independent trading skills and thinking, you can follow the channel at the bottom of the article to copy trading strategies and signals
Xauusdsignals

Short gold with 2930-2940 zone as resistanceBros, the situation in the Middle East is turbulent again! Gold took advantage of the trend and continued to rise to around 3028. Stimulated by the news, gold's rise was obviously abnormal and showed a disorderly rise! This kind of price rise is actually very dangerous, so we can't directly chase gold. According to my expectations, the highest price of gold will only reach around 3040, so I think shorting gold with 2930-2940 zone as resistance is the best trading opportunity at the moment.
However, in the short term, the correction of gold may be smaller than expected because the market is enthusiastic about going long. So the first thing we should pay attention to below is the 3005-2995 zone.
Trading means that everything has results and everything has feedback. I have been committed to market trading and trading strategy sharing, striving to improve the winning rate of trading and maximize profits. If you want to copy trading signals to make a profit, or master independent trading skills and thinking, you can follow the channel at the bottom of the article to copy trading strategies and signals

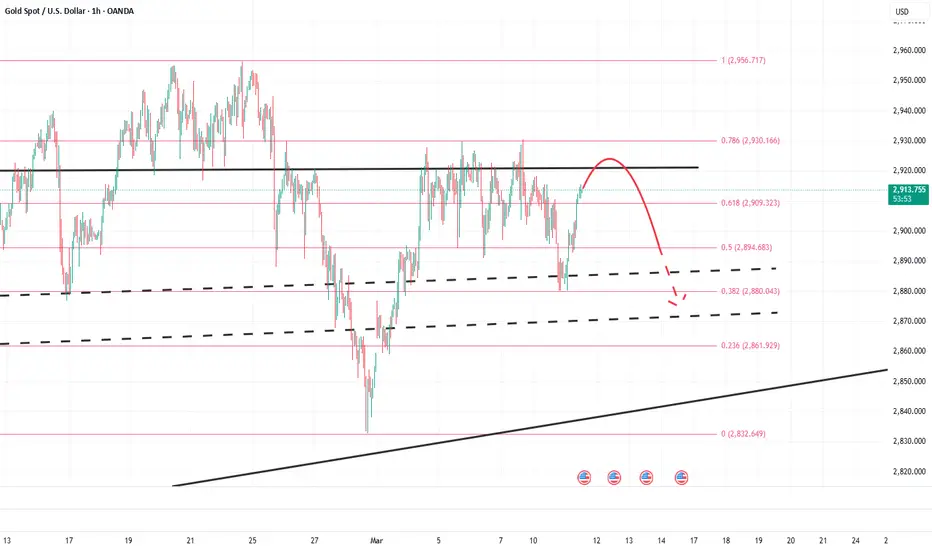
Has gold peaked? Long or short?Gold 1-hour chart has fallen from a high level, so it is difficult for gold to rise directly without news support in the short term. You can continue to short gold after it rebounds. If the Fed's interest rate decision does not rise sharply, then the idea of shorting gold at a high level will continue. Gold rebounds to observe 3045 pressure level

GOLD (XAUUSD): Detailed Support & Resistance Analysis
Here is my latest support and resistance analysis for Gold
ahead of the FED Interest Rate decision today.
Resistance 1: 3045 - 3050 area
Resistance 2: 3099 - 3103 area
Support 1: 2997 - 3001 area
Support 2: 2952 - 2956 area
Support 3: 2916 - 2933 area
Support 4: 2880 - 2888 area
Consider these structures for pullback/breakout trading.
❤️Please, support my work with like, thank you!❤️
I am part of Trade Nation's Influencer program and receive a monthly fee for using their TradingView charts in my analysis.

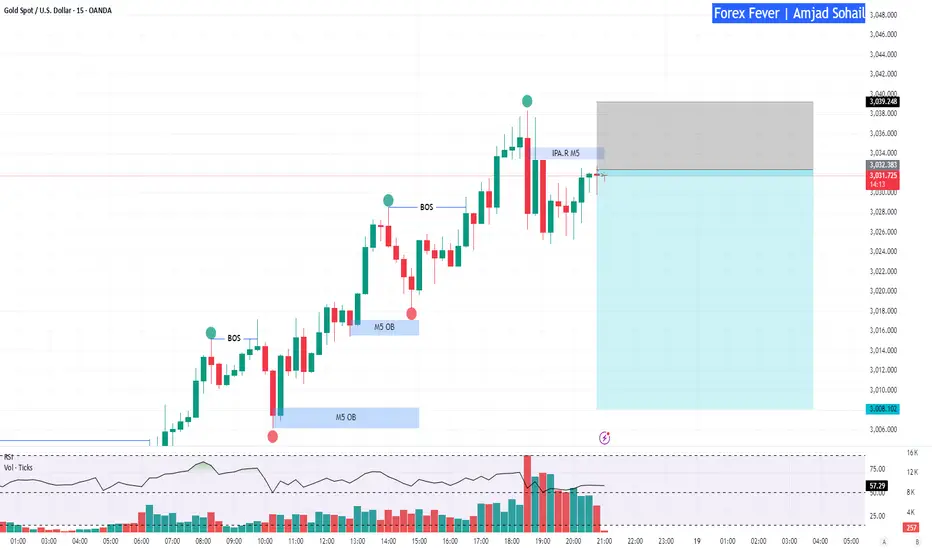
XAUUSD, Expecting a short sell till 3008 areaXAUUSD, Expecting a short sell till 3008 area based on M1 Order Block and M5 BPR, with targets 3020 & 300/.
good luck
SILVER (XAGUSD): Bullish Continuation Ahead
Silver formed a strong bullish pattern on a 4H.
I see a bullish flag with a candle close above its resistance line.
I think that the market is going to continue rising.
Next resistance 34.2
❤️Please, support my work with like, thank you!❤️
I am part of Trade Nation's Influencer program and receive a monthly fee for using their TradingView charts in my analysis.

THE KOG REPORT - UpdateEnd of day update from us here at KOG:
Not a bad start to the week with the lower Red box support which was active holding price and giving the push up early session completing the first red box target. Since that we've experience accumulation and ranging which allowed us a short trade on the indicator and then a nice long to end the day, which is now protected and managed.
We'll stick with the plan at the moment expecting a spike up with the first region being 3006 and above that 3010. Again, a bit high to even attempt a long as traders will want to see if we can hold above the 3000 level, until then, we'll look for the potential RIP.
KOG’s bias for the week:
Bearish below 2995 with targets below 2970, 2965, 2955 and below that 2950
Bullish on break of 2995 with targets above 3003, 3006, 3010, 3016 and above that 3020
RED BOXES:
Break above 2995 for 2997✅, 3003, 3009, 3016 and 3021 in extension of the move
Break below 2980 for 2975, 2971, 2965, 2959, 2955 and 2945 in extension of the move
Short and simple this week, let’s see how the week plays out and remember, your risk model is there to protect you, use it, keep your losers small and your winners big!
Please do support us by hitting the like button, leaving a comment, and giving us a follow. We’ve been doing this for a long time now providing traders with in-depth free analysis on Gold, so your likes and comments are very much appreciated.
As always, trade safe.
KOG

XAUUSD:The latest trading strategyGold has once again entered a period of sideways trading at a high level. After the bearish forces of gold made a downward probe on Friday, the price continued to rebound from the bottom. Evidently, the bullish forces of gold still have the upper hand.
Last weekend, the US military launched airstrikes in Yemen, and the crisis in the Middle East is escalating,Market panic will rise further.
Currently, gold is building momentum at a high level, and there has been no significant adjustment. Therefore, the bullish sentiment still dominates the gold market. It is advisable to go long on gold when there is a pullback.
Trading Strategy:
buy@2970-2975
SL:2960
TP:3005
I always firmly believe that profit is the sole criterion for measuring strength. I will share accurate trading signals every day. Follow my lead and wealth will surely come rolling in. Click on my profile for your guide.

XAUUSD 30 min, 17/03/2025, 08:35 AM.XAUUSD is forming an Head & Shoulder Pattern in 30 min TF.
Once it break down this will be forming an Sell setup.
Target as mentioned, SL as per candle formation.

GOLD (XAUUSD): Correctional Movement Ahead?
After a test of 3000 psychological level, Gold looks overbought.
Analysing a 4H time frame, we can spot a completed head & shoulders pattern.
A bearish movement will be confirmed with a breakout of its horizontal neckline.
If a 4H candle closes below 2978, we can expect a retracement much lower
at least to 2955.
❤️Please, support my work with like, thank you!❤️
I am part of Trade Nation's Influencer program and receive a monthly fee for using their TradingView charts in my analysis.

XAU/USD "The Gold vs U.S Dollar" Metals Market Robbery Plan🌟Hi! Hola! Ola! Bonjour! Hallo! Marhaba!🌟
Dear Money Makers & Thieves, 🤑 💰🐱👤🚀
Based on 🔥Thief Trading style technical and fundamental analysis🔥, here is our master plan to heist the XAU/USD "The Gold vs U.S Dollar" Metals Market. Please adhere to the strategy I've outlined in the chart, which emphasizes short entry. Our aim is the high-risk Green Zone. Risky level, oversold market, consolidation, trend reversal, trap at the level where traders and bullish thieves are getting stronger. 🏆💸Book Profits Be wealthy and safe trade.💪🏆🎉
Entry 📈 : "The heist is on! Wait for the breakout (2830.00) then make your move - Bearish profits await!" however I advise placing Sell Stop Orders below the breakout MA or Place Sell limit orders within a 15 or 30 minute timeframe. Entry from the most recent or Swing high or low level should be in retest.
📌I strongly advise you to set an alert on your chart so you can see when the breakout entry occurs.
Stop Loss 🛑: Thief SL placed at (2830.00) swing Trade Basis Using the 2H period, the recent / swing high or low level.
SL is based on your risk of the trade, lot size and how many multiple orders you have to take.
Target 🎯:
Primary Target - 2780.00 (or) Escape Before the Target
Secondary Target - 2710.00 (or) Escape Before the Target
🧲Scalpers, take note 👀 : only scalp on the Short side. If you have a lot of money, you can go straight away; if not, you can join swing traders and carry out the robbery plan. Use trailing SL to safeguard your money 💰.
📰🗞️Fundamental, Macro, COT Report, Global Market Analysis, Sentimental Outlook, Intermarket Analysis, Quantitative Analysis, Positioning:
XAU/USD "The Gold vs U.S Dollar" Metals Market is currently experiencing a Neutral trend., driven by several key factors.
⭐☀🌟Fundamental Analysis
Gold prices are influenced by various fundamental factors, including:
- Inflation: Rising inflation can lead to increased demand for gold as a hedge against inflation.
- Interest Rates: Lower interest rates can make gold more attractive to investors, while higher interest rates can reduce demand.
- Central Bank Policies: Central banks' decisions on gold reserves and monetary policies can impact gold prices.
- Global Economic Conditions: Economic downturns or crises can increase demand for gold as a safe-haven asset.
⭐☀🌟Macro Economics
Macroeconomic factors that can impact gold prices include:
- GDP Growth: Slowing GDP growth can lead to increased demand for gold.
- Unemployment Rates: Rising unemployment can increase demand for gold.
- Inflation Rates: Rising inflation can lead to increased demand for gold.
⭐☀🌟Global Market Analysis
Global market trends can also impact gold prices:
- Stock Market Performance: Weakness in the stock market can lead to increased demand for gold.
- Currency Fluctuations: A weaker US dollar can make gold more attractive to investors.
⭐☀🌟COT Data
Commitment of Traders (COT) data can provide insights into market sentiment:
- Non-Commercial Traders: An increase in long positions by non-commercial traders can indicate bullish sentiment.
- Commercial Traders: An increase in short positions by commercial traders can indicate bearish sentiment.
⭐☀🌟Intermarket Analysis
Intermarket analysis involves analyzing the relationships between different markets:
- Correlation with Other Assets: Gold's correlation with other assets, such as stocks and bonds, can impact its price.
- Commodity Prices: Changes in commodity prices, such as oil and copper, can impact gold prices.
⭐☀🌟Quantitative Analysis
Quantitative analysis involves using mathematical models to analyze gold prices:
- Technical Indicators: Technical indicators, such as moving averages and relative strength index (RSI), can provide insights into gold's trend.
- Statistical Models: Statistical models, such as regression analysis, can help identify relationships between gold prices and other variables.
⭐☀🌟Market Sentimental Analysis
Market sentimental analysis involves analyzing investor attitudes and sentiment:
- Bullish Sentiment: Increased bullish sentiment can lead to higher gold prices.
- Bearish Sentiment: Increased bearish sentiment can lead to lower gold prices.
⭐☀🌟Positioning
Positioning involves analyzing the current market position:
- Long Positions: An increase in long positions can indicate bullish sentiment.
- Short Positions: An increase in short positions can indicate bearish sentiment.
⭐☀🌟Next Trend Move
Based on the analysis, the next trend move for XAU/USD is uncertain. However, if inflation concerns rise, or if there's a significant increase in bullish sentiment, gold prices could move higher.
Short-Term: Bullish: $2,900-$3,000, Bearish: $2,700-$2,600
Medium-Term: Bullish: $3,200-$3,500, Bearish: $2,400-$2,200
Long-Term: Bullish: $3,800-$4,000, Bearish: $2,000-$1,800
⭐☀🌟Overall Summary Outlook
The overall summary outlook for XAU/USD is neutral. Gold prices are influenced by a complex array of factors, and the current market position is uncertain. Investors should monitor inflation concerns, interest rates, and global economic conditions to make informed decisions.
📌Keep in mind that these factors can change rapidly, and it's essential to stay up-to-date with market developments and adjust your analysis accordingly.
⚠️Trading Alert : News Releases and Position Management 📰 🗞️ 🚫🚏
As a reminder, news releases can have a significant impact on market prices and volatility. To minimize potential losses and protect your running positions,
we recommend the following:
Avoid taking new trades during news releases
Use trailing stop-loss orders to protect your running positions and lock in profits
💖Supporting our robbery plan 💥Hit the Boost Button💥 will enable us to effortlessly make and steal money 💰💵. Boost the strength of our robbery team. Every day in this market make money with ease by using the Thief Trading Style.🏆💪🤝❤️🎉🚀
I'll see you soon with another heist plan, so stay tuned 🤑🐱👤🤗🤩

GOLD (XAUUSD): 3000 Level Reached! What's Next?
Well, the most important thing about this week is of course a continuation of a bullish rally on Gold.📈
The price rapidly violated the all-time high and went much higher reaching 3000 level.
Technical analysis skeptics should admit how perfectly the 3000 psychological structure started to absorb the market supply, not letting the price go higher. 📈
What will happen next?
Still not clear, 3000 is definitely not a limit but probably just a local pit stop.
While many traders feel happy about the extraordinary Gold rally, the truth that Gold price action has a very strong correlation with negative global events. Though I am not sure what exactly caused this rally on Thursday, something definitely is going on behind the scenes and I think that it is not good.🧐
Have a great weekend, traders!
❤️Please, support my work with like, thank you!❤️

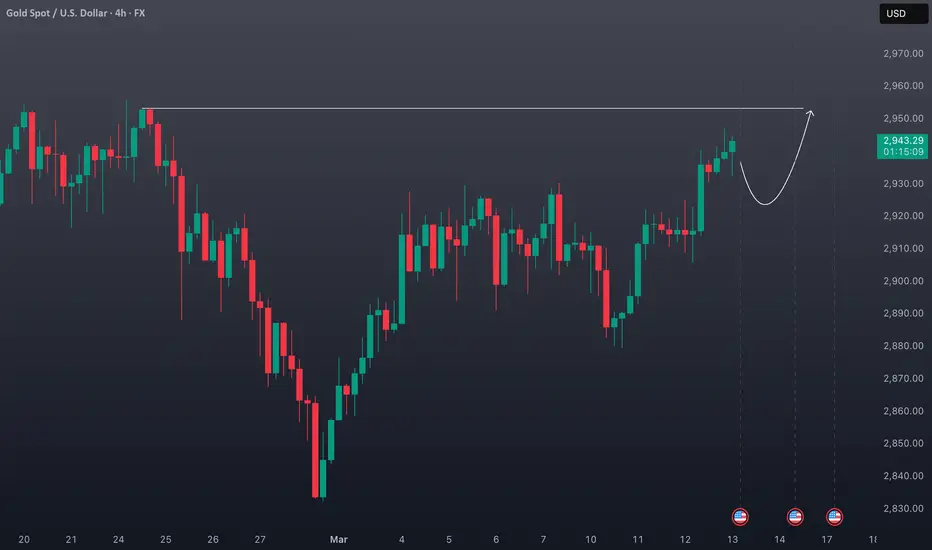
XAUUSD Showing Strength on the 4H Chart📈 XAUUSD Gold 🟡 has been demonstrating strong resilience, maintaining a clear bullish trend on this 4H timeframe. Price action continues to align with an upward trajectory, with my target set at the previous high marked on the chart 🎯.
A pullback is expected, potentially offering an opportunity to enter at a discount before a continuation toward the target zone 🚀.
⚠️ Not financial advice—always manage risk appropriately!
Short positions are in trouble, how to get out of trouble?Bros, gold accelerated to above 2980 today under the stimulation of news. If you hold a short position in gold, you must be in a trading dilemma, so how to get rid of the trading dilemma has become the current primary goal.
First remember the key node, Thursday. Under normal circumstances, Thursday and Friday are the nodes most likely to cause market changes! And from the candle chart, it is just pulled back to the high area with the stimulation of news. From the regional conversion, we can clearly see that according to the current momentum of gold, it will only reach the area around 2980-2982 (there may be a technical false breakthrough). It is difficult to rise to the vicinity of the 3000 mark in one fell swoop.
If you still have sufficient margin levels to help you get out of trouble, you might as well consider adding more positions near 2980 to continue shorting gold, effectively raising your average cost price. After gold falls back, you can choose to close all short positions and turn losses into profits. However, because gold has risen sharply, we must lower our expectations for the extent of gold's retracement. If gold retraces to the 2940-2930 area, we can consider closing our positions, so that we can turn losses into profits! And I predict that gold will enter a correction market tomorrow at the latest!
Trading means that everything has results and everything has feedback. I have been committed to market trading and trading strategy sharing, striving to improve the winning rate of trading and maximize profits. If you want to copy trading signals to make a profit, or master independent trading skills and thinking, you can follow the channel at the bottom of the article to copy trading strategies and signals

Gold is about to plunge, stick to short positions!Bros, Good morning,I made it very clear yesterday that 2935-2945 is definitely a good opportunity to sell gold. I still stick to my point of view and insist on holding my short position.
To be honest, the continuity of the market news stimulating the rise of gold is not strong. After the rise of gold hits 2946, it faces the suppression of the previous high near 2955. With the current momentum of gold, it is impossible to break through the high suppression area in one go. Even if it is to accumulate more momentum for a breakthrough, gold will have a deep need to step back to the 2920-2910 zone. So I remain positive on short positions in the short term.
In addition, it is particularly important to note that gold is facing high pressure, and there may be many temptations to do long signals. Now you must keep a clear mind and not be confused by the temptation signals. When you chase long gold at a high position, once gold retreats, you may be deeply trapped and it will be difficult to get out!
Do you think gold will fall back to the 2920-2910 zone as expected? Trading means that everything has results and everything has feedback. I have been committed to market trading and trading strategy sharing, striving to improve the winning rate of trading and maximize profits. If you want to copy trading signals to make a profit, or master independent trading skills and thinking, you can follow the channel at the bottom of the article to copy trading strategies and signals

GOLD (XAUUSD): Rise Continues
Gold broke and closed above a resistance line of a horizontal
consolidation range on a daily.
We can expect a bullish movement to the All-Time high now.
Goal - 2952
❤️Please, support my work with like, thank you!❤️

Gold Prices Rise as Inflation Fears Subside◉ Fundamental Rationale
● Gold prices remain steady despite a strong US dollar, supported by a softer-than-expected US CPI report.
● The US CPI report showed a 0.4% rise, lower than the forecasted 0.5%, easing inflation concerns.
● Weaker US inflation data reduces the likelihood of a rate hike, making gold more attractive to investors.
● The strong US dollar, fueled by a surge in US Treasury yields, failed to dent gold's appeal.
● Prices are expected to remain supported as investors seek safe-haven assets amid economic uncertainty.
◉ Technical Observations
● Gold prices have broken free from a Symmetrical Triangle pattern and surged upward.
● Currently trading near all-time highs, the rally is expected to continue, propelling prices beyond the previous high.

A good opportunity to short gold, do you want to miss it?Because Trump mentioned the issue of tariffs, gold prices soared and broke through the recent range of fluctuations, reaching around 2938.
Gold prices soared due to the impact of the news, so the continuity is probably not strong. Gold is likely to return to the technical level of 2920-2910 in a short period of time; in addition, the accelerated rise of gold already means a short squeeze, and the top is facing strong pressure from the previous high area, and gold is likely to rise and then fall back.
Therefore, in terms of short-term trading, I don’t think it is a wise choice to continue to chase the rise of gold. On the contrary, I think that the rise of gold is a good opportunity to short, and the 2935-2945 zone is also worth selling gold.
Trading means that everything has results and everything has feedback. I have been committed to market trading and trading strategy sharing, striving to improve the winning rate of trading and maximize profits. If you want to copy trading signals to make a profit, or master independent trading skills and thinking, you can follow the channel at the bottom of the article to copy trading strategies and signals

I still have a short position, what about you?Bros, the recent trend of gold has been very painful. After falling to 2880, it was pulled back to the shock range, and neither the long nor the short positions continued. However, in the short term, the upper resistance is obviously in the 2925-2935 zone; relatively speaking, as gold fell below the 2900 and 2890 areas several times during the test of support, the support below is relatively weak.
In addition, the CPI data will be released in 2 hours. I think this CPI data is likely to boost the US dollar and suppress gold, but it is not ruled out that gold will rise and then fall.
So in terms of short-term trading, I prefer to short gold, and I still hold a short position in gold, and I hope that gold can retreat to the 2910-2900 zone as expected.
Bros, are you holding a short position like me?Trading means that everything has results and everything has feedback. I have been committed to market trading and trading strategy sharing, striving to improve the winning rate of trading and maximize profits. If you want to copy trading signals to make a profit, or master independent trading skills and thinking, you can follow the channel at the bottom of the article to copy trading strategies and signals

You will be glad you have a short positionBrothers, I have clearly reminded you in the above two article updates that I am very optimistic about gold's retreat to the 2905-2895 area. In the short term, gold has shown signs of retreat after touching the area near 2922 several times, and formed a distinct long upper shadow in the candle chart, further strengthening the effectiveness of the resistance area 2925-2935 area, further stimulating the willingness of gold to fall.
In the short term, I think gold still has the opportunity to retreat to the 2905-2895 area again. I am still patiently holding my short position and looking forward to further declines in gold, which will bring us rich profits.
Bro, do you have the courage to short gold with me?Trading means that everything has results and everything has feedback. I have been committed to market trading and trading strategy sharing, striving to improve the winning rate of trading and maximize profits. If you want to copy trading signals to make a profit, or master independent trading skills and thinking, you can follow the channel at the bottom of the article to copy trading strategies and signals

Shorting gold is the way to make money!Brothers, after gold rebounded to around 2920, the rebound momentum gradually weakened, and the fluctuation range gradually narrowed. This shows that the upper resistance area of 2925-2935 is difficult to break through in a short time. Gold still has the need to retrace and gain momentum, and it is not difficult for gold to retreat to the 2905-2895 area.
So in terms of short-term trading, I insist on shorting gold in batches in the 2915-2925 area, and I expect gold to fall as expected, and the rich profits will also be taken.
Trading means that everything has results and everything has feedback. I have been committed to market trading and trading strategy sharing, striving to improve the winning rate of trading and maximize profits. If you want to copy trading signals to make a profit, or master independent trading skills and thinking, you can follow the channel at the bottom of the article to copy trading strategies and signals

Be bold and short gold to reap profitsBros, gold continued to rebound to around 2922, but after touching 2922 several times, gold could not continue to make an effective breakthrough and showed signs of retracement. This proves that the upper pressure is strong. According to the current momentum of gold, it cannot easily break through the resistance of the 2925-2930 zone above.
Then gold must have the need to retrace and accumulate power, so my trading strategy in the above article is still valid. We have shorted gold in the 2915-2925 area according to the trading plan. Now we are patiently waiting for gold to fall deeper and expand our profits. It is expected that gold will retest the 2905-2895 zone again.
Bros, gold is now like a drunken old man, swaying from side to side as he walks. At any moment, he might stumble and fall along the way.
Trading means that everything has results and everything has feedback. I have been committed to market trading and trading strategy sharing, striving to improve the winning rate of trading and maximize profits. If you want to copy trading signals to make a profit, or master independent trading skills and thinking, you can follow the channel at the bottom of the article to copy trading strategies and signals

Successfully gained long profits and started shorting goldBros, I mentioned very clearly yesterday that gold would only touch the lowest area of 2880-2870 during the decline. As I expected, gold rebounded again after touching 2880. Yesterday, I insisted on absorbing as many cheap chips as possible during the gold correction. Today's gold rebound has brought us extremely rich profits. If you have been paying attention to my trading strategies, I believe you have made exponential profits in gold trading.
At present, gold continues to rebound and touches around 2915, but the overall rebound is not strong, and the upper 2920-2930 area constitutes strong resistance in the short term. According to the current rebound potential of gold, it is difficult for gold to easily break through the resistance in this area, and gold may still retest the area around 2900 after encountering resistance. So in terms of short-term trading, we can try to short gold in the 2915-2925 area.
Trading means that everything has results and everything has feedback. I have been committed to market trading and trading strategy sharing, striving to improve the winning rate of trading and maximize profits. If you want to copy trading signals to make a profit, or master independent trading skills and thinking, you can follow the channel at the bottom of the article to copy trading strategies and signals