Rebounds are opportunities to short goldAt present, gold has tried to fall below the 3200 mark and completely broke the recent low support, laying the foundation for the downward structure. As the center of gravity of gold shifts downward, the upper resistance also moves down to the 3210-3220 area. The relatively clear support below in the short term is in the 3165-3160 area, and after breaking this area, it may even continue to the 3105-3100 area.
Trading strategy:
Consider continuing to short gold in the 3210-3220 area, TP: 3180-3170
CAPITALCOM:GOLD OANDA:XAUUSD FOREXCOM:XAUUSD TVC:DXY
Xauusdtradeidea

Start going long on goldAt present, the trend of gold is relatively calm, but as gold rebounds, a certain support strength has been shown below; and the short-term negative news has all appeared, and gold needs to rebound at the technical level. Therefore, I think we can try to go long on gold in small batches in the current area of 3230-3220, and expect gold to continue to rebound to the 3250-3260 area, or even the 3280-3290 area.
Trading strategy:
Try to start going long on gold in small batches in the 3230-3220 area; TP: 3250-3255

Buy gold, it will continue to 3350!Fundamentals:
Focus on Trump and the Fed;
Technical aspects:
Currently, gold is moving in a fluctuating upward manner, and in the short term, the effective double bottom structure constructed in the area around 3200 and 3220 supports the continued upward movement of gold. In the short term, gold is not very willing to fall, and it has not even been able to fall back below 3300 again. If gold breaks through the 3330-3335 area during the rebound, then gold will inevitably continue to rise to the area around 3350, or even the area around 3380.
Trading strategy:
If gold retreats next, we will mainly focus on the opportunity to go long on gold in the 3315-3305 area; TP: 3350

Be bold and short goldFundamentals:
1. Still need to pay attention to Trump's attitude towards tariffs;
2. Pay attention to whether the situation between India and Pakistan escalates;
3. At the same time, pay attention to the dynamics of the Federal Reserve, US-Iran negotiations, etc.
Trading situation:
Our last short position near 3297 happened to hit TP: 3287 during the decline of gold, and easily made a profit of 100pips in short-term trading;
After gold fell below 3287, it rose sharply in the short term to around 3335. Although gold rose sharply in the short term, it still did not break away from the wide range of fluctuations. There are still many resistances above. First, it faces the short-term resistance area of 3340-3345, and secondly, it faces the resistance area of 3355-3365. Therefore, it is difficult for bulls to perform well before conquering this resistance area. There is still a possibility of testing the 3305-3295 zone again;
Trading strategy:
Short-term trading can still short gold in batches again in the 3325-3335 zone; TP: 3310-3300

Master swing trading! Both long and short sides can profit!The current fundamental environment: tariff issues and geopolitical conflicts are on opposite sides, so there are both bearish and bullish factors for the gold market, which have triggered fierce competition between long and short forces to a certain extent, exacerbating market volatility!
At present, overall, the short forces have the upper hand, but the longs still have a certain ability to fight back! If the short energy is fully released during the process of gold falling to around 2970, then gold may still usher in a wave of rebound opportunities in the short term. First of all, the areas worthy of our participation in trading are mainly concentrated in the following:
1. The short-term support area below: 3010-3000; secondly, the important defensive area for bulls is: 2975-2965.
2. The short-term resistance area above: 3040-3050; secondly, the important defensive area for bears is: 3070-3080.
This is the key area that we must pay attention to in the short-term, and it is also an important reference for our next short-term trading!
The trading strategy verification accuracy rate is more than 90%; one step ahead, exclusive access to trading strategies and real-time trading settings

XAUUSD: Buy or Sell?Today's gold market can be said to have the largest intraday volatility since 2025! After experiencing violent fluctuations, the current trend of gold has once again become anxious.
However, from the perspective of range conversion, it is certain that gold is currently operating in a weak position, and after the brutal and violent fluctuations, the market also needs to recuperate. And there will be NFP tomorrow. It is expected that before NFP, it will be difficult for gold to form a new unilateral market again. So in the process of shock, I think both long and short sides have a certain profit space.
First of all, pay attention to the resistance of 3125-3135 area on the top. If gold touches this area during the shock process, we can still short gold;
And the first focus on the 3095-3085 area on the bottom is that if gold touches this area during the shock process, we can still consider going long on gold.
The trading strategy verification accuracy rate is more than 90%; one step ahead, exclusive access to trading strategies and real-time trading settings

Gold Faces Repeated Rejections, Bearish Outlook RemainsAlthough gold has yet to confirm a significant downtrend, it has faced multiple rejections around the 3030-3040 resistance zone in recent sessions. Notably, after touching 3036 yesterday, gold experienced a sharp pullback, forming a long upper shadow on the candlestick chart. This price action has diminished the supportive effect of the underlying W-bottom structure.
If gold continues to struggle to break above the 3030-3040 zone, the current seemingly strong price action may prove to be a false signal, merely a setup for a subsequent decline. Additionally, with geopolitical risks easing and no significant fundamental drivers supporting further upside, I remain optimistic about a bearish continuation in gold.
We can consider scaling into short positions within the 3028-3038 range, patiently targeting a retest of the 3010-3000 zone. A confirmed break below 3000 could accelerate further downside toward the 2995-2985 region.
I would make more detailed trading plans and trading signals every day according to the real-time market situation, which is also the testimony of every successful transaction and profit of mine; the article has a certain lag, if you want to copy the trading signals to make a profit, or master independent trading skills and thinking, you can choose to join the channel at the bottom of the article

Bearish Bias Under Head and Shoulders Formation📍Gold is currently leaning towards a bearish trend under the pressure of a well-defined head and shoulders pattern. Therefore, our primary trading approach remains focused on short positions.
📍In the short term, the key resistance to watch is in the 3030-3040 zone. However, it's worth noting that on Friday, gold quickly recovered most of its losses after testing the 3000 level, indicating the presence of strong buying interest and solid support below.
📍From a trading perspective, there is still an opportunity to capture profits from potential technical rebounds. The main support levels to monitor are:
📌3010-3000 as the initial support zone
📌2995 as the secondary support level
🔎Trade Idea:
1. Xauusd: Sell at 3035-3045
TP:3020-3010
SL:Adjust according to risk tolerance.
📎But if gold shows signs of holding support, a short-term rebound could provide opportunities for counter-trend trades.
2. Xauusd: Buy at 3015-3005
TP:3025-3035
SL:Adjust according to risk tolerance.
📩Trading means that everything has results and everything has feedback. I have been committed to market trading and trading strategy sharing, striving to improve the winning rate of trading and maximize profits. If you want to copy trading signals to make a profit, or master independent trading skills and thinking, you can follow the channel at the bottom of the article to copy trading strategies and signals

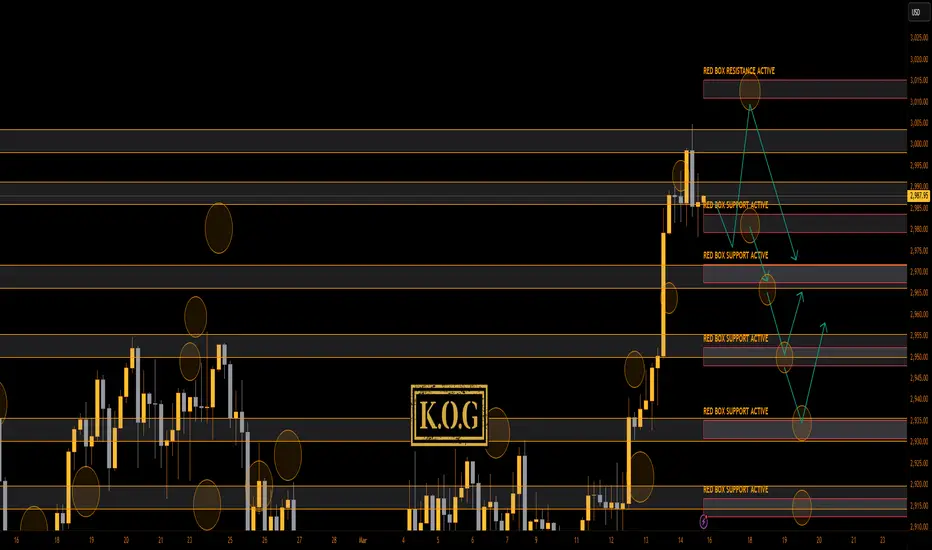
THE KOG REPORT THE KOG REPORT:
In last week’s KOG Report we said it would be a difficult one to decipher so we suggested traders wait for the break, trade into the levels given and then look for the RIPs. This worked particularly well for us giving us the move into the lower level as analysed on the break, using the red boxes for direction and then giving us the tap and bounce that we wanted to take the long trades back up into the new all time highs we witnessed towards the end of the week.
We managed to compete all of our bias level targets, getting a pin-point move from KOG’s bias and on top of that completing Excalibur targets and the red box targets. Not a bad week at all on Gold.
So, what can we expect in the week ahead?
For this week we’ll be looking for a retracement on the move, however, we are not discounting a curveball move from immediate support to clear liquidity from above. We have the resistance level above 2990 and lower support 2980 which could be the play for the opening. If we break above 2995, we’ll be looking for price to attempt that 3010 and above that 3020 region before attempting to short it again.
On the flip, if we do reject that higher level and can break below 2980, we’ll stick with the plan from last week where we’re looking to continue the retracement back down first into the 2965 level and below that 2950-55. If you look on the chart, we have highlighted a lower level which is sitting around 2935-20, an aggressive move downside can take us there on the manipulation move, so please trade with caution this week and keep an eye on the levels.
KOG’s bias for the week:
Bearish below 2995 with targets below 2970, 2965, 2955 and below that 2950
Bullish on break of 2995 with targets above 3003, 3006, 3010, 3016 and above that 3020
RED BOXES:
Break above 2995 for 2997, 3003, 3009, 3016 and 3021 in extension of the move
Break below 2980 for 2975, 2971, 2965, 2959, 2955 and 2945 in extension of the move
Short and simple this week, let’s see how the week plays out and remember, your risk model is there to protect you, use it, keep your losers small and your winners big!
Please do support us by hitting the like button, leaving a comment, and giving us a follow. We’ve been doing this for a long time now providing traders with in-depth free analysis on Gold, so your likes and comments are very much appreciated.
As always, trade safe.
KOG
Gold is about to plunge, stick to short positions!Bros, Good morning,I made it very clear yesterday that 2935-2945 is definitely a good opportunity to sell gold. I still stick to my point of view and insist on holding my short position.
To be honest, the continuity of the market news stimulating the rise of gold is not strong. After the rise of gold hits 2946, it faces the suppression of the previous high near 2955. With the current momentum of gold, it is impossible to break through the high suppression area in one go. Even if it is to accumulate more momentum for a breakthrough, gold will have a deep need to step back to the 2920-2910 zone. So I remain positive on short positions in the short term.
In addition, it is particularly important to note that gold is facing high pressure, and there may be many temptations to do long signals. Now you must keep a clear mind and not be confused by the temptation signals. When you chase long gold at a high position, once gold retreats, you may be deeply trapped and it will be difficult to get out!
Do you think gold will fall back to the 2920-2910 zone as expected? Trading means that everything has results and everything has feedback. I have been committed to market trading and trading strategy sharing, striving to improve the winning rate of trading and maximize profits. If you want to copy trading signals to make a profit, or master independent trading skills and thinking, you can follow the channel at the bottom of the article to copy trading strategies and signals

Be sure to short gold!Expected profit: 150-300 pipsBros, be sure to be short gold and never miss the profits in every swing.As I said in my last article, the 2935-2945 zone is worth selling gold, and I have shorted gold in this area according to the trading plan. Have you shorted gold with me?
Although gold once rose to around 2940 under the stimulation of news, I think the accelerated rise of gold was suspected of short squeeze, and after the market calmed down, gold will return to the technical level and have a need for retracement. However, as gold breaks through the oscillation range upward, the lower support will move up to the 2920-2910 zone.
Therefore, our primary target for shorting gold in the short term is the 2920-2910 zone. If gold falls back to this area as expected, then in the short term, we will still gain 150-300 pips of profit, which is still a good return for short-term trading!
Do you think gold will fall back to the 2920-2910 zone as expected? Trading means that everything has results and everything has feedback. I have been committed to market trading and trading strategy sharing, striving to improve the winning rate of trading and maximize profits. If you want to copy trading signals to make a profit, or master independent trading skills and thinking, you can follow the channel at the bottom of the article to copy trading strategies and signals

A good opportunity to short gold, do you want to miss it?Because Trump mentioned the issue of tariffs, gold prices soared and broke through the recent range of fluctuations, reaching around 2938.
Gold prices soared due to the impact of the news, so the continuity is probably not strong. Gold is likely to return to the technical level of 2920-2910 in a short period of time; in addition, the accelerated rise of gold already means a short squeeze, and the top is facing strong pressure from the previous high area, and gold is likely to rise and then fall back.
Therefore, in terms of short-term trading, I don’t think it is a wise choice to continue to chase the rise of gold. On the contrary, I think that the rise of gold is a good opportunity to short, and the 2935-2945 zone is also worth selling gold.
Trading means that everything has results and everything has feedback. I have been committed to market trading and trading strategy sharing, striving to improve the winning rate of trading and maximize profits. If you want to copy trading signals to make a profit, or master independent trading skills and thinking, you can follow the channel at the bottom of the article to copy trading strategies and signals

Shorting gold is the way to make money!Brothers, after gold rebounded to around 2920, the rebound momentum gradually weakened, and the fluctuation range gradually narrowed. This shows that the upper resistance area of 2925-2935 is difficult to break through in a short time. Gold still has the need to retrace and gain momentum, and it is not difficult for gold to retreat to the 2905-2895 area.
So in terms of short-term trading, I insist on shorting gold in batches in the 2915-2925 area, and I expect gold to fall as expected, and the rich profits will also be taken.
Trading means that everything has results and everything has feedback. I have been committed to market trading and trading strategy sharing, striving to improve the winning rate of trading and maximize profits. If you want to copy trading signals to make a profit, or master independent trading skills and thinking, you can follow the channel at the bottom of the article to copy trading strategies and signals

Be bold and short gold to reap profitsBros, gold continued to rebound to around 2922, but after touching 2922 several times, gold could not continue to make an effective breakthrough and showed signs of retracement. This proves that the upper pressure is strong. According to the current momentum of gold, it cannot easily break through the resistance of the 2925-2930 zone above.
Then gold must have the need to retrace and accumulate power, so my trading strategy in the above article is still valid. We have shorted gold in the 2915-2925 area according to the trading plan. Now we are patiently waiting for gold to fall deeper and expand our profits. It is expected that gold will retest the 2905-2895 zone again.
Bros, gold is now like a drunken old man, swaying from side to side as he walks. At any moment, he might stumble and fall along the way.
Trading means that everything has results and everything has feedback. I have been committed to market trading and trading strategy sharing, striving to improve the winning rate of trading and maximize profits. If you want to copy trading signals to make a profit, or master independent trading skills and thinking, you can follow the channel at the bottom of the article to copy trading strategies and signals

Buy gold aggressively and grab bargains!Bros, I have just clearly pointed out in the last article that gold will continue to rise after repeatedly testing and confirming the support of the 2900-2890 zone. I expect gold to at least test the 2920-2930 area again, and once gold stands above 2920, it will inevitably break through 2930 and even hopefully reach the previous high of 2955 again.
So brothers, gold falling back to the 2900-2890 zone is a good time for us to pick up bargains. I have picked up a lot of bargains in this zone, have you picked them up?
Trading means that everything has results and everything has feedback. I have been committed to market trading and trading strategy sharing, striving to improve the winning rate of trading and maximize profits. If you want to copy trading signals to make a profit, or master independent trading skills and thinking, you can follow the channel at the bottom of the article to copy trading strategies and signals

Short trade in progressBros, today's trading view is very clear. We still continue to short gold, and there is no problem in making 200-300pips of profit in the short term.
Gold faces multiple key resistances above 2930. It is difficult to have enough momentum to break through the multiple key resistances above in the short term; and before the NFP market on Friday, both long and short sides are relatively cautious, and it is difficult to form a unilateral trend market. The overall market still fluctuates within the range. So I think shorting gold is still profitable.
In terms of short-term trading, I have taken the 2930-2940 area as resistance and shorted gold below 2930. At present, gold has fallen back to below 2920. Our short position has made a good profit. What we need to do now is to wait patiently for gold to continue to fall back, so as to bring us more lucrative profits.
Bros, did you follow me to short gold? Wise choices are far greater than hard work. Only by following the right people can we execute the right transactions and accumulate profits that change our lives and destiny. If you want to copy trading signals and make stable profits, or want to learn the correct trading logic and techniques in depth, you can consider joining the channel at the bottom of this article!

First short gold, then long goldBros, driven by risk aversion, gold has risen rapidly to above 2920, breaking through the recent consolidation range of 2895-2885. However, due to the promotion of news, the continuity of gold's rise may not be strong. We must be careful of the trend of falling after rising, so we cannot aggressively chase long gold in short-term trading;
After consolidating in the past two days, gold has risen through the stimulation of news and got rid of the bottom area, and the rising structure is relatively complete. Then gold may try to rush into the upper 2930 resistance area again with the support of the rising structure, or even near the previous high of 2956. So in the next transaction, we can wait for gold to fall back to the 2900-2890 zone and try to go long on gold;
Of course, for now, before gold falls back to 2900-2890, we can safely short gold again in the 2915-2925 zone; after gold falls back to 2900-2890, we will go long on gold.Bros, profits are the ultimate goal in trading. Accumulating profits is what changes lives and destinies. Choosing wisely is far more important than just working hard. If you want to replicate trade signals and earn stable profits, or if you want to deeply learn the correct trading logic and techniques, you can consider joining the channel at the bottom of this article!

XAU/USD 04 March 2025 Intraday AnalysisH4 Analysis:
-> Swing: Bullish.
-> Internal: Bearish.
Price has printed a bullish CHoCH according to analysis and bias dated 28 February 2025.
Price is currently trading within an established internal range.
Intraday Expectation:
Price is now trading in premium of 50% internal EQ where we could see a reaction at any point. Price could also target H4 supply zone before targeting weak internal low, priced at 2,832.720
Note:
With the Federal Reserve's dovish stance and persisting geopolitical uncertainties, heightened volatility in Gold is expected to continue. Traders should proceed with caution and adjust risk management strategies in this high-volatility environment.
Price could also be driven by President Trump's policies, geopolitical moves and economic decisions which are sparking uncertainty.
H4 Chart:
M15 Analysis:
-> Swing: Bullish.
-> Internal: Bearish.
Analysis and bias remains the same as analysis dated 03 March 2023.
As mentioned in my analysis dated 28 February 2025, whereby price printed a bullish CHoCH but stated I would continue to monitor price.
On this occasion I have marked the previous bullish CHoCH in red as price did not pull back deeply enough to warrant internal structure breaks, additionally, there was minimal time spent .
Price has printed a further bullish CHoCH which is now confirmed. Price is not trading within an established internal range.
Intraday Expectation:
Price to continue bullish, react at either premium of internal 50% EQ, or M15 supply zone before targeting weak internal low priced at 2,832.720.
Note:
With the Federal Reserve maintaining a dovish stance and ongoing geopolitical tensions, volatility in Gold prices is expected to remain elevated. Traders should exercise caution, adjust risk management strategies, and stay prepared for potential price whipsaws in this high-volatility environment.
M15 Chart:

Still short goldBros, after gold continued to rebound to around 2893, it encountered resistance and fell back in this position area many times, which consumed the bullish momentum to a certain extent. This position area happens to be the 50% segmentation area from the high point of 2956 to the low point of 2832. So if gold fails to break through this area many times, it will hit the morale of the bulls to a certain extent.
In addition, although gold rebounded to the 50% retracement position area in one go, which exceeded my expectations to a certain extent, it did not form a solid structural support after touching around 2832. The technical pattern of "single needle bottoming" alone cannot support gold to continue to rebound and break through the key resistance area. Therefore, on the technical level, gold still needs to continue to step back and confirm support.
So in the short term, I am still willing to try to short gold. The upper resistance area is in the 2895-2905 zone, and the lower support area is in the 2875-2865 zone.Bros, profits are the ultimate goal in trading. Accumulating profits is what changes lives and destinies. Choosing wisely is far more important than just working hard. If you want to replicate trade signals and earn stable profits, or if you want to deeply learn the correct trading logic and techniques, you can consider joining the channel at the bottom of this article!

Unwavering belief in short sellingBrothers, I have already shorted gold according to the trading plan. Do you have the courage to short gold with me?
At present, the volatility of gold is converging and maintaining a narrow range of fluctuations near 2890, but it is obvious that the rebound of gold is insufficient to support the continuation of the rebound and breakthrough of gold. Therefore, after consuming a certain degree of bullish power, the bears will regain control of the situation. And I also have the following reasons to believe that gold will retest the 2875-2865 area again.
1. The upward breakthrough of gold is insufficient, and it needs to retreat to increase liquidity and attract more bulls to enter the market;
2. After the sharp drop in gold, there is no strong structural support for gold to continue to rise at the technical level, and the bottom support is not reliable;
3. Gold hesitated in the key resistance level area, which consumed the bullish momentum to a certain extent. Gold needs to retreat to accumulate more momentum.
So based on the above three points, I am still confident in my short position, and I believe that my short position will definitely bring me satisfactory returns.Bros, profits are the ultimate goal in trading. Accumulating profits is what changes lives and destinies. Choosing wisely is far more important than just working hard. If you want to replicate trade signals and earn stable profits, or if you want to deeply learn the correct trading logic and techniques, you can consider joining the channel at the bottom of this article!

Continue to short goldBros, gold is currently continuing to rebound to around 2892. This wave of rebound is really unexpected. It was originally expected that gold would fall back after rebounding to around 2890. Unexpectedly, gold broke through the 2890 mark after a slight pause.
Fortunately, gold was not strong during its breakthrough, indicating that the sustainability of gold's rebound remains to be examined, and the 2900-2910 zone above poses structural resistance to gold in the short term. I predict that gold will fall back again before it can even touch 2900, so I am still optimistic about gold's retracement in the short term.
Now I have shorted gold. Although I have a slight loss now, I am not worried about my short position. If gold cannot continue and break through the 2900-2910 zone in one fell swoop, gold will also retest the 2875-2865 support zone.
Bros, profits are the ultimate goal in trading. Accumulating profits is what changes lives and destinies. Choosing wisely is far more important than just working hard. If you want to replicate trade signals and earn stable profits, or if you want to deeply learn the correct trading logic and techniques, you can consider joining the channel at the bottom of this article!

Gold rebounds as expected, get ready to short goldBros, as the trading strategy I published in the last article, we went long on gold near 2860 as scheduled according to the trading plan today. In order to lock in profits in time, we closed the order near 2870. In just half an hour, we made almost 100 pips of profit.
At present, gold continues to rebound to around 2875. Although the rebound process is relatively continuous, the overall rebound strength is not strong, so we can't chase gold too much; gold fell from the stage high of 2956 to around 2830, and gold turned from strong to weak. Its 50% retracement level is in the 2890-2895 zone, and the 38% retracement level is near 2880.
Therefore, the current rebound cannot be regarded as a reversal, but only a technical rebound repair. If gold rebounds to the 2880-2890 zone, I am still willing to short gold. Before gold is determined to reverse the trend, I think gold must at least retrace the 2860-2850 zone to form a technical double bottom support.
Bros, profits are the ultimate goal in trading. Accumulating profits is what changes lives and destinies. Choosing wisely is far more important than just working hard. If you want to replicate trade signals and earn stable profits, or if you want to deeply learn the correct trading logic and techniques, you can consider joining the channel at the bottom of this article!

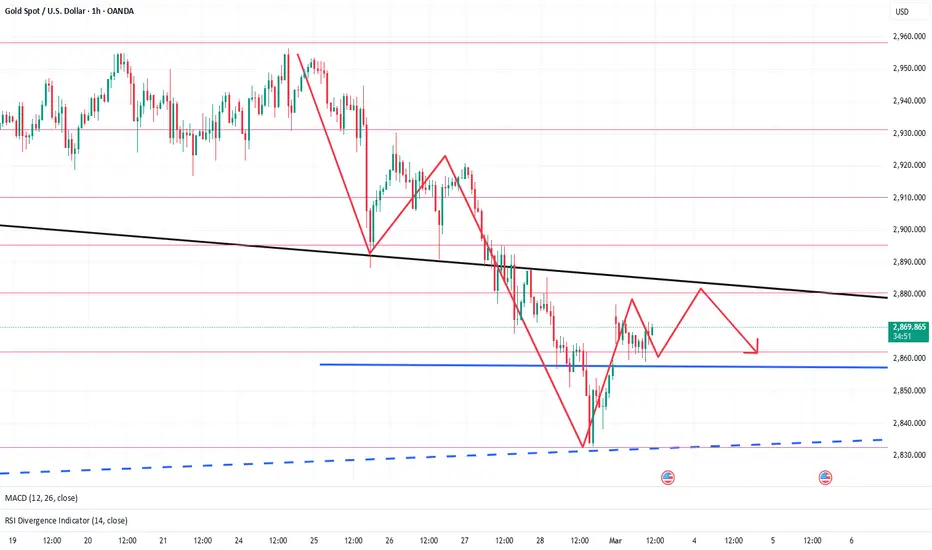
Gold can make money both long and shortGood morning, bros! Today is the beginning of a new week of trading. I pray that everything goes well for us this week!
Gold is currently calm, but behind the calm there are often greater opportunities. Gold is currently trading around 2860. To be honest, when gold fell to around 2830 last week, gold has turned from strong to weak. However, gold once rebounded to above 2855 on Friday, proving that there are still a certain number of bulls who are engaged in self-rescue behavior, or are still relatively optimistic about the prospects of gold.
So gold may still have good rebound momentum during the decline, so we should not blindly chase short gold in trading. Then if gold does not fall below 2855 during the decline, gold is likely to rebound to the 2870-2880 area, or even 2890.
So for short-term trading, we have two feasible trading methods:
1. After gold retests to the 2860-2855 area, you can try to go long on gold;
2. After gold rebounds to the 2875-2885 area, we can go short on gold again
Bros, profits are the ultimate goal in trading. Accumulating profits is what changes lives and destinies. Choosing wisely is far more important than just working hard. If you want to replicate trade signals and earn stable profits, or if you want to deeply learn the correct trading logic and techniques, you can consider joining the channel at the bottom of this article!