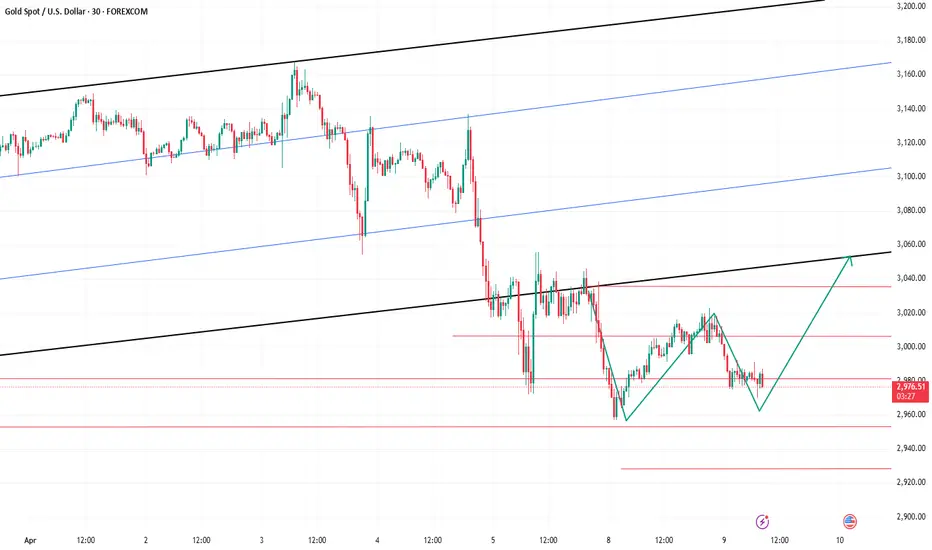
XAUUSD hourly trend analysis for April 09, 2025XAUUSD trend is currently bearish. Once it closes above 3023, there is an immediate resistance at 3050. But 3050 may not indicate bullishness unless Trend trading indicator confirms the signal. Once the Buy is confirmed, there would be an immediate resistance at 3090. This is just my view.
Xauusdtrading

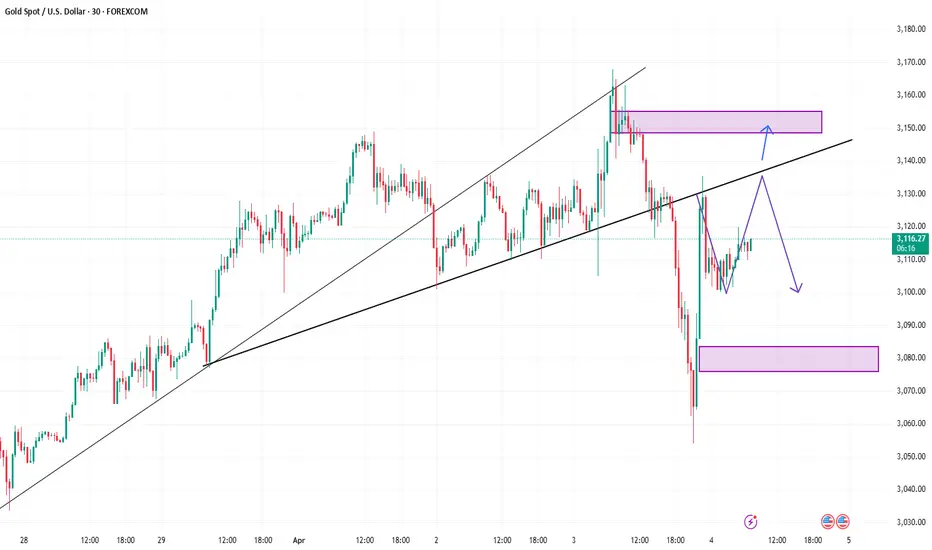
Gold: Buy, Target 3004-3028On the 1H chart, the MACD is showing a bullish divergence, signaling a potential bottom. If gold can build a base around 2960-2980, bulls will have the upper hand from a technical standpoint.
While today's major macro news will hit during the U.S. session, technical analysis dominates the Asian and European sessions — which favors a buy-on-dip strategy.
The 3030 resistance, which wasn’t tested yesterday, may be reached today.
If the price drops unexpectedly, watch the 2946-2928-2916 zone for new buying opportunities — especially 2928-2916, which is a strong support zone.
Buy:2960 - 2980
TP:3004 - 3028
After a brief rebound, gold continues to be short-sellingThe gold 1-hour moving average is still in a downward dead cross short arrangement, and the gold short strength is still there. The gold moving average resistance has now moved down to around 3002. After gold fell below 3000, gold accelerated its decline again, indicating that gold is still at an important level around 3000. The volatility of gold has only increased recently, so don't think that the market has reversed because it seems to have rebounded a lot. The recent fluctuations of tens of dollars in the gold market are normal.
Trading ideas: short gold around 3000, stop loss 3010, target 2970

Gold has won two consecutive games, continue to short?Gold continued to be in a dead cross downward short position at 1 hour. The strength of gold short positions has not diminished. Gold fell near the resistance of 3017, and the gold moving average resistance has now moved down to near 3021. After gold rebounds, it is still mainly short selling.
Trading ideas: short gold near 3015, stop loss 3025, target 2990
The above is only a sharing of personal opinions and does not constitute investment advice. Investment is risky and you are responsible for your profits and losses.

XAUUSD ShortWhat a Monday that was! Price broke way below 3000 and even hit 2954 level. It was a little shaky so I opt to not put in my positions, even if my predictions were correct, I chose to play safe. Today, price is still a little unstable but placing a position so to catch some pips if ever. Iv placed an SL just for Tradingview purposes, here's my position info: Open at 3014// SL 3164//TP 2964. As usual we decide as we go, but let's see how this trade rolls :)
Day 19of100
L:5
W:4

Gold is Bullish, Target 3030-3060At the market open today, we signaled a buy opportunity near the 2980 level for gold. Since then, the price has surged over $30, and those who followed the strategy have already secured solid profits.
Gold is now approaching a short-term resistance, so a minor pullback may occur. However, the overall uptrend for the day remains intact, and our strategy continues to favor buying on dips.
Based on the current chart pattern, there's potential for the price to rise toward the 3030–3060 zone later today.
Stay alert for retracement opportunities, manage your position size wisely, and trade with discipline.
If you missed this entry, don’t worry — the next opportunity is just around the corner!

Gold's decline is not over yet, go short on the rebound!The gold 1-hour moving average continues to cross the downward short arrangement, the momentum of gold shorts is still there, and gold rebounds and continues to short. Of course, gold has been falling sharply in the past few days, and the market may gradually begin to recover. You must wait patiently for opportunities to rebound, and do not chase short positions easily.
Trading ideas: short gold near 3017, stop loss 3027, target 2090
The above is purely a sharing of personal opinions and does not constitute trading advice. Investments are risky and you are responsible for your profits and losses.

XAU/USD "The Gold" Metal Market Heist Plan (Scalping/Day Trade)🌟Hi! Hola! Ola! Bonjour! Hallo! Marhaba!🌟
Dear Money Makers & Robbers, 🤑💰✈️
Based on 🔥Thief Trading style technical and fundamental analysis🔥, here is our master plan to heist the XAU/USD "The Gold" Metal Market. Please adhere to the strategy I've outlined in the chart, which emphasizes short entry. Our aim is the high-risk Blue MA Zone. Risky level, oversold market, consolidation, trend reversal, trap at the level where traders and bullish robbers are stronger. 🏆💸"Take profit and treat yourself, traders. You deserve it!💪🏆🎉
Entry 📈 : "The heist is on! Wait for the MA breakout then make your move at (3000) - Bearish profits await!"
however I advise to Place sell stop orders above the Moving average (or) after the Support level Place sell limit orders within a 15 or 30 minute timeframe most NEAREST (or) SWING low or high level.
📌I strongly advise you to set an "alert (Alarm)" on your chart so you can see when the breakout entry occurs.
Stop Loss 🛑: "🔊 Yo, listen up! 🗣️ If you're lookin' to get in on a sell stop order, don't even think about settin' that stop loss till after the breakout 🚀. You feel me? Now, if you're smart, you'll place that stop loss where I told you to 📍, but if you're a rebel, you can put it wherever you like 🤪 - just don't say I didn't warn you ⚠️. You're playin' with fire 🔥, and it's your risk, not mine 👊."
📌Thief SL placed at the nearest/swing High or Low level Using the 4H timeframe (3050) Day/Scalping trade basis.
📌SL is based on your risk of the trade, lot size and how many multiple orders you have to take.
Target 🎯: 2960
XAU/USD "The Gold" Metal Market Heist Plan (Scalping/Day Trade) is currently experiencing a Neutral trend (there is a chance to move bearishness),., driven by several key factors.👇
📰🗞️Get & Read the Fundamental, Macro, COT Report, Quantitative Analysis, Sentimental Outlook, Intermarket Analysis, Future trend targets.. go ahead to check 👉👉👉🔗
⚠️Trading Alert : News Releases and Position Management 📰 🗞️ 🚫🚏
As a reminder, news releases can have a significant impact on market prices and volatility. To minimize potential losses and protect your running positions,
we recommend the following:
Avoid taking new trades during news releases
Use trailing stop-loss orders to protect your running positions and lock in profits
💖Supporting our robbery plan 💥Hit the Boost Button💥 will enable us to effortlessly make and steal money 💰💵. Boost the strength of our robbery team. Every day in this market make money with ease by using the Thief Trading Style.🏆💪🤝❤️🎉🚀
I'll see you soon with another heist plan, so stay tuned 🤑🐱👤🤗🤩

Gold is still weak, rebound can still be shortedThe 1-hour moving average of gold still continues to cross downwards, and the strength of gold shorts has not weakened; gold rebounds are still mainly short selling. Although gold rose after covering the gap for one hour, the upper shadow line soon fell. Gold is still weak overall, and gold is under pressure near 3050 in the short term.
Trading idea: short gold near 3042, stop loss 3052, target 3022
The above is purely a sharing of personal opinions and does not constitute trading advice. Investments are risky and you are responsible for your profits and losses.

Gold: Focus Remains on Buy-the-Dip Strategy
Gold witnessed another round of extreme volatility today, plunging below the 3000 level before quickly rebounding. Since then, the price has repeatedly tested support in the 3030–3018 range. So far, this support zone has held up well, suggesting buyers remain active at lower levels.
However, traders should keep a close eye on the 3047 resistance area, which may temporarily cap upward momentum. In the short term, the overall strategy remains focused on buying at lower levels, with the potential for prices to revisit the 3080 region in the coming days.
That said, due to the sharp price swings recently, caution is advised for those looking to chase the rally above 3040. Unless your account has sufficient margin and risk tolerance to withstand a potential pullback toward the 3000 level, it is not recommended to enter aggressively at higher prices.
Trading Strategy Summary:
Bias: Short-term bullish (buy-the-dip)
Support zone: 3030–3018
Resistance: 3047 (short-term), 3080 (medium-term target)
Risk warning: Avoid chasing above 3040 unless risk control is well in place
Stay agile, and adjust your positions according to intraday price action. I will continue to provide real-time updates as the situation evolves.

Geopolitical Tensions, Supporting Bullish Outlook for GoldOver the weekend, geopolitical tensions remained elevated:
A mortar attack targeted the vicinity of Aden Adde International Airport in Mogadishu, Somalia.
U.S. forces launched airstrikes on key targets in Saada, a city in northern Yemen.
Ukrainian forces conducted multiple strikes on Russian energy infrastructure.
Massive protests erupted across dozens of U.S. cities, marking the first large-scale demonstrations since former President Trump returned to office. Trump described the recent U.S. stock market plunge as “intentional” and urged Americans to “stay strong.”
In Europe, Germany is reportedly considering repatriating 1,200 tons of gold reserves currently stored in the United States—signaling potential mistrust in global financial stability.
Fundamental Outlook
Given the ongoing geopolitical uncertainty, investor demand for safe-haven assets like gold is expected to remain strong. As risk sentiment continues to deteriorate, buyers are likely to dominate the market, especially on price dips. We anticipate increased buying interest next week, which could support gold prices and potentially lead to a breakout from the current consolidation zone.
Additionally, macroeconomic data releases will play a crucial role. The U.S. CPI report, due Thursday, will be the most closely watched indicator. A higher-than-expected CPI could cause markets to reassess the timing and scale of potential Fed rate cuts, resulting in a temporary rebound in the U.S. dollar and Treasury yields. However, sustained higher borrowing costs would intensify recession risks, limiting any dollar strength. This dynamic continues to favor gold in the medium to long term.
We are entering a phase where the fundamental and technical landscapes are increasingly aligned in favor of the bulls. The recent pullback in prices presents a strategic opportunity for medium- to long-term buyers to accumulate positions.
Those already holding long positions—whether currently in profit or facing temporary drawdowns—are advised to remain patient and avoid emotional exits. The broader structure remains supportive of higher prices in the coming sessions.
I will continue to provide real-time updates, entry/exit suggestions, and risk control strategies during market hours. Be sure to stay connected and follow the guidance closely.

4/7 Gold Trading StrategiesGold opened with a massive gap down today due to growing market panic, plunging below the $3000 psychological level. Although it briefly rebounded to $3030+, selling pressure intensified again, dragging prices back below $3000 and continuing to test lower support levels.
This sharp sell-off wiped out almost two months of previous gains. While the panic is real, it’s important not to be ruled by fear. Lower prices offer entry opportunities for long-term bullish capital. In such moments, we need courage as much as caution.
Rather than following fear blindly, we suggest looking for buy opportunities at lower support zones, with a combination of scalping tactics for short-term trades.
📌 Trading Strategy:
🟢 Buy Zone: $2980 – $2950
🔴 Sell Zone: $3040 – $3060
🔁 Scalping Zone: $3021 – $2996

GOLD (XAUUSD): Updated Support & Resistance Analysis
Here is my latest structure analysis for Gold for next week.
Support 1: 2997 - 3015 area
Support 2: 2952 - 2955 area
Support 3: 2916 - 2933 area
Support 4: 2880 - 2890 area
Support 5: 2832 - 2858 area
Resistance 1: 3136 - 3167 area
Consider these structures for pullback/breakout trading next week.
❤️Please, support my work with like, thank you!❤️
I am part of Trade Nation's Influencer program and receive a monthly fee for using their TradingView charts in my analysis.

XAU/USD "The Gold" Metal Market Heist Plan (Scalping/Day Trade)🌟Hi! Hola! Ola! Bonjour! Hallo! Marhaba!🌟
Dear Money Makers & Robbers, 🤑💰✈️
Based on 🔥Thief Trading style technical and fundamental analysis🔥, here is our master plan to heist the XRP/USD "Ripple vs U.S.Dollar" Crypto Market. Please adhere to the strategy I've outlined in the chart, which emphasizes short entry. Our aim is the high-risk Green Zone. Risky level, oversold market, consolidation, trend reversal, trap at the level where traders and bullish robbers are stronger. 🏆💸Book Profits Be wealthy and safe trade.💪🏆🎉
Entry 📈 : "The heist is on! Wait for the MA breakout then make your move at (3095) - Bearish profits await!"
however I advise to Place sell stop orders above the Moving average (or) after the Support level Place sell limit orders within a 15 or 30 minute timeframe most NEAREST (or) SWING low or high level.
📌I strongly advise you to set an "alert (Alarm)" on your chart so you can see when the breakout entry occurs.
Stop Loss 🛑: "🔊 Yo, listen up! 🗣️ If you're lookin' to get in on a sell stop order, don't even think about settin' that stop loss till after the breakout 🚀. You feel me? Now, if you're smart, you'll place that stop loss where I told you to 📍, but if you're a rebel, you can put it wherever you like 🤪 - just don't say I didn't warn you ⚠️. You're playin' with fire 🔥, and it's your risk, not mine 👊."
📌Thief SL placed at the nearest/swing High or Low level Using the 1H timeframe (3140) Day/Scalping trade basis.
📌SL is based on your risk of the trade, lot size and how many multiple orders you have to take.
Target 🎯: 3030 (or) Escape Before the Target
🧲Scalpers, take note 👀 : only scalp on the Short side. If you have a lot of money, you can go straight away; if not, you can join swing traders and carry out the robbery plan. Use trailing SL to safeguard your money 💰.
XAU/USD "The Gold" Metal Market Heist Plan (Scalping/Day Trade) is currently experiencing a Neutral trend (there is a chance to move bearishness),., driven by several key factors.👇
📰🗞️Get & Read the Fundamental, Macro, COT Report, Quantitative Analysis, Sentimental Outlook, Intermarket Analysis, Future trend targets.. go ahead to check 👉👉👉🔗
⚠️Trading Alert : News Releases and Position Management 📰 🗞️ 🚫🚏
As a reminder, news releases can have a significant impact on market prices and volatility. To minimize potential losses and protect your running positions,
we recommend the following:
Avoid taking new trades during news releases
Use trailing stop-loss orders to protect your running positions and lock in profits
💖Supporting our robbery plan 💥Hit the Boost Button💥 will enable us to effortlessly make and steal money 💰💵. Boost the strength of our robbery team. Every day in this market make money with ease by using the Thief Trading Style.🏆💪🤝❤️🎉🚀
I'll see you soon with another heist plan, so stay tuned 🤑🐱👤🤗🤩

Gold Rebound Looms: Don’t Miss the $50 OpportunityDuring his ongoing speech, Powell mentioned that tariffs may push inflation higher in the coming quarters. While inflation is currently close to the 2% target, it still remains above it. The market has already begun to anticipate a Fed rate cut, which is a potential bullish signal for gold.
From a technical perspective, the recent drop has partially corrected the previous bearish divergence. However, the divergence on the 1D chart still requires more time to be fully resolved.
At the current level, gold appears oversold. I do not recommend chasing short positions here. A short-term rebound is very likely, with a potential upside target between 3078-3096. If you manage the trade well, there’s an opportunity to capture at least $50 in profit.
If you’re currently holding long positions that are under pressure, stay strong. Don’t give up before the dawn — yesterday was a great example of why persistence matters.

4/4 Gold Trading StrategiesAfter yesterday’s sharp drop, gold quickly rebounded, and by the end of the session, prices had returned close to the opening level. I’m not sure if anyone is currently stuck in unfavorable positions. Under normal circumstances, if your account has sufficient margin and risk tolerance, such volatility shouldn’t cause major damage. However, for those with weak positions or who bought at the top or sold at the bottom, losses may have occurred—especially common among newer traders who are often influenced by emotions.
If you are currently holding short positions and hoping to wait for a price pullback, you'll need both time and sufficient margin. Based on current candlestick patterns, gold may attempt to test the 3128–3136 resistance zone again. Whether it moves higher will depend on the strength of the bulls.
Importantly, there are several key U.S. economic data releases during the New York session today. Based on preliminary expectations, the data appears to favor the bears, which could put additional pressure on gold prices.
📉 Today’s Trading Strategy:
Sell within the 3133–3152 zone
Buy within the 3065–3032 zone
📊 Scalping/Short-Term Trades:
Be flexible in the 3128–3088 range

XAUUSD SELLXAUUSD short again. Caught another opportunity to sell !!Setting my position at 3135 // TP 3000 SL 3235. Let's see how this trade rolls :)
Day 17of100
L:5
W:3

How will gold perform after the super rollercoaster market?Gold's 1-hour moving average still shows signs of turning downwards. Although gold bulls have made a strong counterattack, it is also because of the risk-aversion news that stimulated a retaliatory rebound. However, gold continued to fall after rising, and gold began to return to volatility. In the short term, gold is supported near 3100. If gold falls below the support near 3100 again, then gold shorts will still have an advantage in this war. Overall, the impact of today’s non-agricultural data is expected to be dim. What is more important is the stimulation of the news. However, it may be noted that if gold holds the 3100 mark for a long time, then gold is expected to fluctuate upward above 3100.
Trading idea: short gold near 3115, stop loss 3125, target 3100
The above is purely a sharing of personal views and does not constitute trading advice. Investments are risky and you are responsible for your profits and losses.

NFP - Shorting GoldThe gold market experienced huge fluctuations on Thursday, which created very good profits for us. During the entire trading process, we seized the profits of fluctuations of more than $50.
The unemployment rate and NFP data during the US trading session on Friday, as well as Powell's speech on the economic outlook, are the focus of Friday's trading.
Judging from the data released in March, the unemployment rate and NFP are more likely to be bearish for gold, so when trading data, my plan is to focus on short positions.
At present, in terms of technical form, the indicators show that the bulls have not ended. In this case, the transaction needs to pay attention to the 3123/3136 resistance. If it cannot break through, the price is expected to fall again to 3103 or even 3086.
Overall, today's trading focus is to sell at high levels.
4/3 Gold Trading StrategiesTariff concerns and inflation have once again triggered significant volatility in gold. After yesterday’s price surge following news announcements, today’s market opened with continued bullish momentum, reaching around 3170.
For traders who managed to keep up with the market rhythm, this was a golden opportunity—but for those caught on the wrong side, it was a disaster. The persistent price rally has put short sellers under significant pressure. While I hope most of you are in long positions, I also understand that’s not always the case. For those stuck in short trades, the key now is to minimize losses or even turn the situation into a profit.
Based on the current price structure, I expect a high-level pullback. If your short position isn't causing serious damage to your account, holding on could be a viable strategy.
The expected trading range includes a high point at 3166-3178 and a low point at 3138-3123. Additionally, several key technical levels need to be monitored for potential reversals.
Trading Recommendations:
📌 Main Trades:
Sell in the 3166-3182 range
Buy in the 3136-3121 range
📌 Short-Term Scalping:
Be flexible in the 3147-3158 range
Manage your risk carefully and adjust your trades based on market movements! 🚀

Data will be Bearish for GOLDAffected by tariffs and inflation news, gold fluctuated sharply before the market closed. The market was in a situation of double kills for both long and short positions, and the sentiment was still fermenting. At present, the bulls also took this opportunity to successfully break through the resistance, and the price returned to above 3140 again. From the perspective of the pattern, there is still room for growth in the short term.
Before the US market, you can look for trading opportunities in the 3158-3123 range. The unemployment benefit data will be released during the US market, and the data is expected to be bearish for gold. Therefore, within 30 minutes before the data is released, if you hold a long order, please be cautious. At that time, I will also send you the latest trading plan based on the market situation.
If you are currently in trouble and need help, you can leave me a message.

GOLD - Day Trading with RSI 04/03/2025FX:XAUUSD
Daily Timeframe (D1): Still in a strong uptrend, with RSI and both moving averages are pointing upwards. The WMA45 is above 60.
4-Hour Timeframe (H4): RSI is positioned between the resistance created by WMA45 (current price around 3152) and the RSI 60 support level (current price around 3121).
1-Hour Timeframe (H1): The WMA45 is trending upward, supporting the bullish trend.
Trading Plan: BUY
Entry Zone:
When the RSI on the M15 timeframe is supported at the 50 or 60 levels.
Entry Confirmation:
When M5 completes a wave, or a divergence appears.
Or even when M1 shows divergence.
Stop Loss:
20–30 pips below the M5 low.
Take Profit:
100 pips or R:R ≥ 1:1.
Or when M5 completes its own uptrend.
But be careful when RSI on H4 reaches its own WMA45.
You can check out the indicators I use here: tradingview.com/u/dangtunglam14/

GOLD: May fall below 3100So far, gold has continued to fluctuate in the 3110-3136 range. Although the candle chart has many long lower shadows, the high point is moving down. If this trend is not broken, the probability of falling below 3100 today is very high, so when trading, everyone must be cautious. Personally, I suggest selling as the main method.
