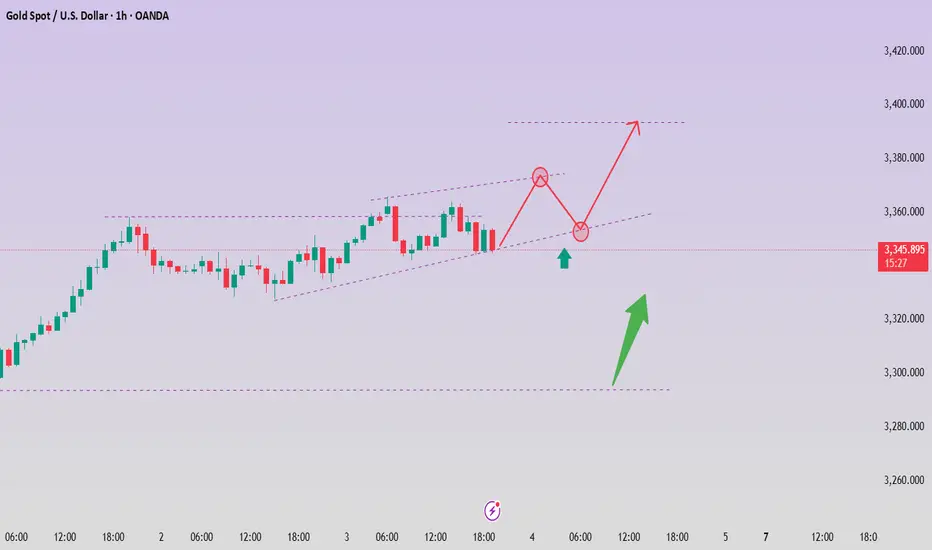
7/4: Trade Within the 3313–3346 RangeGood morning, everyone!
Yesterday’s intraday trades delivered solid profits. Since the U.S. market will be closed today, news-driven volatility is expected to be limited. Therefore, today’s trading focus will primarily revolve around technical setups.
Current structure:
Key support: 3321–3316
Immediate resistance: 3337–3342, followed by 3360
If support holds and resistance breaks, a potential inverse head-and-shoulders pattern may form on the 4H chart, with the next target near 3380
If support breaks, focus shifts to the 3303–3289 support zone
Given the likelihood of range-bound price action today, the suggested intraday range is 3313–3346, with a preference for selling near resistance and buying near support.
If an upside breakout occurs, consider using the MA20 on the 30-minute chart as a guide for pullback entries.
Xauusdtrading

Gold grows, recovers near 3390
📣Gold News
Gold prices edged higher during the North American trading session as investors turned their attention to the upcoming U.S. non-farm payrolls report (NFP), which could influence the Fed's next policy move.
The latest labor data showed that companies are pausing hiring rather than laying off employees, reflecting caution in an uncertain economic environment. Meanwhile, Microsoft's decision to lay off 9,000 employees has heightened concerns about a weak labor market.
Traders are currently awaiting the official employment report from the U.S. Bureau of Labor Statistics on Thursday, which is expected to show 110,000 new jobs in June, down from 139,000 in May. The unemployment rate is expected to rise slightly to 4.3%, still within the 4.4% range of its forecast according to the Fed's latest summary of economic projections.
📣 Technical Analysis
NF is worth buying before the news release, holding. The dollar continues to be under selling pressure from investors worried about the Trump administration's erratic tariff policy.
💰Set Gold Price:
💰Sell Gold Zone: 3390-3398 SL 3405
TP1: 3380 USD
TP2: 3363 USD
TP3: 3350 USD
💰Buy Gold Zone: 3296-3294 USD SL 3289 USD
TP1: 3308 USD
TP2: 3318 USD
TP3: 3330 USD
⭐️Technical Analysis:
Set reasonable buy orders based on technical indicators EMA 34, EMA89 and support and resistance areas.
This is the reason why gold suddenly "changed its face"!
📣 Gold News
Spot gold closed up $28.59, or 0.87%, at $3,302.71 per ounce on Monday. Gold prices fell to around $3,246 per ounce in early Asian trading, the lowest level since May 29.
At 21:30 Beijing time on Tuesday, Federal Reserve Chairman Powell, European Central Bank President Lagarde, Bank of England Governor Bailey, Bank of Japan Governor Kazuo Ueda, and Bank of Korea Governor Lee Chang-yong will hold a group meeting.
Last Tuesday and Wednesday, Federal Reserve Chairman Powell attended a congressional hearing and said that the Fed needs more time to observe whether tariffs make inflation rise higher before considering cutting interest rates.
Powell said in his congressional testimony that he and most Fed officials expect inflation to start to pick up soon, and the Fed is not in a hurry to cut interest rates before that.
Powell said: "At present, we have good conditions to wait and further understand the possible development path of the economy before considering whether to adjust the policy stance." Yesterday, gold opened at $3381.6 and quickly fell back, reaching a low of $3248.8, then rebounded, rebounded in the early trading and touched $3270 and fell again, gold fell back, reaching a low of $3259.4, then gold did not continue to fall, and rebounded. Gold continued to rebound in the European and American markets, with the highest rebound in the US market reaching $3309.4, and finally closed at $3002.9 in the late trading. The monthly line closed with a long upper shadow line and a shooting star pattern. After such a pattern ended, today's gold rebounded high, and the upper resistance focused on the $3326 line. The rebound relied on the resistance below here to short, and the lower side looked at the $3295 line.
Gold Is Set to Bottom Out and Rebound This WeekGood morning, everyone!
At today’s open, gold once again dipped into the 3258–3248 buy zone, then rebounded toward 3270. From a structural perspective, gold has clearly entered a downward trend, but this decline is unlikely to be one-directional—short-term rebounds and consolidations are expected along the way.
Based on my experience, below 3250 remains a favorable area for initiating long positions. Whether the price rebounds directly or continues lower before building a stronger base to challenge 3300 again, the broader outlook remains bullish as long as the 3200 support holds. A bottoming reversal this week is still the more probable scenario.
As such, the focus early this week should be on buying near the lows, with short opportunities on rebounds as a secondary strategy. Monitor key support levels for signs of strength.
This week is also packed with important data—including PMI, Non-Farm Payrolls (NFP), and the unemployment rate, in addition to regular economic releases. Given the current macroeconomic backdrop, significant market volatility is expected—bringing both risk and opportunity. Manage your exposure carefully and stay adaptable.

Gold long-short strategy US trading range operation
Gold prices (XAU/USD) recovered some of their losses during Monday's Asian trading session, driven by expectations that the Federal Reserve may cut interest rates further this year (and perhaps earlier than previously expected). This prospect weighed on the dollar, making dollar-denominated gold more attractive to overseas buyers.
However, the recent improvement in global risk sentiment (driven by the US-China trade agreement and the Israeli-Iranian ceasefire agreement) may reduce the safe-haven demand for gold. Investors will now turn their attention to upcoming comments from Federal Reserve officials, with Atlanta Fed President Rafael Bostic and Chicago Fed President Austan Goolsbee expected to speak later in the day.
Gold prices recovered, accumulating around the 3,300 price range at the beginning of the new week. Still in a major downtrend.
⭐️Set Gold Price:
🔥Sell Gold Area: 3316-3318 SL 3323
TP1: $3305
TP2: $3290
TP3: $3277
🔥Buy Gold Area: $3248-$3246 SL $3241
TP1: $3258
TP2: $3270
TP3: $3286
⭐️Technical Analysis:
Set reasonable buy orders based on technical indicators EMA 34, EMA89 and support and resistance areas.

XAUUSD:Sharing of the Latest Trading StrategyAll the trading signals this week have resulted in profits!!! Check it!!!👉👉👉
Early Session Dynamics:
Gold rebounded in today’s early trading after finding support at the prior low of 3245, aligning with our weekly forecast. The intraday strategy prioritizes a low-level rebound correction, with short positions to be initiated at resistance levels.
Key Technical Levels:
Resistance: 3295–3308
Support: 3250–3240
4-Hour Chart Perspective:
The market remains weak with high volatility. The double-bottom effect at 3245 is unconfirmed, and no bottoming pattern has emerged. Thus, the week’s initial outlook is for a range-bound oscillation between 3308 and 3240:
A rebound opportunity exists as long as 3240 holds.
A break above 3308 could trigger upward momentum.
Intraday Trading Strategy:
Lacking follow-through in the European session, the short-term trend is viewed as range-bound
Sell@3305-3295
TP:3285-3250
buy@3250-3260
TP:3285-3300

Gold continues to be weak, but be careful about operations
📣Gold prices fell 2% last Friday, hitting a near one-month low. Optimistic trade-related agreements boosted risk appetite and weakened the attractiveness of gold as a safe-haven asset. This week, the market will usher in a group meeting of major central bank governors around the world (Fed Chairman Powell, European Central Bank President Lagarde, Bank of England Governor Bailey, Bank of Japan Governor Kazuo Ueda, and Bank of Korea Governor Lee Chang-yong). The market will also usher in non-agricultural data. In addition, Powell's remarks on whether to resign may ignite the market this week. Gold prices may fluctuate more around the lower track of the Bollinger Band at $3,270/ounce this week.
Technical analysis:
Last Friday, the K-line had a lower shadow, and the Bollinger Band did not diverge. It is not easy to go short directly in operation, but wait for the rebound to confirm 3295 and the key resistance of ma5 to be short.
💰 Operation strategy: Rebound to 3280-3283 to go short, target 3270-3265, stop loss 3288-3290

"The Great Gold Heist" – XAU/USD Master Plan🏆 "The Great Gold Heist" – XAU/USD Master Plan (High-Risk, High-Reward Loot!) 🚨💰
🌟 Attention, Market Robbers & Money Makers! 🌟
Hola! Oi! Bonjour! Hallo! Marhaba! 🤑💸
🔥 Based on the legendary Thief Trading Strategy (technical + fundamental heist tactics), here’s our blueprint to STEAL massive profits from the XAU/USD (Gold vs. Dollar) market! 🔥
🎯 The Heist Plan (Long Entry Setup)
Entry Point 📈: *"The vault is UNLOCKED! Swipe bullish loot at any price—but for a cleaner steal, set Buy Limits within 15-30M recent swing lows/highs. ALERT UP! ⏰"*
Stop Loss 🛑: "Thief’s SL hides at the nearest swing low (3H TF: 3250.00) OR below the last daily candle wick. Adjust based on your risk appetite & lot size!"
Target 🏴☠️: 3490.00 (or escape early if the cops—err, bears—show up!)
⚡ Scalper’s Quick Loot Guide:
"Only scalp LONG! Rich? Go all-in. Broke? Join the swing traders & rob slow ‘n’ steady. Use Trailing SL to lock profits!"
📊 Market Status:
XAU/USD (GOLD) – Neutral (But Bullish Sneak Attack Likely! 🐂💥)
"The heist is ON, but watch for traps—overbought zones, consolidation, and bearish robbers lurking!"
🔍 Pro Thief Moves:
✅ Fundamentals Matter! (COT Reports, Geopolitics, Macro Data, Sentiment—check our BIO0 for the full loot list!) 🔗👉🏻☝🏻
✅ News = Danger! Avoid new trades during releases. Trail your SLs to protect stolen cash! 📰🚨
💖 Support the Heist Crew!
"Hit the BOOST BUTTON 💥 to strengthen our robbery squad! More boosts = easier money steals daily!"
🚀 Stay tuned—another heist drops soon! 🐱👤💎

Gold Analysis and Trading Outlook – June 27Good morning, everyone!
Yesterday, gold encountered resistance in the 3348–3352 zone and fell back to around 3310 before rebounding toward the 3336 resistance area. Today’s session opened with renewed weakness, and so far, the overall price action has closely followed our expectations. Whether it was selling near resistance, buying after the dip, or shorting the rebound, each opportunity yielded solid profits.
Some traders have asked about my strategy’s win rate. Those who’ve followed consistently already know—the overall win rate has remained above 80%, with very few instances of error. Even in the rare case of a misjudgment, I apply specific recovery strategies to minimize risk and avoid large losses. That’s the core reason why I’m confident I can help many traders.
Technically, the daily chart still shows a bearish trend, and prices are now approaching the key 3300 support zone. While the current geopolitical uncertainty adds complexity, it doesn't prevent us from executing flexible intraday trades. In fact, range-bound markets can still be highly profitable with a disciplined approach.
Key intraday levels to watch:
Dynamic support: 3318–3313
Major support: 3300–3287
Resistance levels: 3336, 3348–3352, and 3370
Today’s trades can continue to focus on these levels, using a sell-high, buy-low strategy with flexibility.

Gold fluctuated and fell, and the rebound was directly short
📣Gold News
Due to the easing of the situation in the Middle East, gold has fallen in the past few days, and the market has been eagerly looking forward to the interest rate cut, because the tariffs in the Trump era may push up inflation, but it has not come yet. "
On Thursday, the U.S. Department of Labor and Commerce issued key economic data, including initial jobless claims and the final value of real GDP in the first quarter. The number of initial jobless claims was 236,000, a decrease of 9,000 from 245,000 in the previous week, better than the market expectation of 245,000. At the same time, as of June 14, the number of continued unemployment claims in the week increased by 37,000 to 1.974 million, a new high since November 2021. Gold stopped below the moving average today. Gold did not continue the small positive line rise, and the decline continued during the U.S. trading period.
Today, focus on the continuation of short positions, comprehensive Labaron believes that gold is bearish today. For today's operation, consider rebound shorting as the main, and low long as the auxiliary.
📣 Pay attention to the resistance of 3330-3345 US dollars above
📣 Pay attention to the support of 3300-3280 US dollars below
💰 Go long near 3295-3285, target 3310-3320
💰 Go short near 3330-3340, target 3000-3290
If you have just entered the market, you are confused about the market of gold, oil and silver, and you always do the opposite operation direction and the entry price is unstable. I hope Labaron's article will help you.

6/25 Gold Analysis and Trading ViewGood morning, everyone!
Gold experienced a sharp decline yesterday. Technically, the conditions for a rebound are in place, but since a solid bottom structure has yet to form, a retest to the downside is likely during today’s session.
Key levels to watch:
Resistance zone: 3336–3348
Support zones: Primary support at 3313–3303, with additional support around 3296–3282
Today’s overall strategy remains buying on dips as the primary approach, with short opportunities near resistance as a secondary option.
Key scenario to monitor:
If the price drops to around 3280 but fails to rebound toward 3336, and the daily close ends below 3300, then the buy-on-dip strategy will likely continue into tomorrow.

Can we still go long if the decline of gold intensifies?
📊Comment Analysis
Looking back at today's trend, it rose to a high of 3350, and then continued to retreat. The current low is 3310. At present, due to the upward trend line broken by the hourly line, many orders can only be short. The trend is still biased to the short side, and the current market risk aversion does not facilitate the longs. But first of all, one thing can be confirmed that this round of gold decline lasted for a long time, which also enhanced the execution of gold to go long near 3310-3320 in the future.
Since gold has fluctuated greatly in the past two days, it means that the end point of emotions will not disappear so easily for the time being. In the short-term K-line pattern, continuous short-side artillery should not be constantly changed and increased. It is necessary to stop and see appropriately. The early trading is relatively difficult to grasp, but at least the current market has given some signals, so I hope that when the market is in place, your execution will be strong enough, and then you can look at gold according to the trading signals I gave. The rehearsal is definitely exciting enough, but the actual operation is not that simple!
💰Strategy Package
Gold: Pay attention to the low-long opportunities of 3310-3220 in the US market, and defend at the 3300 line. If the retracement continues, go long directly. Otherwise, the upper resistance will be around 3345!
⭐️ Note: Labaron hopes that traders can properly manage their funds
- Choose the number of lots that matches your funds

6/26 Gold Analysis and Trading ViewGood morning, everyone!
Yesterday, gold rose to around 3336 before pulling back, then revisited the same level again. The buy-on-dip strategy performed well, delivering solid profits.
At today’s open, prices have moved slightly higher but remain near resistance. Technically, there’s potential to test the 3350 area, and if the move is strong, a rally toward 3370 is also possible.
If gold reaches this zone, it may present a favorable short-term selling opportunity. Therefore, today's trading strategy should focus on range-based trading between 3326-3368, selling near resistance and buying near support.
Key levels to watch:
Resistance: 3348–3352
Support: 3326–3318
Lastly, be mindful: if a trending move emerges, adjust your strategy accordingly and avoid counter-trend trades. Stay flexible and manage risk wisely.

Gold fluctuated slightly, retreating to low-multiple operations
📌 Gold news
During the North American trading session on Wednesday, gold prices remained stable, rising by more than 0.30% as easing tensions between Israel and Iran boosted risk sentiment. Meanwhile, disappointing US housing data may prompt the Federal Reserve (Fed) to take action in the future. However, Fed Chairman Jerome Powell's continued tough stance has limited further upside for gold.
📊Comment analysis
Gold fluctuated in a small range yesterday, and the daily line closed with a positive cross star.
Daily support is around 3327-3324, and you can go long if you touch it.
Daily resistance is around 3368, and you can go short if you touch it.
If the market goes down to yesterday's low, the bottom continues to look near this week's low, and I am more inclined to be bullish
💰Gold operation strategy
If gold is close to 3327, you can go long, with a target of 3345.
Look for opportunities to short around 3350-3360, with a target around 3330.
I hope Labaron's article can help you with your investment. If you don't understand something, you can find me. I am not only a mentor, but also a friend worth making in your life.
⭐️ Note: Labaron hopes that traders can properly manage their funds
- Choose the number of lots that matches your funds

XAUUSD: Trend changed to bearish. Significant downside potentialGold turned neutral again on its 1D technical outlook (RSI = 49.253, MACD = 18.142, ADX = 16.679) as it crossed below both the 4H MA200 and 1D MA50. The two form a Bearish Cross. Technically a Channel Down has emerged, no different than those that emerged after rejections on the R1 Zone (like now). As long as the 4H MA50 acts as a Resistance and holds, we will be bearish, aiming at the S1 level (TP = 3,245).
## If you like our free content follow our profile to get more daily ideas. ##
## Comments and likes are greatly appreciated. ##

Opportunities only come to those who ambush in advanceAfter Trump announced that Israel and Iran had reached a comprehensive ceasefire agreement, the market's risk aversion sentiment cooled significantly, and the price of gold once plummeted by more than $30. Although the stability of the ceasefire agreement is in doubt, the rebound in risk appetite dominates the market trend, with stock markets rebounding, oil prices falling, and demand for safe-haven assets falling. Powell will deliver a semi-annual monetary policy testimony, and the market is paying attention to his statement on the timing of the July rate cut. At present, the internal differences of the Federal Reserve on interest rate cuts have intensified. If Powell sends a signal that the number of interest rate cuts this year is limited, it may strengthen the rebound of the US dollar and suppress gold prices; on the contrary, if the stance is dovish, it may ease the downward pressure on gold prices. In the short term, the fading of geopolitical risks and the warming of risk appetite are the main reasons for the decline in gold prices, but the weakening of the US dollar and the potential dovish tendency of the Federal Reserve still provide support. In the medium and long term, global economic uncertainty, geopolitical risks and expectations of the Federal Reserve's loose policy still constitute structural support for gold.
From a technical perspective, the gold daily moving average system is in an intertwined state, and the forces of bulls and bears are relatively balanced. The current short-term resistance above is around 3320-3333, which is an important psychological level. If an effective breakthrough is achieved or the upside space is opened, the support below will focus on the 3285-3295 line, which is the lower edge of the May oscillation platform. If it falls below, the pressure of the correction may increase. The loss of the middle track in the 4-hour chart further confirms the short-term weak structure and provides technical support for the downward trend. It is recommended to go long on the pullback near 3285-3295. At present, gold continues to fall in line with the trend.

Gold today high-altitude low-multiple operation
📌 Gold news
On Tuesday, the spot gold price plummeted, hitting a two-week low. The main reason was that Iran and Israel announced a ceasefire, which suppressed the demand for safe-haven gold. In addition, Fed Chairman Powell made hawkish remarks, which also hit the gold price trend. Short-term long-short game will focus on the PCE inflation data to be released by the United States. If the economic data performs poorly or inflation continues to fall, it may still provide a medium-term rebound opportunity for gold.
📊Comment analysis
Yesterday, gold was weak overall, and the decline and rebound were limited. It fell directly from around 3357 to 3295, and then rebounded according to the news. It ran around 3326 in the morning. From a technical point of view, the daily low trend line support is around 3290, the 4-hour long lower shadow line bottomed out, and three consecutive positive rebounds, the daily line supports the lower track of the Bollinger band, and the Bollinger band tends to be parallel. There is no sign of opening downward, so the short-term decline of gold prices is limited. Consider paying attention to the support of 3294 during the day, and mainly use this position for defense and low long. Pay attention to the important suppression of the middle track 3363 above, and mainly short.
💰Strategy Package
Focus on the support near 3316-3317 in the short term, rely on this position to go long, stop loss 3307, take profit near 3345, and break 3363. If it falls strongly below 3294, then don't consider going long during the day.
Gold operation strategy: long near 3316, stop loss 3307. Take profit 3345
⭐️ Note: Labaron is not 100% correct here, only a steady operation idea, large warehouse for trend, small warehouse for wave, control the proportion by yourself, there is no unprofitable investment, only unsuccessful orders, whether to make money depends on the timing of buying up and buying down, making money depends on opportunities, investment depends on wisdom, and financial management depends on professionalism.

6/24 Gold Analysis and Trading OutlookGood morning, everyone!
Gold closed yesterday with a T-shaped candlestick. Although there was an intraday recovery after briefly breaching the MA20, the closing price remained below the MA5, indicating continued pressure on the upside.
Today’s opening saw a direct drop in price, suggesting a potential break below key support. Two important levels to monitor today:
Whether the closing price stays above 3355
Whether the intraday support at 3328 holds
If 3328 breaks down, the 3300 level may become the next major battleground between bulls and bears.
Driven by geopolitical news, gold has shown sharp volatility over the past two days. While this increases trading risk, it also presents more opportunities. From a technical perspective, today’s strategy should prioritize selling on rebounds, with buying at lower levels as a secondary approach. As always, stay disciplined and manage risk effectively.

Iran and Israel ceasefire? Gold price falls and adjusts
📌 Gold information:
Gold prices continued to be well supported during the North American trading session following the breaking news of Iran's retaliatory attack on the US military base in Qatar. The escalation was a response to Washington's weekend attack on Iran's nuclear facilities. As geopolitical tensions in the Middle East dominated the headlines, investors largely ignored US economic data
Macroeconomic indicators have taken a back seat as the intensification of the conflict has affected market sentiment. Arab TV cited Israeli media reports that Iran used missiles to attack US bases in Qatar, Kuwait and Iraq. In further escalation, Tehran approved the closure of the strategic Strait of Hormuz and launched more missiles at Israeli targets, which amplified the safe-haven demand for gold.
The situation in the Middle East has mixed signals. Trump announced a "stop" to the Iran-Israel conflict, while the exchange of fire between the two sides continued, and the proportion of gold longs fell back
📊Commentary Analysis
Gold prices responded to the reduction of positive news on peace in the Middle East and continued to rise.
💰Strategy Package
Short when the price rebounds to around 3370, stop loss at 3480, target at 3350-3388 points
Long around 3310-3320, stop loss at 3300, target at 3360-3368 points
⭐️ Note: Labaron hopes that traders can properly manage their funds
- Choose the number of lots that matches your funds

6/23 Gold Analysis and Trading ViewsGood morning, everyone!
Over the weekend, former President Trump announced and carried out an attack on Iran's nuclear facilities, triggering a renewed wave of risk-off sentiment in the markets. At today’s open, gold surged to around 3394. Driven by geopolitical tensions, the bearish technical structure has temporarily been disrupted.
Whether the bullish momentum can sustain will depend on how the situation continues to unfold.
Key technical levels to watch today:
Resistance: 3389 / 3407 / 3423 / 3432
Support: 3372 / 3365 / 3356 / 3348
Trading strategy: Given the current news-driven market, a buy-on-dip approach is preferred, with short positions as a secondary option depending on price reaction near resistance zones.
Also, pay close attention to today’s daily close (1D chart). If the price closes below 3355, it could signal profit-taking from the bulls, potentially pulling gold back into a bearish technical trend.

Middle East war, gold breaks through 3400 early next week
Hello everyone:
Let's analyze the gold price next week (June 23, 2025 to June 27, 2025)
📌Gold information:
Gold prices held steady on Friday, hovering around $3,369, and are expected to fall nearly 1.90% this week as the market digests U.S. President Donald Trump's decision to abandon immediate military action against Iran and turn to diplomacy. As of writing, XAU/USD fell 0.11%.
While easing geopolitical tensions helped boost risk sentiment, concerns that the United States may restrict allies operating semiconductor factories in China put additional pressure on gold, according to Bloomberg. Trump's restraint on Iran encouraged risk appetite and suppressed the appeal of this safe-haven metal.
What has President Trump been busy with in the past 24 hours? (2025-06-22)
1. Announced the successful airstrike on Iran's three nuclear facilities - Trump issued a message saying that he had successfully launched attacks on Iran's three nuclear facilities, including Fordow, Natanz and Isfahan. The main target Fordow nuclear facility was bombed with a full load of bombs. All fighter jets are returning safely. Iran's Fordow (nuclear facility) no longer exists.
2. Was willing to go to Turkey to negotiate with Iran in person - According to the AXIOS website, sources said that when Trump attended the G7 summit last Monday, Erdogan called and proposed to hold talks between US and Iranian officials in Istanbul the next day to explore diplomatic solutions to the war. Trump agreed, and he was willing to send Vice President Vance and White House envoy Vitkov, and even if necessary, he was willing to go in person. But it was later cancelled because Khamenei could not be contacted.
3. Threatening to strike Iran again if the conflict does not stop - According to Reuters, US President Trump said in a telephone interview that tonight was a stunning success and Iran should immediately achieve peace and stop the war, otherwise they will be hit again.
4. Saying that Iran will either usher in peace or fall into tragedy - Trump said that the US goal is to destroy Iran's nuclear enrichment capabilities and stop Iran's nuclear threat. Iran's facilities have been completely destroyed. Iran will either usher in peace or fall into tragedy. Many goals have not yet been achieved. Tonight's strike is the "toughest target". If peace is not achieved in the future, other targets will be accurately struck.
5. Warning Iran not to retaliate - Trump posted on social media: "Any retaliatory action by Iran against the United States will lead to a military response 'far beyond what we saw tonight.'"
6. US Democratic lawmakers call for Trump's impeachment - On the evening of June 21, local time, according to NBC, New York Democratic Congresswoman Alexandria Ocasio-Cortez said that President Trump's decision to attack Iran without the authorization of Congress "absolutely and clearly constitutes grounds for impeachment." She said that the US President's disastrous decision to bomb Iran without authorization was a serious violation of the Constitution and Congress' war powers.
📣Personal analysis:
Tensions in the Middle East escalate, and gold prices will continue to rise above 3400 at the beginning of next week
🔥 Technical:
Based on the resistance and support levels of gold prices on the 4-hour chart, Labaron identified the important key areas as follows:
Resistance: $3395, $3448
Support: $3302, $3255
⭐️ Note: Labaron hopes that traders can properly manage their funds
- Choose the number of lots that matches your funds

6/20 Gold Analysis and Trading SignalsGood evening, everyone!
After gold rallied to around 3388 yesterday, it began to retrace gradually, providing solid returns for our sell-side strategy.
As of now, gold has dipped to a session low near 3339. On the 30-minute chart, the MACD has formed a bullish crossover, and price has broken above the Bollinger mid-band, indicating short-term bullish momentum. The candle structure supports a potential rebound, but strong overhead resistance remains.
Key resistance comes from the 1H MA60 around 3371, and gold still trades within a broader bearish trend on the daily timeframe. While bulls may attempt a recovery, a complete trend reversal remains unlikely unless significant bullish catalysts emerge.
Hence, our strategy continues to favor selling near resistance levels, while cautiously considering long entries near well-defined supports.
📌 Trading Plan (VIP Focus):
✅ Sell Zone: 3370–3383
✅ Buy Zone: 3338–3321
✅ Flexible Trade Range: 3366-3349

6/19 Gold Analysis and Trading SignalsGood morning!
Yesterday, the Federal Reserve's interest rate decision aligned with market expectations, bringing no major surprises. The market had already priced in bearish sentiment in advance, which led gold to trade within the Bollinger Bands' upper, middle, and lower bounds, with all three bands trending sideways, indicating limited intraday volatility.
🔍 Technical Overview:
On the 30-minute chart, the Bollinger Bands began to tilt downward near the close, with price currently pressured by the middle band;
However, MACD structure suggests the middle band may be broken, with potential for price to challenge the upper band resistance near 3392–3400;
More importantly, on the 1D chart, the MACD is showing signs of a bearish crossover (death cross). If confirmed, it may break the bullish structure, weakening support from the weekly MA5;
If gold sustains below the weekly MA10 at 3317, it could open the door for a broader correction, with a drop toward 3200 becoming increasingly likely.
📊 Fundamental Factors:
Today’s U.S. market holiday means fewer economic data releases. As such, gold will likely be driven by technical structure and geopolitical headlines, especially those related to the Middle East. If no new developments emerge, selling on rallies remains the preferred strategy.
📌 Trading Plan (VIP-Focused):
✅ Sell Zone: 3392–3409
✅ Buy Zone: 3338–3321
✅ Scalp/Flexible Zones: 3387 / 3373 / 3364 / 3356 / 3345
