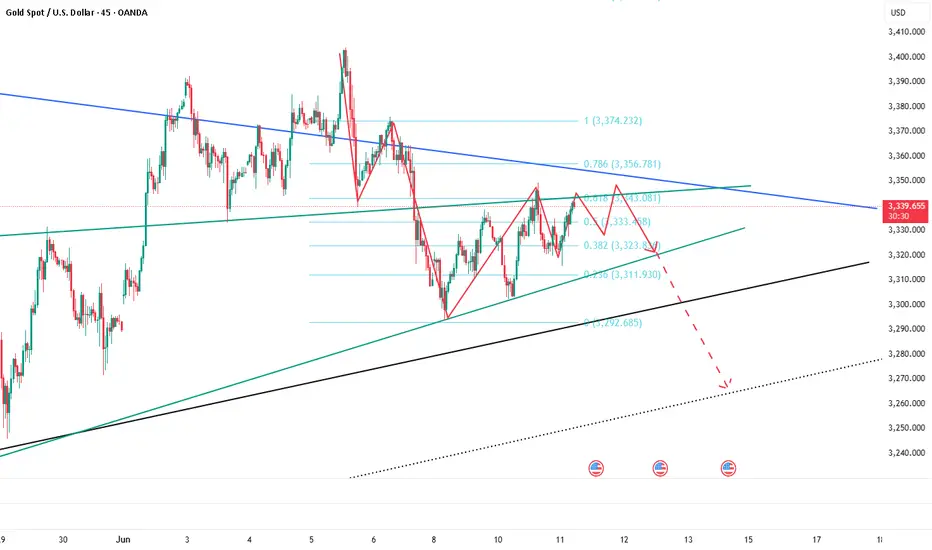
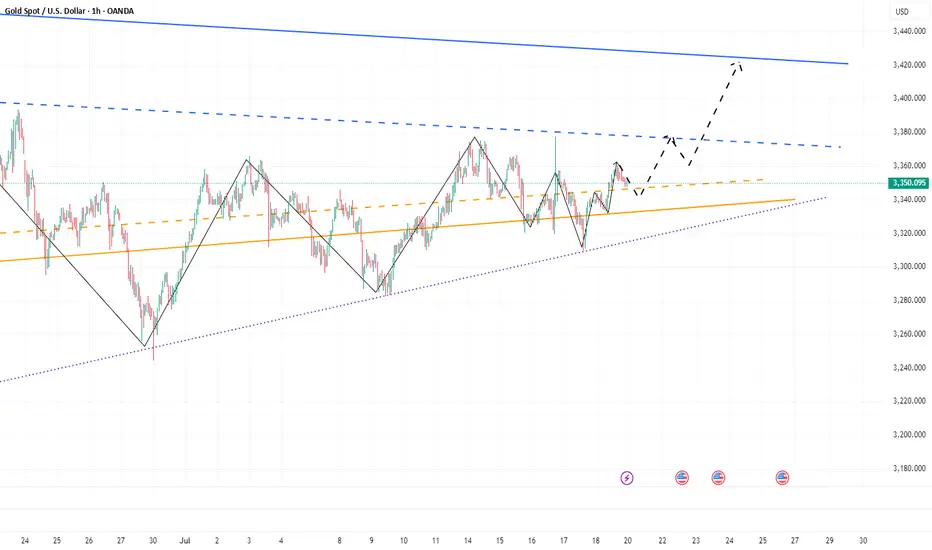
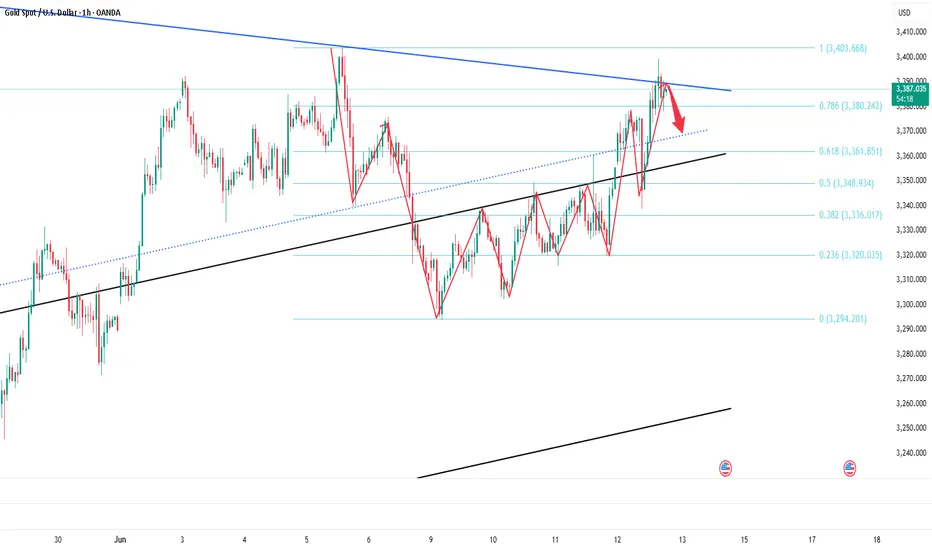
Gold is surging, can it hit 3500?Due to the trade tensions caused by tariffs and the continued conflict between the White House and the Federal Reserve, gold continued to rise, and the current highest has reached around 3438. Obviously, after gold rose strongly and broke through the 3400 and 3420 areas, the bullish sentiment of gold has been ignited. Next, we need to pay attention to whether gold can test and stand firm at 3450.
Gold is currently extremely strong, and there is basically no room for retracement during the rise. As gold rises, the short-term support below has also moved up to the 3415-3405 area; and the upper side needs to pay attention to the breakthrough of the 3450 mark. If gold continues to break through 3450, then gold has the potential to challenge 3500 again; however, if gold still cannot effectively break through when it touches the area near 3500 again, the sentiment of gold cashing out and leaving the market may be stimulated, resulting in gold There may be room for retracement in the short term. If gold falls below 3400 during the retracement, the decline may continue to the 3395-3385 area.
Therefore, for the next short-term trading, we can first wait for the opportunity for gold to pull back, and then consider going long on gold with the 3415-3405 area as support; if gold does not give a chance to pull back, then when gold first touches the area around 3440-3450, we can consider starting to short gold.
Xauusdtradingstrategy
Gold’s Rapid Surge: A Trap Before the Drop?Gold finally showed signs of retreat. We are still holding a short position near 3400. So far, we have made a profit of 50 pips. However, I will still hold it to see if gold can fall back to the 3385-3375 area as expected. We have completed 2 transactions today, and there is still 1 transaction left to hold.
1. First, we bought gold near 3345 and ended the transaction by hitting TP: 3370, making a profit of 250 pips, with a profit of more than $12K;
2. We shorted gold near 3385 and ended the transaction by hitting SL: 3395, with a loss of 100 pips, a loss of nearly $5K;
3. We are still holding a short gold transaction order near 3400, with a current floating profit of 60 pips and a floating profit of nearly $4K;
The above is the detailed transaction situation today. To be honest, today's rebound strength far exceeded my expectations, and after our first long position hit TP, the market never gave any chance to go long on gold after a pullback, but accelerated to around 3401. But obviously, the accelerated rise of gold is suspected of catching up with the top, and in the short term it faces resistance in the 3405-3410 area, and secondly pressure in the 3420-3425 area. So I don't advocate chasing gold at the moment. On the contrary, I am still actively trying to short gold around 3400, first expecting gold to pull back to the 3385-3375-3365 area.
And I think if gold wants to continue to test the 3405-3415 area, or even sprint to the area around 3425, gold must go through a pullback to increase liquidity to accumulate upward momentum. I think it will at least pull back to the 3385-3375 area.
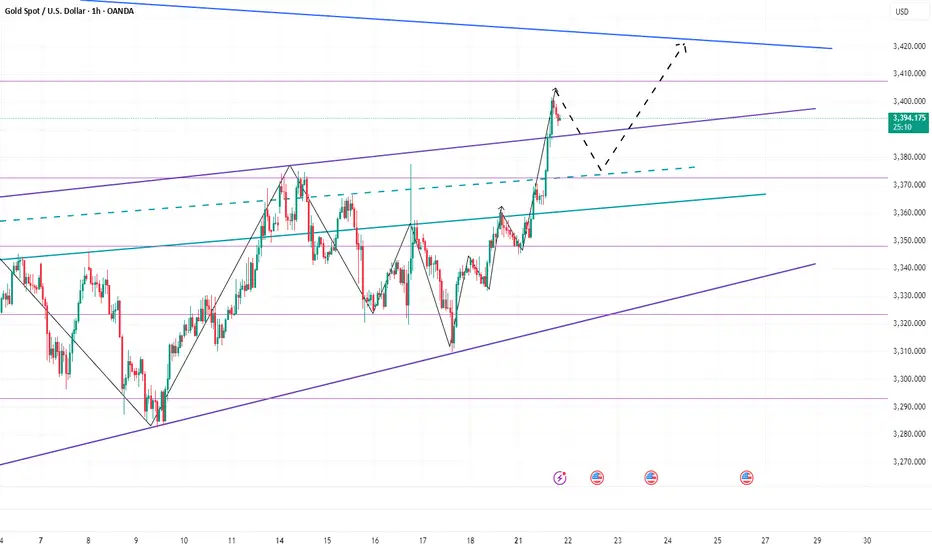
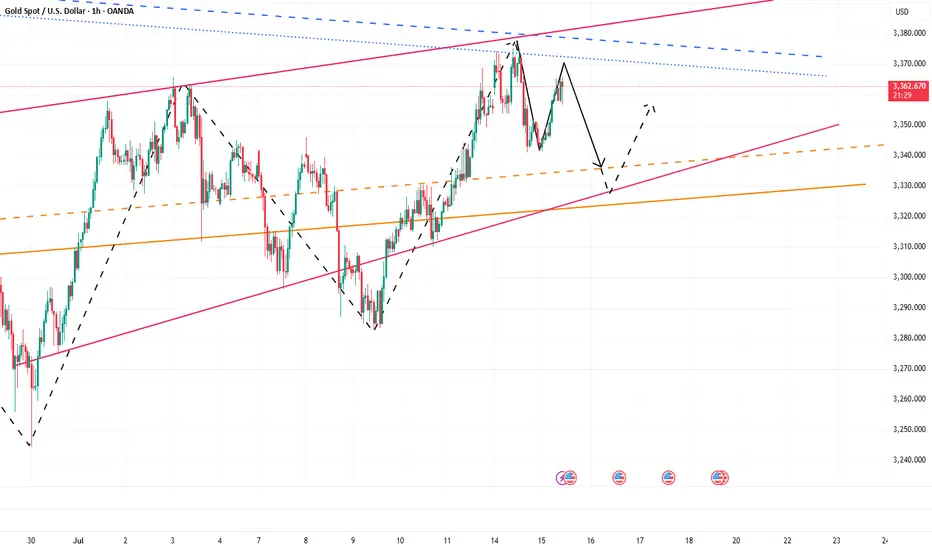
Warning Signs After Gold’s Sharp Rise — Is a Pullback Coming?Today, gold rebounded from around 3345, and has now rebounded to around 3389, which is only one step away from the 3400 mark. Gold has hardly retreated during the rise, and the rise is strong. However, we can see from the small-level candle chart that gold suddenly accelerated its rise after consolidating around 3365, and continued to around 3390, and is now oscillating near the recent high trend line.
After gold accelerated its rise and oscillated near the recent high trend line, this made me have to be more cautious, because we must be careful that the acceleration of gold's rise in the short term is a trap for buyers, so even if we are bullish on gold in the short term, we should not directly chase gold at a high level; according to the current structure of gold, I think it is necessary for gold to retest the 3370-3360 area support before continuing to rise and hitting 3400. Only after verifying that the support in this area is effective can it be conducive to a better rise in gold!
So for short-term trading, I think we can still try to short gold now, and then wait patiently for gold to retest the 3370-3360 area.
Is This the Start of a New Gold Bull Run?News that must be paid attention to:
1. The Middle East region is in constant conflict and the situation is unstable, which may re-stimulate the market's risk aversion sentiment;
2. Trump strongly called for a rate cut, and many Fed directors agreed to the rate cut. Under the situation of internal and external troubles, can Powell withstand the pressure of rate cuts? In addition, the tense relationship between Trump and Powell, as well as the development of Powell's dismissal storm, have increased the market's risk aversion demand and enhanced the market's bullish sentiment;
3. The uncertainty brought about by the tariff issue may disrupt the market.
Technical aspects:
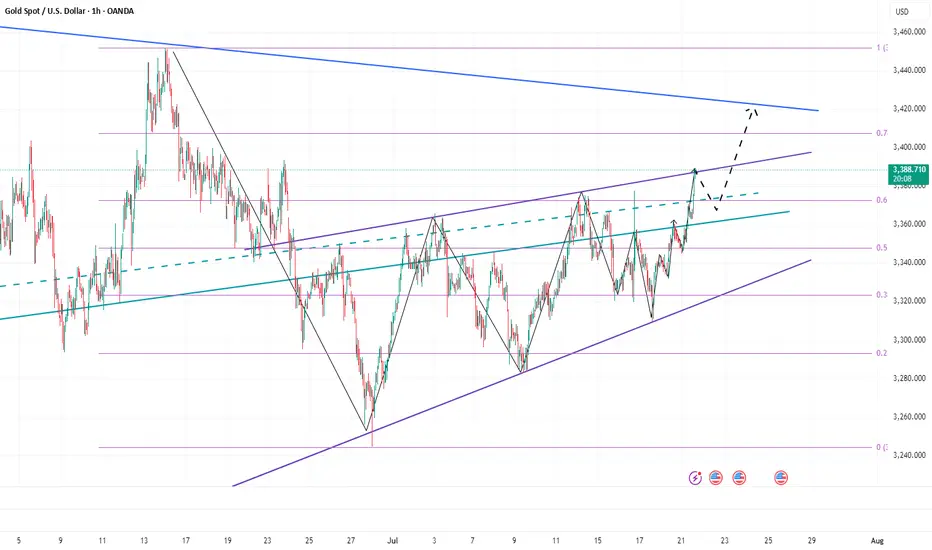
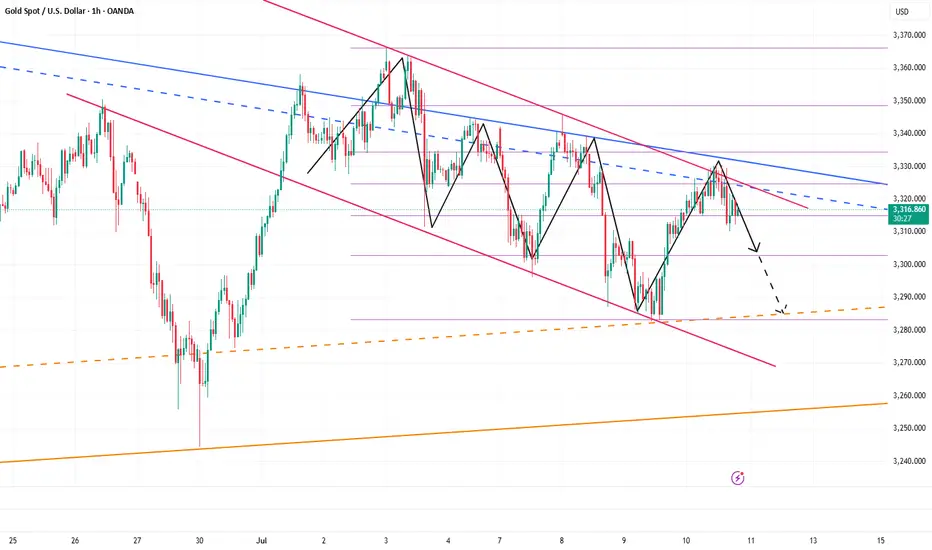
This week, the gold market is roughly a bottoming out and rebounding trend. We can clearly see from the recent candle chart that the recent trend line suppression is located near 3380, and this week gold has repeatedly encountered resistance and fallen in the 3375-3380 area, which has strengthened the suppression effect of resistance in this area to a certain extent; and gold has repeatedly tested the 3320-3310 area support during the retracement process. Gold has not fallen below the support of this area during multiple retracements, giving the market bulls great confidence.
On Friday, gold hit 3360 during the rebound and closed above 3350, which is strong in the short term. As gold continues to rebound, the current bull-bear dividing line is in the 3345-3335 area. If gold cannot even fall below the 3345-3335 area during the retracement next week, it will greatly boost buying power and is expected to hit the 3380 area again. Once gold breaks through the 3380 area during the rise, there will be a chance to further continue the rise and test 3400, or even the 3420 area.
Therefore, at the beginning of next week, if gold retreats to the 3345-3335 area for the first time, I think we must make an attempt to buy gold, first focusing on the target 3370-3380 area, and then bullish to the 3400-3420 area after a strong breakthrough.
Gold’s Last Stand? Major Retest at 3310–3300 Under the influence of negative news, gold today fell below the recent low of 3320 and continued to fall to around 3310. The current gold structure looks particularly obvious, the center of gravity of gold gradually moves downward, and the short trend is extremely obvious; however, as gold repeatedly probes the 3320-3310 area, we can clearly see the resistance of gold to falling, and multiple structural supports are concentrated in the 3320-3300 area. So as long as gold does not fall below this area, gold bulls still have the potential to rebound.
However, for now, after experiencing discontinuous sharp rises and falls, gold needs to undergo a short-term technical repair, so it may be difficult for a unilateral trend to appear in the short term. So I have reason to believe that gold will focus on rectification and repair next. The important resistance area we have to pay attention to above is in the 3340-3350 area; and the important support below is in the 3310-3300 area.
Currently, gold is fluctuating in a narrow range around 3340, and the short-term rebound momentum is sufficient, but I still believe that gold will fall back again and test the support of 3320-3300 area after consuming the bullish energy. So for short-term trading, first of all, I advocate shorting gold in the 3340-3350 area, and expect gold to retreat to the 3320-3300 area during the consolidation process.
Gold’s Uptrend Is a Mirage, Bears Are Lurking Beneath!Gold repeatedly touched around 3375 yesterday and then fell under pressure, proving that there is strong resistance above. Moreover, after gold retreated and touched around 3341 yesterday, it did not recover in time and stand above 3350. It was not until today that it rebounded and touched around 3365. The rebound cycle has been extended to the present, and the rebound strength is not very strong.
Since gold retreated, it has not been able to recover the lost ground in time. Gold is under pressure in the 3360-3370 area in the short term. If gold cannot successfully break through this resistance area during the day, then gold will retreat again, and will refresh the 3341 low again, and continue to the 3335-3325 area.
So for short-term trading, I think we can try to short gold in the 3360-3370 area appropriately, looking at the target area: 3350-3340
Continue to try to find the top of the band to short goldGold maintained a slow and volatile rise structure during the day. The highest has reached 3348, and it is only a step away from 3350. Will gold continue its upward momentum as usual?
In fact, it was beyond my expectation that gold could break through 3345 in the short term. According to my original expectation, the intraday high of gold was almost around 3345. Although the rebound of gold exceeded expectations, it is currently located near the resistance of 3348-3350, so I will definitely not give priority to chasing gold at high levels in short-term transactions.
Moreover, gold is currently in the resistance area of 3348-3350. The volatility of gold has converged, and the upward momentum has declined. As gold continues to rebound and faces the key resistance area again, the bulls are relatively more cautious. In this context, this resistance area may act as a catalyst, and the bears will react, leading the decline in gold. However, as gold rebounds and the support below gradually stabilizes, we can appropriately reduce the expectation of gold's decline and adjust the decline target to the 3330-3320 area.
So for short-term trading, I will still short gold based on the resistance area, trying to find a swing top in the 3340-3350 area, and look at the target area of 3330-3320.

Gold’s Uptrend Is a Mirage,Bears Are Lurking Beneath!Gold has rebounded to around 3336, and seems to have tried to stand above 3335, but it has not stood firm. Therefore, it cannot be considered that the bulls have an advantage just because gold has tried to break through 3335. Recently, I have been reminding everyone that before gold stands above 3335, the bears still have the spare power to dominate the market, so I fully believe that the gold bulls and bears will fight fiercely for control around 3335!
Why do I think it is difficult for gold bulls to have a good performance in the short term? Because since gold fell and touched 3285, it has fallen below many key supports. The market is short-selling. The previous support has become a key resistance under the effect of technical top and bottom conversion, and multiple resistances are concentrated in the 3335-3345-3355 area. Under the suppression of multiple resistances, it is difficult for gold bulls to make any progress in the short term.
So before the resistance is effectively broken, I think any rebound may be an opportunity to short gold, so I will try to find the band top and short gold based on the resistance area, and now I think it is still worth a try to short gold in the 3330-3340 area as originally planned! And look at the target area of 3320-3310
Golden Trap: Bulls Exhausted, Bears Ready to StrikeToday, the gold market is in a stalemate between long and short positions, with the market fluctuating sideways for a long time and maintaining an overall volatile trend. Although the rebound of gold has won a respite for the bulls, the rebound of gold during the day is not enough to completely reverse the decline. I think that before the 3325-3335 area is stabilized, the bears still have spare power to dominate the market!
According to the current structure, although gold rebounded again after touching 3310 during the retracement, it has retreated many times during the rebound. The candle chart is interspersed with obvious negative candle charts, indicating that the rebound strength is weak. In the short term, it is under pressure in the 3330-3340 area, and it is difficult to break through in a short time.
So I think the role of the gold rebound may be to trap more buyers, so we try not to chase gold after the rebound. The area near 3310 is not a key support in the short term. 3305-3300 is the current key support area. Once the bears regain control of the situation, gold may test the 3305-3300 area again. Once it falls below the reformed area, it may test 3280 again, or even refresh the recent low to around 3270.
So the downward potential of gold is not over yet. We can still look for opportunities to short gold in the 3325-3335 area and look at the target 3305-3295 area.
Short gold ,the downside potential is far from over.After we waited patiently for a long time, the gold bears finally showed signs of strength and began to fall as expected. Why do I insist on being optimistic about the gold retracement and wait patiently for it to retrace? !
In fact, it is very simple. Gold started to rebound from around 3283 and touched around 3330, which only recovered 50% of the decline. When facing the 50% retracement level, the bulls were unable to do so and could not stand above 3335, and could not even stabilize above 3330. The bulls' willingness was obviously insufficient. Then it can be determined that the gold rebound is only a technical repair of the sharp drop, and it cannot be completely regarded as a reversal of the trend. Then after a certain degree of repair, the gold bears will counterattack again.
Moreover, from the perspective of market psychology, the recent gold bull and bear markets have been discontinuous, and Trump often stirs up the gold market, making it difficult for the market to stand unilaterally on the bull side. Therefore, before gold stabilizes in the 3330-3340 area, there is limited room for rebound in the short term. Once gold falls below the 3310-3305 area again during the retracement, gold may test the area around 3280 again, or even around 3270.
So the above is why I insist on shorting gold, and I have shorted gold at 3320-3330 as planned, and patiently hold the position to see its performance in the 3310-3305 area, which is also the target area of our short-term short position.

I hold on to my short position and wait patiently.Currently, gold continues to rebound to around 3358, and there has been no decent retracement during the rebound, so during the trading period, apart from chasing the rise, there are almost no opportunities to go long on gold; so is the steady rise in gold during the day brewing a bigger rally?
I think there are three reasons for the continued rise of gold:
1. The continued weakness of the US dollar provides support for the strong rise of gold;
2. The trapped long chips have recently shown self-rescue behavior, and strong buying funds have driven gold up;
3. The market intends to eliminate and kill a large number of shorts in recent times;
Based on the above reasons, I think it is not a wise decision to chase gold at present; on the contrary, I still prefer to short gold in the short term, and I still hold a short position now; the following are the reasons to support my insistence on shorting gold:
1. The US dollar has a technical rebound demand after a sharp drop, which will limit the rebound space of gold and suppress gold;
2. After the recent trapped long chips successfully rescue themselves, they may cash out in large quantities, thereby stimulating gold to fall again;
3. While killing the shorts, the market has also lured a large number of long funds to a certain extent. Based on the above reasons, I currently still hold short positions near 3345 and 3355, and hope that gold can retreat to the 3335-3325 area.

Short gold, it may retreat again after reaching 3340-3350Although the rebound in gold has exceeded my expectations to a certain extent, it is obviously not a good time to chase the rise in gold. The gold rebound mainly benefits from Trump's repeated requests for the Federal Reserve to cut interest rates, which has led to the continued weakness of the US dollar. In fact, we can clearly see that the gold rebound is not supported by trading volume, and the rebound without volume may face the risk of collapse again at any time. So I don't advocate chasing long gold at present.
Currently, gold has rebounded to around 3339, almost recovering most of the losses in the previous downward wave (the starting point of the previous wave was 3350), but gold is still under pressure in the 3340-3350-3355 area. In the absence of volume support, gold may fall again after touching this resistance area.
Therefore, shorting gold is still the first choice for short-term trading at present; at least make sure not to chase high!
You can consider shorting gold with the 3340-3350-3355 area as resistance, and look at the target: 3320-3310-3300

Short gold, it will fall again when encountering resistanceIn the short term, gold retreated to around 3274 and then rebounded again, and it is only one step away from 3300. Will gold regain its bullish trend again?
I think it is difficult for gold to break through in the short term. Although gold retreated to around 3274 and successfully built a double bottom structure with the second low point and the low point of 3245, it only increased the rebound space; it is not enough for gold to regain its bullish trend. Since gold fell and broke through, the confidence of bulls has been hit hard. The previous support at the technical level has formed a strong resistance area after the top and bottom conversion, and to a certain extent helped the short force. In the short term, gold faces resistance in the 3310-3320 area. Before gold breaks through this area, the short energy still has the upper hand.
Therefore, shorting gold is still the first choice for short-term trading.
It is appropriate to consider shorting gold in batches in the 3300-3320 area, and look at the target: 3385-3375-3365

Buy gold, there may be a rebound in the short termAt present, gold has touched the area of 3325-3315 mentioned in my previous article, and the lowest price is around 3316. At present, due to the current important support area of 3310-3300 below, gold still has a rebound demand in the short term; although gold has not rebounded sharply at present, the downward momentum has indeed slowed down, and gold may rebound after the short force is consumed. Moreover, the ceasefire between Iran and Israel has not yet been settled. Moreover, the ceasefire between Iran and Israel has not yet been settled. With the fluctuating situation in the Middle East, bulls may have opportunities to counterattack.
However, the current performance of gold is indeed relatively weak, so there is no need to expect gold to rebound and fill the upper gap area of 3360-3370 in the short term; in trading, the rebound expectation can be appropriately lowered, and long positions can continue to be held and look up to the 3340-3350 area.

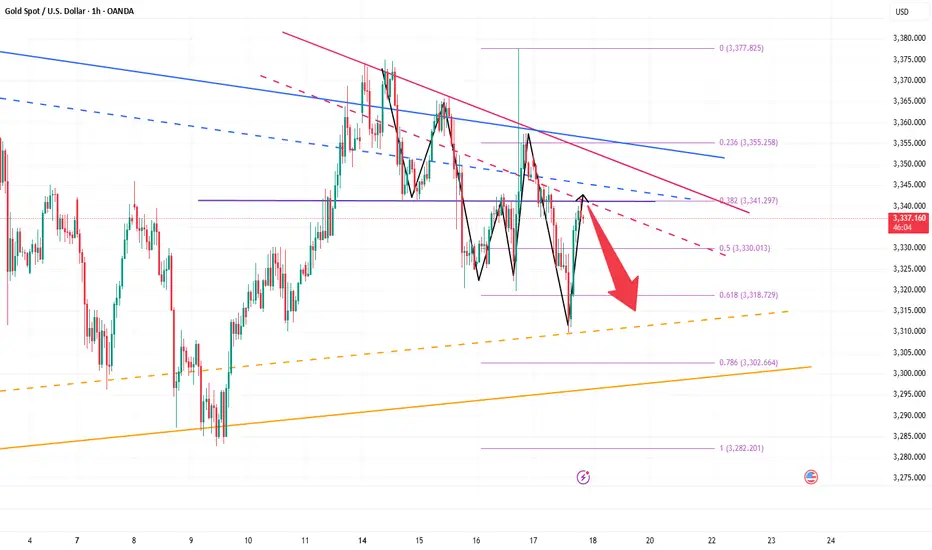
There are still profit opportunities in short selling!As gold continues to rebound, bulls are reversing their decline. After gold broke through the 3370-3380 area, the current market consensus on 3350-3340 as the bottom area was strengthened. However, as gold fell back under pressure several times after the rebound, it proved that there was still a certain amount of selling pressure above, and it was obvious that the resistance was in the 3395-3405 area; once gold broke through this resistance area, gold bulls would regain the upper hand and are expected to continue to probe the 3320-3330 area. However, before gold effectively broke through the 3395-3405 area, bulls and bears would still fiercely compete for control, so it is still in a wide range of fluctuations.
Therefore, before gold broke through the 3395-3405 area, we can still appropriately short gold in the 3385-3395 area, and expect gold to retreat to the 3375-3365 area in the short term. In trading, we must pay attention to the changes in the rhythm of gold. Once gold chooses a direction and makes a breakthrough, we need to change our trading strategy!

Stick to shorting gold and holding itAlthough gold has risen sharply to around 3375 in the short term due to the dovish remarks of Fed officials, it has not made an effective breakthrough. Therefore, gold has not reversed its trend due to the short-term rebound. Gold is still in an obvious short trend. In the short term, gold is obviously under pressure in the 3365-3375 area. If gold fails to break through this resistance area, then after gold consumes a certain amount of long energy, gold shorts will counterattack again and are expected to retreat to the 3350-3340 area again.
In the case that good news cannot support the continued rebound of gold, the market's bullish confidence will be hit again, and the short confidence will be further strengthened, stimulating gold to accelerate its decline, and it is even expected to fall below the 3350-3340 area. Therefore, in short-term trading, I still advocate shorting gold, and I am currently holding a short position in gold, and I look forward to the accelerated decline of gold as expected!

A glimmer of hope for bullish lovers!Gold is currently dominated by bears, but thanks to the support of risk aversion caused by geopolitical conflicts, gold has shown a certain degree of resistance to decline while falling. Therefore, the current market direction is very clear, with weak and volatile downward movement. But under this market situation, we cannot short gold excessively. We can only wait for it to rebound to the pressure level and then short gold, or try to go long on gold with strong support.
At present, gold has touched the 3350 area again, which has a certain support effect. If gold cannot effectively fall below 3350, then gold may still rebound to the 3370-3380 area again; but once gold effectively breaks the support near 3350, gold is expected to continue to fall to the 3340-3330 area.
In terms of short-term trading, I think it is possible to consider starting to try to go long on gold in batches in the 3350-3330 area, TP: 3365-3375

Stick to shorting goldGold is currently fluctuating in a narrow range of 3380-3385, and the trend is relatively slow. We also need more patience. In comparison, I think the current short-selling force has a slight upper hand, because gold has shown signs of accelerating decline after a difficult rebound many times, and has fallen below 3380 many times. According to the current gold structure, gold does not have sufficient room for decline, and it is still possible to continue to fall to the 3365-3355 area.
It is expected that gold will not fluctuate too much before the Fed's interest rate decision and Powell's monetary policy press conference. For this interest rate decision, I think the possibility of a rate cut is not great, and the current interest rate may still remain unchanged. The reduction in the expectation of a rate cut may stimulate a wave of gold declines in the short term. So in the short term, I still prefer a short trade in gold. Obviously, gold is currently under pressure in the 3395-3405 area, so we can still try to short gold in this area.

Gold is weak, and there may be a low point yet to come!According to the current structure, gold is obviously in a weak position. Gold has failed to break through the high point of the previous wave after multiple rebounds during the day. 3400 has become a new round of pressure area; and gold has just accelerated its decline and fell below 3370. For the current trend, falling below 3370 will weaken the bullish sentiment to a certain extent and indicate that there is further room for decline, so I think gold should have a low point, and the low point we should first pay attention to is in the range of 3365-3355.
So in terms of short-term trading,
First, we can try to short gold with the short-term resistance area of 3395-3405;
But if gold first retreats to the support area of 3365-3355, we can first choose to go long on gold.

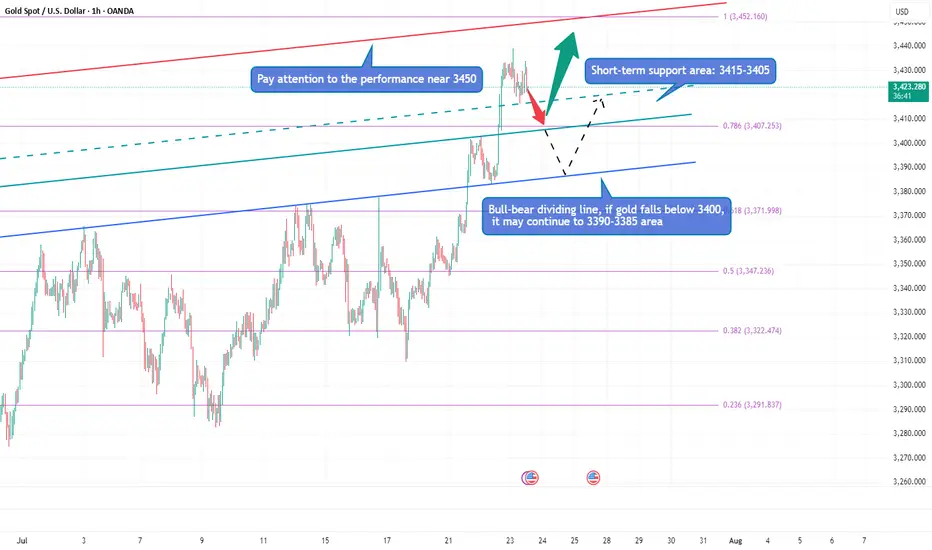
Gold bulls may restart at any time, buy gold!Although compared with the performance of gold during the day, gold only touched 3452 and then began to retreat, and even failed to approach the previous high of 3500, gold is not strong; but based on the current fundamentals and technical structure, gold is currently in a very strong bullish structure; so I think the gold retracement is not a sign of gold weakness, but to increase liquidity, so that gold can rise better and prepare in advance for breaking through 3500! Gold bulls are ready to restart at any time after the retracement!
So for short-term trading, I don’t think the gold retracement is a reason for weakness, nor is it a certificate for chasing short gold; on the contrary, I think the gold retracement is a good time to buy on dips; first of all, the support area we have to pay attention to is the 3410-3400 area, and the second must pay attention to the 3390-3380 area support.
So in the next transaction, we might as well use these two support areas as defense and start to go long on gold in batches!

Gold will inevitably fall after risingGold has risen sharply due to the violent geopolitical conflicts and the surge in risk aversion. It once reached around 3445, but in the process of falling back, it only touched 3408 and rebounded again, stabilizing above 3400. It is obvious that due to the changes in fundamentals, the sentiment of gold bulls is high; although the upward momentum of gold near 3440 has weakened, there is no clear signal of peaking yet!
For short-term trading, it is relatively difficult to participate at present. To be honest, I naturally don’t want to chase gold at a high level; but there are no more signals to support me to short gold for the time being. However, with the rebound of gold, the current short-term support below is in the 3425-3415 area, followed by the psychological support of the 3400 integer mark; and the short-term resistance above is in the 3455-3465 area, followed by the area near 3480.
Compared with the profit and loss ratio, I prefer shorting gold for short-term trading, because gold has performed relatively strongly in the London market. Logically, gold will have the inertia to rise in the New York market, so I think gold may rise and then fall in the New York market, so my current plan is to try shorting gold starting in the 3455-3465 area.
Because the changes in gold's fundamentals are more extreme and complex, you must set up SL when participating in transactions.

Stick to shorting gold and aim for the target area.Gold has not broken through 3400 after accelerating its rise, and the upper suppression effect still exists; currently gold is fluctuating in a narrow range below 3390, showing signs of stagflation to a certain extent. Therefore, the accelerated rise of gold is not for the short-term impact of 3400, but for a deep retracement, eliminating more scattered funds in the market by sweeping up and down.
So in the short term, I think it is difficult for gold to continue to break upward under the suppression of the resistance area near the short-term high of 3402, but to test the lower support area of 3375-3365 before breaking upward. So I have shorted gold as scheduled according to the short trading plan mentioned above, and aimed at the lower target area of 3375-3365.
At present, our short position has made a certain profit, but I still look forward to profiting from gold hitting TP! Let us look forward to gold falling back to the target area as expected!
Continue to short gold Gold rebounded from around 3315 and has now reached above 3340. According to the current structure, gold tends to rebound upward. But the characteristics of the recent market trends are also very obvious. Gold has risen with difficulty, but has retreated very quickly! Overall, there was no continuation in the process of long and short games, which was disorderly fluctuation.
According to the current structure, as long as gold cannot break through the 3350-3355 area and the bulls have not completely gained the upper hand, gold still has the potential to go down and test the 3320-3310 area again. Therefore, for short-term trading, we should not chase gold too much, and we can still try to short gold with the 3345-3355 area as resistance.