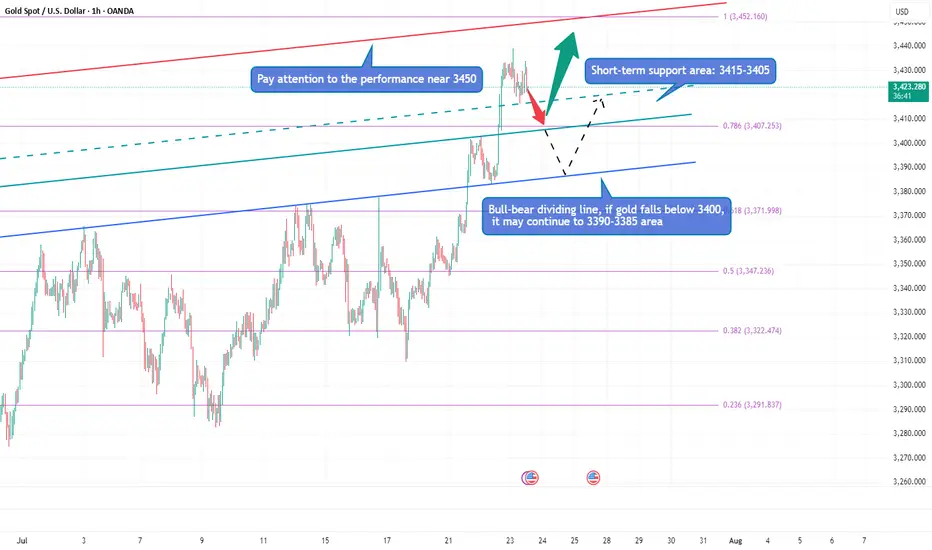
Gold is surging, can it hit 3500?Due to the trade tensions caused by tariffs and the continued conflict between the White House and the Federal Reserve, gold continued to rise, and the current highest has reached around 3438. Obviously, after gold rose strongly and broke through the 3400 and 3420 areas, the bullish sentiment of gold has been ignited. Next, we need to pay attention to whether gold can test and stand firm at 3450.
Gold is currently extremely strong, and there is basically no room for retracement during the rise. As gold rises, the short-term support below has also moved up to the 3415-3405 area; and the upper side needs to pay attention to the breakthrough of the 3450 mark. If gold continues to break through 3450, then gold has the potential to challenge 3500 again; however, if gold still cannot effectively break through when it touches the area near 3500 again, the sentiment of gold cashing out and leaving the market may be stimulated, resulting in gold There may be room for retracement in the short term. If gold falls below 3400 during the retracement, the decline may continue to the 3395-3385 area.
Therefore, for the next short-term trading, we can first wait for the opportunity for gold to pull back, and then consider going long on gold with the 3415-3405 area as support; if gold does not give a chance to pull back, then when gold first touches the area around 3440-3450, we can consider starting to short gold.
Xauusdtrend
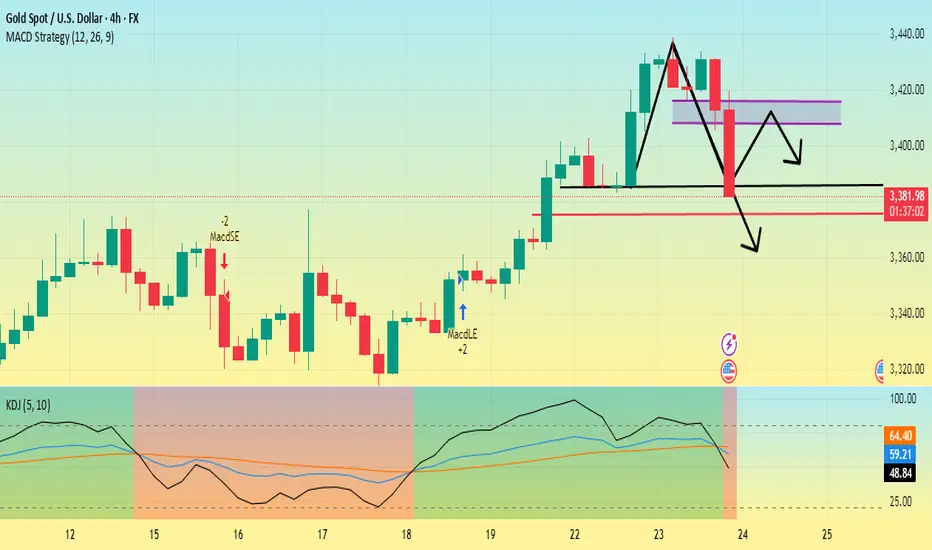
Gold is going down. Can it break through?First, we can look at the daily chart,Currently, the support below the gold daily chart is around 3385, which is also the low point on Tuesday. The current price drop has already touched the support near 3385.
Secondly, from the 4-hour chart, the low point of yesterday's US market retracement was around 3405, and the high point on Monday was 3400. So the first pressure point of this price correction is 3400-3410, followed by the suppression position near 3420.
The 4-hour chart shows that the gold price fluctuated in the 3410-3440 range in the early stage, the MACD red column shortened, and the KDJ dead cross began to appear, facing the pressure of correction in the short term.
At present, the main focus is on whether the 3385 support line can be broken. If it falls below this support level, it will most likely touch around 3375. Then gold will most likely start a downward trend and the rebound will be weak.
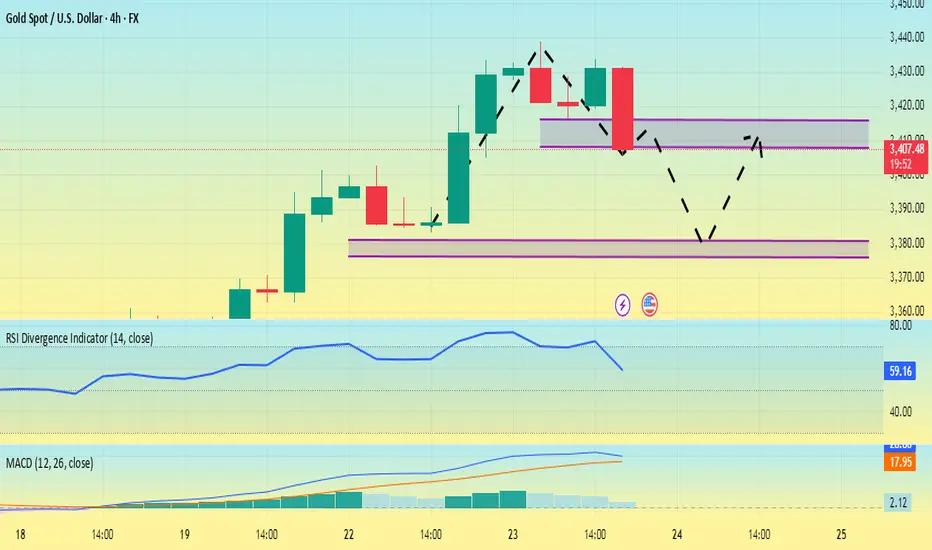
Gold is bullish and bearish. Will it continue?From the daily chart:
The moving average is bullish, and the MA5-day, 10-day, and 30-day moving average supports move up. The 3380 dollar has turned from resistance to strong support. If this position is maintained, the upward channel will continue. The support position is 3380-3375, which is the top and bottom conversion position, and is also near the middle track of the Bollinger Band.
From the four-hour chart, the MACD red column shrinks and the RSI is near 60, and the bulls are still dominant. If the price falls back to the 3375-3380 area and stabilizes, it is expected to attack the 3400 mark again.
Operation strategy:
Long operation:
Steady type: When the gold price falls back to the 3375-3380 area, long orders are arranged in batches, with a stop loss of 3365 and a profit range of 3400-3410.
Aggressive: If the price breaks through 3400 quickly and falls back to around 3395, you can chase long with a light position, stop loss at 3388, and the profit range is 3420 strong resistance area.
Short operation:
Resistance area test short: 3408-3415 area, light position short order, stop loss at 3422, profit range 3390-3380.
Break short: If it falls below the 3375 support and the rebound is weak, follow up with short short, profit range 3360, stop loss 3385.
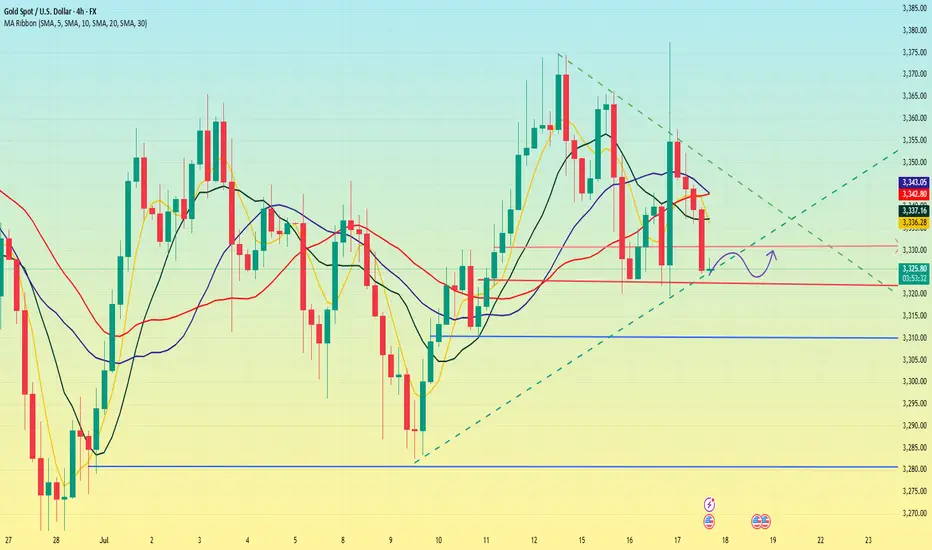
XAU/USD Chart Analysis: Bulls Break Important ResistanceXAU/USD Chart Analysis: Bulls Break Important Resistance
When analysing the XAU/USD chart last week, we:
→ noted that the ADX indicator had reached its lowest level since the beginning of 2025 – a clear sign of declining gold price volatility;
→ highlighted the formation of a large-scale triangle with its axis around the $3,333 level, bounded by a resistance line (marked in red) and the lower boundary of the ascending channel.
Since then, the price has climbed above $3,400 – reaching its highest level since mid-June. According to media reports, the uptick in demand may be driven by escalating geopolitical risks, renewed optimism regarding potential monetary policy easing in the US, and consistent gold buying from central banks.
This suggests that the balance has shifted in favour of the bulls, who have made an attempt to break through the resistance line – an attempt that, so far, appears promising and points towards a potential resumption of the upward trend.
However, today's XAU/USD chart shows that the bulls are now facing a key resistance level at $3,440 – a level that has reversed gold prices downward both in May and June. What will happen in July?
It is possible that, following a prolonged consolidation near the lower boundary of the channel, the bulls have built up sufficient momentum to finally break through this critical level and push gold prices towards line Q, which divides the lower half of the long-term channel into two quarters.
This article represents the opinion of the Companies operating under the FXOpen brand only. It is not to be construed as an offer, solicitation, or recommendation with respect to products and services provided by the Companies operating under the FXOpen brand, nor is it to be considered financial advice.

Gold bulls are on the offensive. Can they continue to chase?On Tuesday, as trade tensions and the conflict between the White House and the Federal Reserve continued, the US dollar index continued to fall, and continued to fall in the early US trading, once hitting a low of 97.28. Gold also continued to rise, once standing above the $3,430 mark, setting a new high in more than a month. From the current point of view of gold, this week has stood firm at two levels, 3,350 and 3,400. Next, it depends on whether it can continue to stand firm at the 3,450 level.
From the current hourly chart, Monday's high is around 3,400, and yesterday's low of the US market retracement on Tuesday was around 3,405. So theoretically, 3,400-3,405 has become a support position. And from the hourly chart range, the bottom trend line support is also about 3,400-3,405. Therefore, it is not ruled out that it will oscillate and retrace like yesterday, and then rise and stretch again.
Secondly, from the daily chart:
After gold stabilized at 3400, the current daily range has become 3400-3450. As we can see above, there have been three times of falling back after touching 3450. If it breaks and stabilizes above 3450 this time, the historical high of 3500 will most likely be refreshed. On the contrary, if it still cannot break through 3500 this time, the possibility of further pullback cannot be ruled out. For the next operation, I suggest paying attention to 3400-3405.
If it can retreat and stabilize at 3400-3405 during the European session, you can continue to enter the market and go long to around 3450. On the contrary, if it falls below 3400 today, then don't go long, as there may be a possibility of further retreat in the future.

Gold is strong. Can it continue?On Tuesday, the overall gold price showed an upward trend. The highest price rose to 3433.32 on the day, and the lowest price fell to 3383.21, closing at 3431.46. On Tuesday, gold prices fluctuated during the early trading session and then corrected downward. During the European session, the price fluctuated mainly and fell weakly. It rose before the US session and hit the high point of the week again in the US session, and finally ended with a big positive line.
From the four-hour level, the technical adjustment needs, but the speculation of risk aversion suppressed this demand. There is a contradiction between the fundamentals and the technical aspects, and it is necessary to wait for the market sentiment to stabilize before clarifying the direction.
In the early Asian session, it hit a high of 3438 and then fell back. It is necessary to pay attention to the possibility of reaching the top. The support position is 3400-3405. If it falls to 3400, it may continue to adjust to around 3385. The probability of closing the negative line today is relatively high. If the price stabilizes above 3400, it is likely to maintain high fluctuations.
Today's market is complicated. Although the bullish trend has not changed, it is not advisable to be overly bullish. The operation is mainly shorting on rebounds, supplemented by long positions on pullbacks. The upper pressure position focuses on 3440-3450.
Operation strategy:
Short near 3440-3450, stop loss 3460, profit range 3420-3410.
Long near 3390, stop loss 3380, profit range 3420-3430.

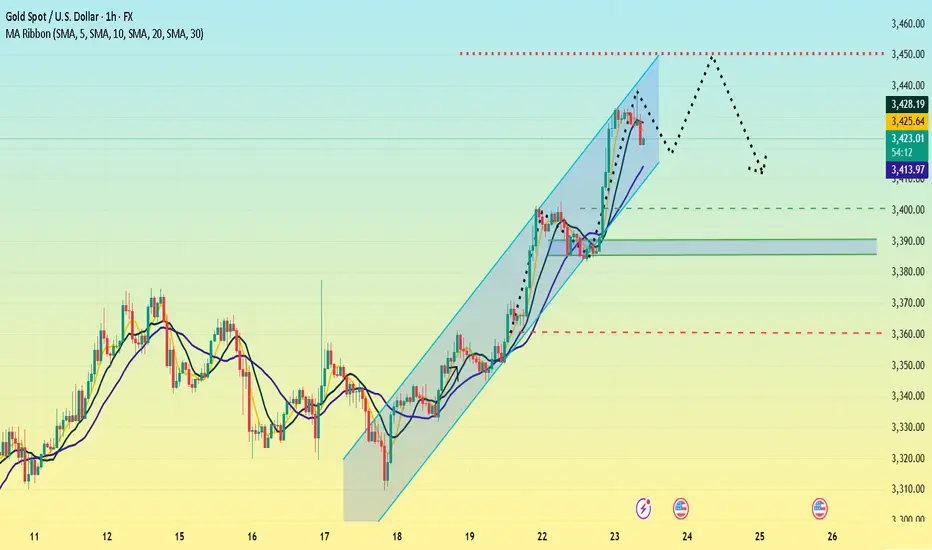
Gold stabilizes. Sets a new high?Gold continues to rise, with uncertainty in trade negotiations and the outcome of the Federal Reserve meeting being key variables. If no agreement is reached before August 1, the high tariffs imposed by the United States on major trading partners may trigger greater risk aversion demand, pushing gold prices further up; if the negotiations make a breakthrough, the market risk appetite will rebound, and gold prices may face correction pressure.
Gold has shown a strong upward trend recently. It closed with a small positive on Friday last week and closed with positive for two consecutive trading days this week, forming a three-day positive trend, with strong short-term momentum. In terms of indicators, the moving average diverges upward, with obvious bullish trend characteristics, and the support below needs to focus on the moving average performance. At present, the gold price has broken through the trend line formed by connecting the previous high points. The primary focus on the upside is near the previous high of 3452, which is an important short-term resistance level. The upper focus is on the previous high of 3452, which is an important short-term resistance level.
The first support below is the 3390-3385 area, which is close to yesterday's low and is also an early trading intensive area. The second support focuses on the vicinity of 3360.
In terms of operation, it is still mainly low-long, and short selling is not considered before the upward trend reaches 3450.
Operation strategy:
Short around 3450, stop loss 3460, profit range 3430-3310
Long around 3400, stop loss 3390, profit range 3420-3430
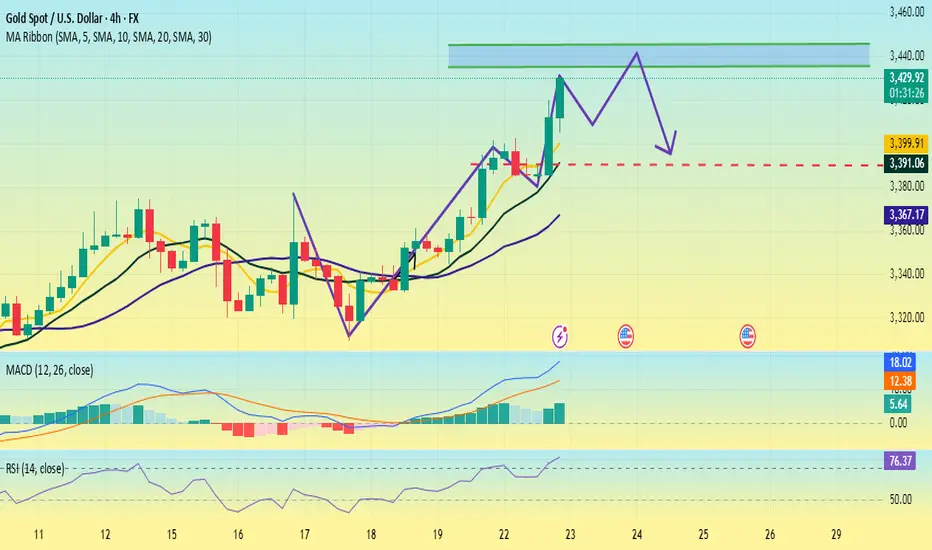
Gold is under pressure. Can it break through?Since the "W bottom" pattern was formed at the low of 3344 US dollars, the gold price broke through the neckline of 3380 and further stabilized at 3400 today, confirming the continuation of the medium-term upward trend. The moving average system is arranged in a bullish pattern, with the 5-day, 10-day and 20-day moving averages diverging upward in turn, and the support strength is stable.
The MACD indicator golden cross continues to expand, the upward momentum is enhanced, and no divergence occurs; the RSI indicator rises to around 76. Although it enters the overbought range, there is no obvious turn, indicating that the bullish momentum is still being released.
The current support level has risen to around 3390, and the support level has risen sharply. The resistance position needs to pay attention to 3430-3440. At present, several times have tested above 3430, but they have not stabilized above this position.
Operation suggestions:
3390-3400 light position to try more, stop loss 3360, profit range 3435-3445.
If it encounters resistance and falls back near 3435, you can consider short-term short orders with stop loss at 3445 and profit range at 3400-3380.
Although the upward momentum continues, some risk information still needs to be paid attention to; this week, we need to pay attention to the US June existing home sales data (July 23), the preliminary value of the second quarter GDP (July 25) and the core PCE price index (July 26). If the data is stronger than expected, it may trigger expectations of interest rate cuts.
Gold is under pressure. There is hope for another rise.Today's important news:
At 8:30, Fed Chairman Powell delivered a welcome speech at a regulatory meeting; at 13:00, Fed Governor Bowman hosted a fireside chat session at the large bank capital framework meeting hosted by the Fed.
Market conditions:
The current daily trend is mainly "strong rise" (Monday closed positive and broke through the shock, and the moving average turned upward). The core logic is that short-term bullish momentum is dominant, and it is necessary to focus on the effectiveness of support and the rhythm of breaking through resistance.
Today, we need to focus on the support belt 3365-3360 area (this position is the 5-day moving average position and the low point of yesterday's European session). As a short-term moving average support, this area is the first line of defense for bulls today. If it can stabilize here, it can be regarded as a signal of short-term strong continuation.
The key pressure level is still around 3420. As a trend line resistance that has been under pressure many times in the early stage, if it can break through, it means that the bulls will break the shock suppression and open up more room for growth.
In terms of operation, it is still mainly low-long. The current gold is still strong. Operation strategy:
Short around 3420, stop loss 3430, profit range 3400-3380
Long around 3360, stop loss 3350, profit range 3380-3400

XAUUSD 2H | Smart Money Buy from Strong DemandXAUUSD 2H | Support Rejection with Upside Targets 🎯
Price respected the key support zone and is now showing bullish momentum. Two clear target levels are marked above. Ideal buy opportunity after rejection confirmation from demand zone. Watch for clean continuation toward 3370 and 3390.
#XAUUSD #GoldAnalysis #SmartMoneyConcepts #SMC #Forex #PriceAction #BuySetup

Gold fluctuated downward. Stuck in a stalemate.Information summary:
Global investors have experienced the longest night this year. There are reports that Trump has drafted a letter to fire Federal Reserve Chairman Powell. The incident triggered a strong reaction in the financial market. An hour later, Trump came out to clarify that "there is no plan to take any action" and denied drafting a letter to fire Powell.
Due to the impact of the incident, gold experienced a roller coaster market, soaring more than $50 at one time, hitting a three-week high of $3,377.17, and then narrowed its gains to 0.68%, and finally closed at $3,347.38. In today's Asian market, gold fell slightly and is currently hovering around $3,325.
Market analysis:
The current volatility pattern has not changed. In the short term, the market shows signs of weakness, which is also affected by CPI data, and expectations for interest rate cuts have weakened. In the current state where there is no break in the pattern, waiting and watching is still the best strategy.
The first support level is around 3,310, which is the starting point of last week's high. The second is around 3280, which is the historical low since July and also the starting point of the rise in the first week of July.
XAU/USD Chart Analysis: Volatility at a Yearly LowXAU/USD Chart Analysis: Volatility at a Yearly Low
The daily chart of XAU/USD shows that the Average Directional Index (ADX) has reached its lowest level since the beginning of 2025, indicating a significant decline in gold price volatility.
Yesterday’s release of the US Producer Price Index (PPI) initially triggered a sharp spike in gold prices, but the gains were short-lived, with the price quickly reverting to previous levels. This price action aligns with a broader market narrative of equilibrium—where supply and demand are in relative balance, and the market appears to be efficiently pricing in key influencing factors, including geopolitical tensions and tariff-related developments.
However, this fragile balance may soon be disrupted.
Technical Analysis of XAU/USD
From a broader technical perspective, gold remains within a long-term ascending channel (highlighted in blue) in 2025. Key observations include:
→ Attempts to rebound from the lower boundary of the channel (marked with arrows) lack conviction. Bulls are not capitalising on these opportunities to reignite the uptrend, suggesting a potential exhaustion of buying interest.
→ A trendline drawn across the major highs of 2025 has proven to be a strong resistance level. All recent breakout attempts have failed at this barrier.
As a result, the XAU/USD chart is showing signs of forming a large-scale triangle pattern, with its axis centred around the $3,333 level. If bulls continue to falter in extending the multi-month rally, it could encourage bears to challenge the lower boundary of the ascending channel, increasing the risk of a downside breakout.
This article represents the opinion of the Companies operating under the FXOpen brand only. It is not to be construed as an offer, solicitation, or recommendation with respect to products and services provided by the Companies operating under the FXOpen brand, nor is it to be considered financial advice.
Gold fluctuates downward. Can it break through?The CPI data released is in line with expectations, the tariff storm is still continuing, inflation rebounds and the Fed's expectations of interest rate cuts have cooled. Gold rebounded to 3366 and then fell, and is currently fluctuating around 3330.
From the current trend, gold fell strongly and broke through the Bollinger middle rail and the moving average support. The daily line focuses on the Bollinger middle rail under pressure near 3340, and the short-term support is at 3310. At present, a staged top pattern has been formed and the K-line double top is around 3366. The Bollinger moves downward and the price is in a downward channel.
For short-term operations, Quaid believes that the strategy of rebound shorting can still be followed.
Short near 3345, stop loss 3355, profit range 3330-3310
Long near 3310, stop loss 3300, profit range 3330-3345
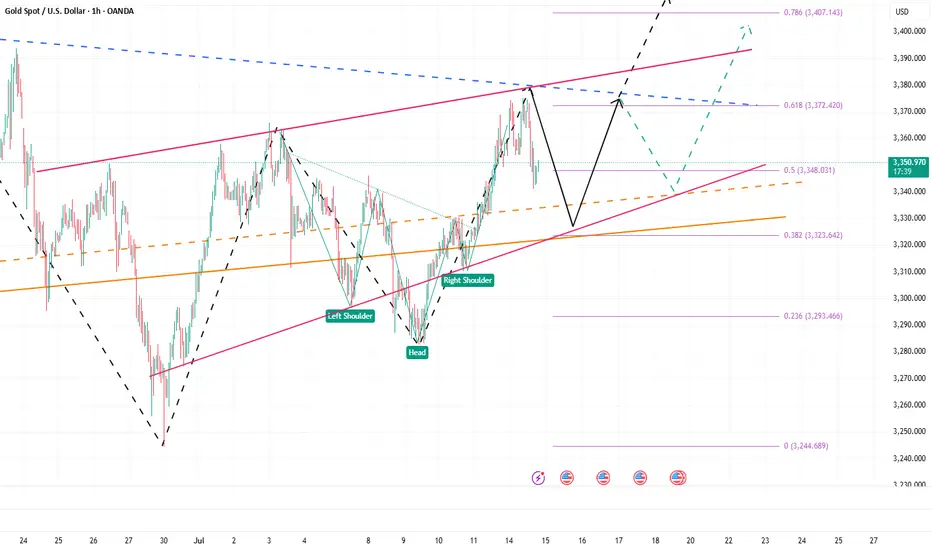
Eyes on 3335–3325: Next Bullish Launchpad!!!Today, gold hit 3375 several times and then fell back after encountering resistance. The lowest has reached 3341. Although the rising structure has not been completely destroyed, and the technical double bottom structure and the inverted head and shoulder structure support resonance effect still exist below, since gold fell below 3350, it has not even been able to stand above 3350 in the current rebound. The gold bull pattern has been weakened to a certain extent, and the market has begun to diverge in the long and short consciousness.
Gold encountered resistance and fell back near 3375 three times, proving that the upper resistance is relatively strong. Gold must increase liquidity by retracement to store more energy for breakthrough, so the short-term correction of gold is actually within my expectations, which is why I advocate brave shorting of gold today! However, according to the current retracement range and the fact that gold has been unable to stabilize above 3350, I believe that gold has not fallen to the right level and there is still room for retracement below. So I think gold will continue to pull back to test the 3335-3325 area. If gold retests this area and does not fall below, we can boldly go long on gold in this area.
Once gold rebounds after testing the 3335-3325 area, as liquidity increases, the market may form a strong bullish force to support gold to continue its rebound and continue to the 3380-3390 area, or even the 3400-3410 area.
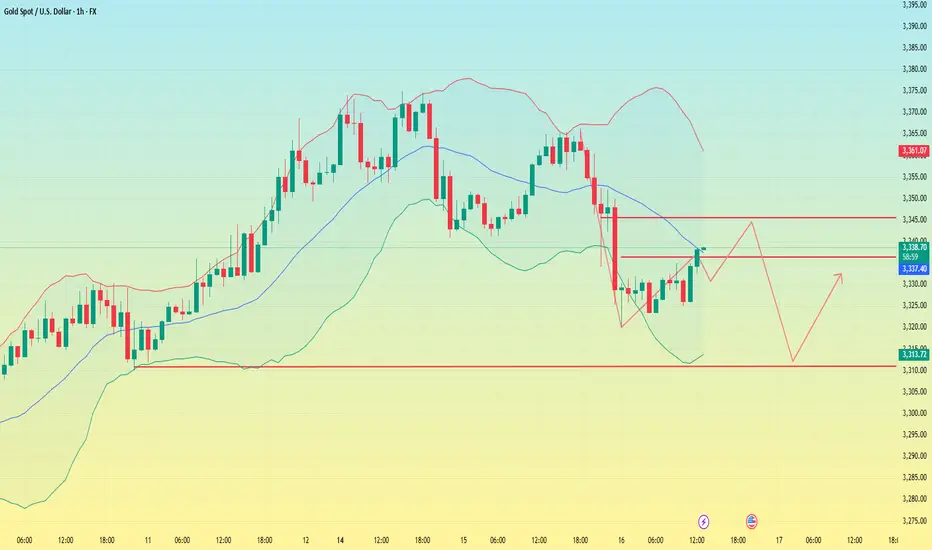
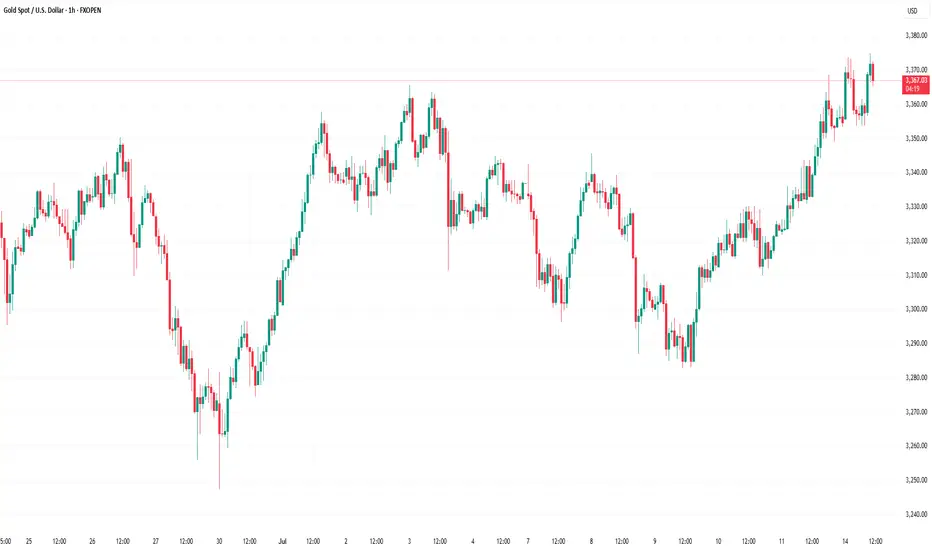
Market Analysis: Gold Climbs Higher Amid Market OptimismMarket Analysis: Gold Climbs Higher Amid Market Optimism
Gold price started a fresh increase above the $3,350 resistance level.
Important Takeaways for Gold Price Analysis Today
- The gold price started a fresh surge and traded above $3,330.
- A key bullish trend line is forming with support at $3,350 on the hourly chart of gold at FXOpen.
Gold Price Technical Analysis
On the hourly chart of Gold at FXOpen, the price formed a base near the $3,280 zone. The price started a steady increase above the $3,330 and $3,350 resistance levels.
There was a decent move above the 50-hour simple moving average and $3,360. The bulls pushed the price above the $3,365 resistance zone. A high was formed near $3,373 and the price is now consolidating.
On the downside, immediate support is near the $3,350 level and the 23.6% Fib retracement level of the upward move from the $3,282 swing low to the $3,373 high.
Besides, there is a key bullish trend line forming with support at $3,350. The next major support sits at $3,330 and the 50% Fib retracement level.
A downside break below the $3,330 support might send the price toward $3,300. Any more losses might send the price toward the $3,280 support zone.
Immediate resistance is near the $3,370 level. The next major resistance is near $3,380. An upside break above $3,380 could send Gold price toward $3,400. Any more gains may perhaps set the pace for an increase toward the $3,420 level.
This article represents the opinion of the Companies operating under the FXOpen brand only. It is not to be construed as an offer, solicitation, or recommendation with respect to products and services provided by the Companies operating under the FXOpen brand, nor is it to be considered financial advice.
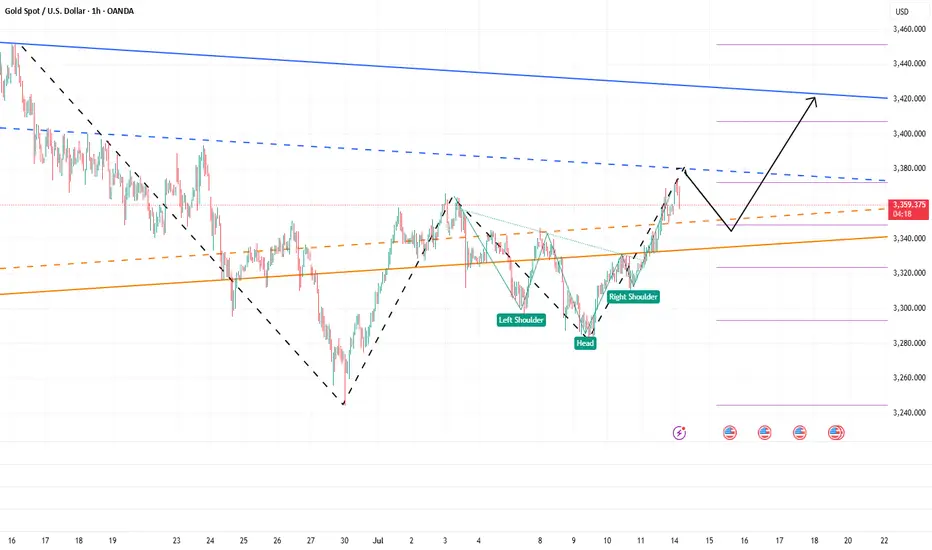
The bulls have started, aiming at 3400!Gold rose as soon as the market opened, and the highest has now reached above 3374. The upward momentum of gold is strong. It can be seen that after breaking through the recent high of 3365, its morphological structure has obviously tended to a bullish structure, and the technical form shows a "W" double bottom structure and an inverted head and shoulder resonance. The resonance of this technical structure will continue to support the continued rise of gold.
At present, gold is under pressure near the 3380 area in the short term, followed by the area near 3405. At present, gold has a technical retracement near 3380, but it is difficult to destroy the already formed rising structure based on the current retracement strength. Once gold rises again, 3380 will definitely be conquered! It will even continue to the 3400-3410 area; and the area with obvious short-term support is concentrated in the 3350-3340-3330 area, so gold may still rebound again with the support of this area after the decline, and continue to rise.
So for short-term trading, I would consider buying gold in batches based on the support of the 3350-3330 area, with the first target looking at 3380, followed by the 3400-3410 area.
XAUUSD 1H | Bullish BOS & OB Retest | Targeting 3390+🚀 Gold (XAUUSD) 1H Timeframe is showing a clean Bullish Market Structure with multiple Breaks of Structure (BOS ↑) confirming upside momentum.
🔹 Price retraced back into a strong Demand Zone (OB) and has started pushing upward again, indicating strong buyer interest.
🔹 Clear Order Block Retest after BOS confirms Smart Money Entry.
🔹 Target is marked around 3390+, based on previous liquidity and imbalance zones.
📈 Expecting continuation of bullish trend until the marked Target Point is reached.
💡 This setup follows pure SMC principles: BOS → OB Retest → Expansion.
🟢 Buy Bias Active | 📊 High Probability Trade Setup
#XAUUSD #Gold #SMC #BreakOfStructure #OrderBlock #LiquidityGrab #TrustTechnicallyAnalysis

Affected by tariffs, gold rose again.On Saturday, Trump announced that he would impose a 30% tariff on goods imported from the European Union and Mexico from August 1. This news triggered a rise in risk aversion in the market. As a traditional safe-haven asset, gold was once again sought after. The price continued the rise on Friday and continued to open high in the early Asian session. As of now, the highest price reached around 3373.
From the current market point of view, after breaking through the triangle pattern last Friday, there was a sharp rise. The price successfully stood on the short-term moving average, showing an overall bullish trend. However, it should be noted that the short-term moving average has not yet formed an upward cross, which means that there is a high possibility of a confirmation process in the future. Looking back at the trend in the past two months, gold rarely opens high and then continues to rise. Most of them open high and go low. Therefore, under the current situation, although it is bullish overall, it is not advisable to blindly chase more. It is more suitable to wait for a decline before arranging more orders. The key lies in grasping the decline position.
From the perspective of pressure level, 3380-3385 is the first pressure level, and the second pressure level is 3395-3400. The support level below is around 3345, which is also the pressure level that has been emphasized in the early stage, and the top and bottom conversion position. For today's operation, Quaid recommends low-to-long.
Operation strategy:
Short near 3380, stop loss 3390, profit range 3360-3345
Long near 3345, stop loss 3335, profit range 3360-3380
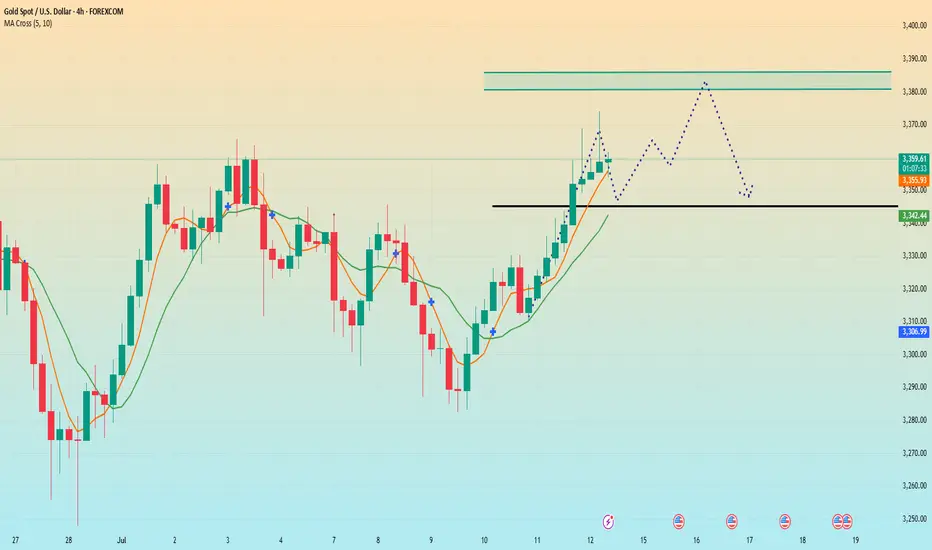
Gold breaks through. Will it continue?After breaking through the position predicted by Quaid on Friday, gold rose strongly and finally maintained the fluctuation range of 3345-3360 that I predicted. Gold bulls are now strong. If there is no major change in the news over the weekend, the price will likely continue to rise after a slight decline at the beginning of next week. I think we can still follow the strategy of Dutou.
The 1-hour moving average of gold continues to diverge with a golden cross and upward bullish arrangement, and the bullish momentum of gold is still there. The current strong support level of gold has also moved up to around 3330. After gold broke through 3330 over the weekend, the price fell back to 3330 and stabilized and rose twice. In the short term, this position has formed a strong support.
There is a high probability that the price will have a small correction at the beginning of next week. We can continue the bullish strategy after the price falls back.
Market transactions should abandon personal preferences. Preconceived subjective consciousness will eventually be taught a lesson by the market. The market is always right. We should follow the fluctuations of the market. Instead of having a head full of random thoughts. There are always traces of market changes, and you need to have the ability to discover them or follow those who have the ability. The market changes rapidly, so pay attention to more timely changes.

The price fell back. Watch out for a breakthrough.After reaching the resistance position near 3345 predicted by Quaid, the price fell back slightly, and the price fluctuated around 3335 so far.
From the hourly chart, before the price stabilizes at 3345, it is likely to maintain a range of 3330-3345. 3330-3345 is a temporary range. If it stands firm and breaks above 3345 again, the fluctuation range will become 3345-3360.
On the contrary, if it falls below 3330, the range may drop to 3320-3330. However, as long as the downward trend does not fall below 3320, gold will still maintain a bullish trend. If the price breaks down below 3320, today’s trend will be reversed.
As long as it is above 3320, gold will maintain a bullish trend today.
On the last trading day of this week, I wish all traders a good harvest.

XAUUSD H4 | Premium Supply RejectionPrice has tapped into a premium selling zone around 3,340 - 3,350 and is showing signs of rejection.
📍 Key Levels:
• Premium Supply Zone: 3,340 – 3,350
• Current Price: 3,332
• Target Zone: 3,275 – 3,265
• Intermediate Support Zones: Around 3,320 & 3,300
🔴 Liquidity was swept above the previous high, and price has reacted strongly from this level.
🔻 Bearish Bias:
• Expecting a move down towards target support.
• Clean break of structure confirms bearish intent.
• Multiple FVGs and imbalance zones below price support the downside continuation.
📌 Trade Idea:
Sell from premium zone with confirmation
🎯 Target: 3,275 zone
📉 SL suggestion: Above 3,355 (structure invalidation)

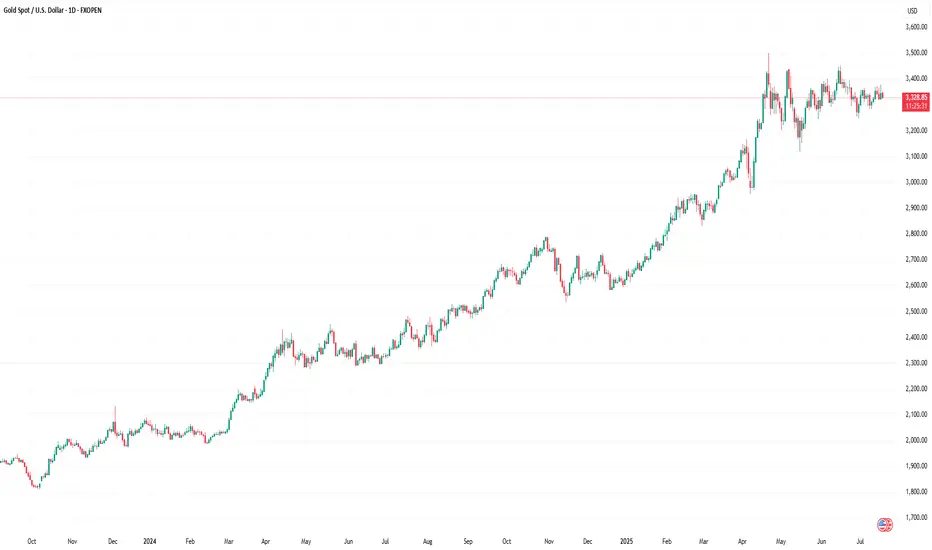
Gold is fluctuating. Can it break through?Since the price of gold rose to 3500 on April 22 and encountered resistance and fell back, it has shown a triangular convergence and fluctuation trend so far. From the short-term trend, after the decline adjustment on Tuesday, it bottomed out and rebounded on Wednesday to close with a positive line, and on Thursday it completed the shock consolidation with a small positive line. The current moving average system is in an intertwined state, and the short-term market tends to fluctuate.
Today, we need to pay attention to the resistance of the 3340-3345 range. This position is a high point concentration area that has suppressed the upward movement of gold prices many times in the early stage. If the gold price breaks through this range, the bullish trend is expected to continue.
From the current trend, after the gold price bottomed out and rebounded, it formed a short-term support at 3310. Secondly, we need to pay attention to the support strength near the low point of 3282 on Tuesday. In terms of operation, it is still necessary to operate around the range.
Operation strategy:
Short when the price rebounds to around 3345, stop loss at 3355, profit range 3320-3300
Long when the price falls back to around 3310, stop loss at 3300, profit range 3320-3340

Trump blasted Powell again. Interest rates remain unchanged.Information summary:
Trump blasted Powell on Wednesday, saying that the current interest rate is "at least 3 percentage points higher" and once again accused Fed Chairman Powell of "making the United States pay an extra $360 billion in refinancing costs each year." He also said that "there is no inflation" and that companies "are pouring into the United States," and urged the Fed to "cut interest rates."
During the U.S. trading session, gold also showed a significant rebound momentum, rebounding from a low of 3285 to above 3310 in one fell swoop. As of now, gold has stood above 3320.
Market analysis:
From the daily chart:
It can be seen that the first suppression position above gold is currently at 3325, followed by around 3345. Gold did not close above 3320 on Wednesday, which means that even if gold is currently above 3320, as long as today's daily line closes below 3320, it is still in a bearish trend. On the contrary, if the closing price today is above 3320, then the subsequent test of the suppression position near 3345 may be further carried out.
Secondly, from the 4-hour chart, the current suppression position above 4 hours is around 3330-3335. Therefore, today we should focus on this position. If we cannot stand firm and break through the range suppression here in the 4-hour chart, we may retreat again in the future. The key support position below is around 3310, which is the opening price today. If the price is to retreat, it is likely to fall below 3310. But it may also remain above 3310 for consolidation.
However, as long as it falls below 3310, I think the low point near 3285 may be refreshed, so pay attention to this.
Operation strategy:
Steady trading waits for 3310 to fall and break through to short, and the profit range is 3385 or even lower.
Aggressive trading can short near 3340, with a stop loss of 3350.
