GOLD Melted , 2 Best Places To Sell Clear , Don`t Miss 200 Pips Here is My 30 Mins Gold Chart , and here is my opinion , we Again Below 3377.00 and we have a 30 Mins Candle closure below this strong res , so i`m waiting the price to go back and retest this res and new support and give me a good bearish price action to can enter a sell trade and we can targeting 200 pips , and we have a good res @ 3365.00 we can sell from it also if the price didn`t reach 3377.00 and targeting from 100:200 pips , and if we have a Daily Closure below This res this will increase the reasons for us , just wait the price to back a little to retest it and then we can sell it . if we have a daily closure aboveit this idea will not be valid anymore .
Xauusdupdate

Gold UpdateGold (XAUUSD) is currently trading between PD High and PD Low, showing signs of consolidation after a recent downtrend.
Price reacted from the demand zone near PD Low and is now testing a minor resistance zone.
Key levels to watch: 3375–3385 resistance and 3355–3360 support.
Break above 3385 could open the path toward 3395–3400.
Failure to hold 3355 may trigger further downside toward 3340.
Waiting for clean structure and candlestick confirmation for directional bias.

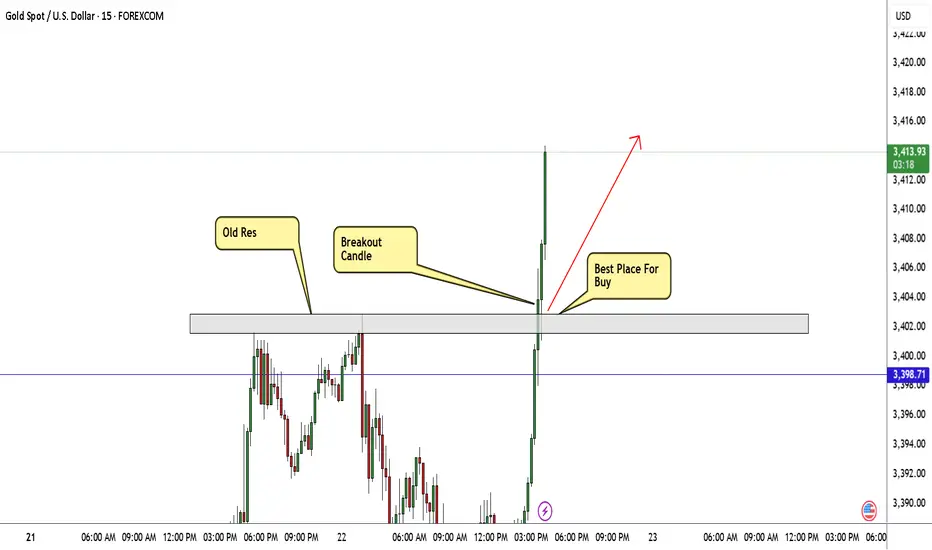
GOLD Still Bullish , Are You Ready For New Wave ? 200 Pips ValidHere is My 15Mins Gold Chart , and here is my opinion , we finally above 3400.00 and we have a 30 Mins Candle closure above this strong res , so i`m waiting the price to go back and retest this res and new support and give me a good bullish price action to can enter a buy trade and we can targeting 200 pips , and if we have a 4H Closure Above This res this will increase the reasons for buyers , just wait the price to back a little to retest it and then we can buy it . if we have a daily closure below it this idea will not be valid anymore .
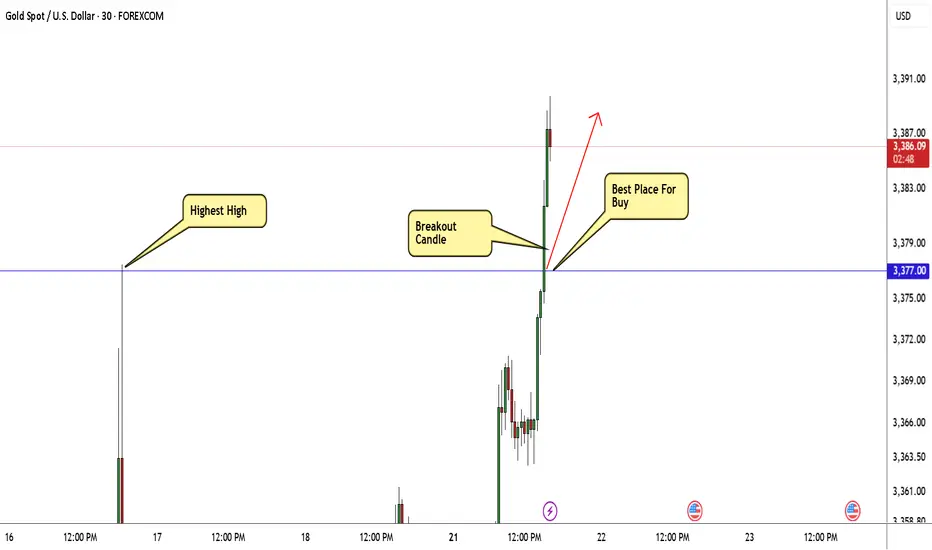
GOLD Breakout Done , Long Setup Valid To Get 200 Pips !Here is My 30 Mins Gold Chart , and here is my opinion , we finally above 3377.00 and we have a 30 Mins Candle closure above this strong res , so i`m waiting the price to go back and retest this res and new support and give me a good bullish price action to can enter a buy trade and we can targeting 200 pips , and if we have a 4H Closure Above This res this will increase the reasons for buyers , just wait the price to back a little to retest it and then we can buy it . if we have a daily closure below it this idea will not be valid anymore .
GOLD Made Triple Top Pattern , Short Setup Very Clear !Here is my opinion on 15 Mins T.F On Gold , we have a triple Top Reversal Pattern , on 15 mins and 30 mins T.F , And we have a clear closure below neckline , so i think we can sell this pair for 100 pips at least to get this pattern target , we can sell from the current price or from m y best area for sell .

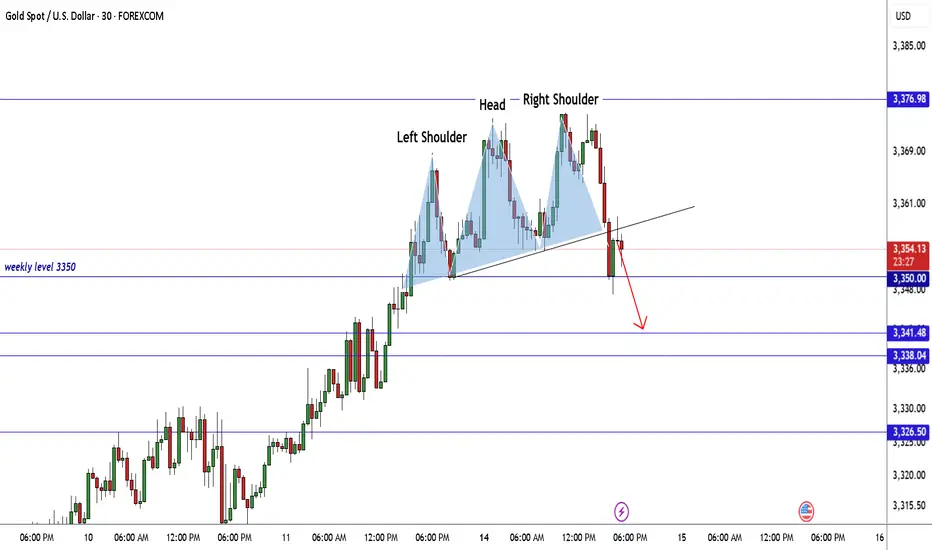
GOLD Made H&S Reversal Pattern , Scalping Short Setup Valid !Here is my GOLD 30 Mins Chart and if we checked the chart we will see that the price created a very good reversal pattern on 30 mins T.F , Head & shoulders reversal pattern and also it`s already confirmed by closure below neckline so the short is very clear now and we can targeting 100 to 150 pips , 3350.00 is a very good support also so we can see a price bounce from it to upside .
GOLD Breakout Done Let`s Buy It To Get Clear 200 Pips !Here is my opinion on 30 mins T.F , We have a very good bullish price action and we have a very good breakout with amazing bullish candle and now the price back to retest the breakout area , it`s my fav place to enter a buy trade and the price can move 200 Pips easy , i`m waiting for retest and good bullish price action to enter a buy trade .

Gold Breakout Done New Short Entry Valid To Get 200 Pips !Here is my opinion on gold at he moment , in 15 mins T.F wr have a fake breakout but 3343.00 forced the price to go down which is a great res for this pair and we have avery good bearish price action and good closure below my res level 3341.00 so it`s my num 1 place to enter a sell trade if the price go back to retest it , and if not , 3383.00 will be my best place to sell it .

GOLD Made H&S Reversal Pattern , Chance To Sell To Get 200 PipsHere is My 15 Mins Chart On Gold and we have a very good reversal Pattern , Head & Shoulders , we have a 15 mins closure below neckline 3322.00 we can enter a sell trade and targeting at least 100 pips as scalping , we can enter after waiting the price to retest neckline and then enter . and the price can reach 3300.00 to 3296.00 again .

GOLD Made Double Top Reversal Pattern , Ready For Sell ?Here is My 15 Mins Chart On Gold and we have a very good reversal Pattern , double Top , if we have a 15 mins closure below neckline 3326.00 we can enter a sell trade and targeting at least 100 pips as scalping , we can enter direct if you are aggressive trader or if you not you can wait the price to retest neckline and then enter .

GOLD 2 Best Places For Sell Very Clear , Don`t Miss 300 Pips !Here is my opinion on Gold at the moment after the price moved very hard to downside as i mentioned in the last update , now we have a very good 2 places to sell it again , the first one @ 3326.00 , it`s a very good place to sell it cuz it was a very good support and the price break it and now it will play as a good res so we can sell from it , and if the price go higher we can sell from area between 3350 : 3345.00 , it will be a great place to sell it also , and if the highest place who force the price to downside we can add another sell entry from 3326.00 if we have a daily closure below it .

Gold Take All Stop losses,Are You Ready To Sell To Get 300 Pips?Here is my 1H Gold Chart and this is my opinion , the price opened this week with massive wick to upside to take all stop losses and then moved to downside very hard and aggressive , we have a very good Res that we sell from it last week 3377.00 , it`s still strong and forced the price many times to respect it so it still my fav level to sell it again today if the price touch it and give me a good bearish price action to confirm the entry and we can targeting 300 pips at least . if we have a daily closure above my res then we will think about buying instead of selling , but until now i`m looking to sell it from the level i mentioned .

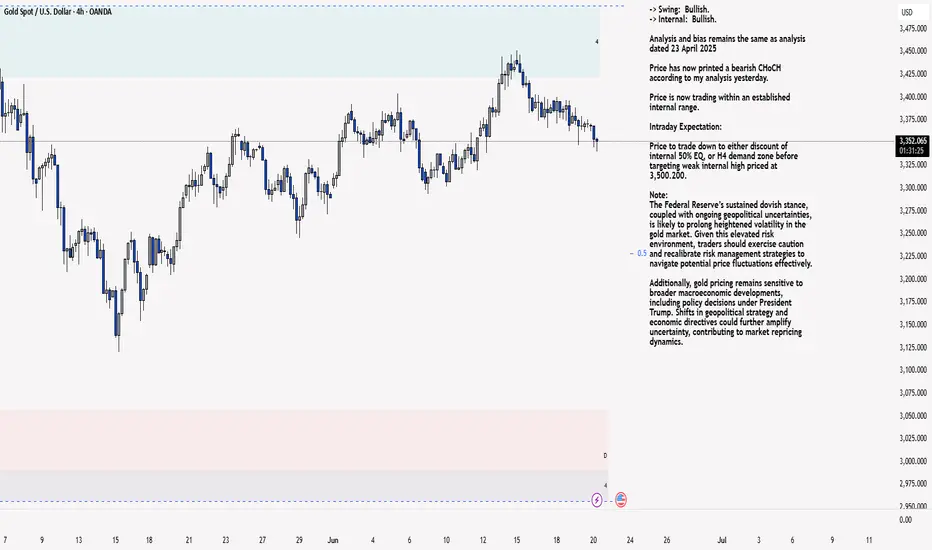
XAU/USD 20 June 2025 Intraday AnalysisH4 Analysis:
-> Swing: Bullish.
-> Internal: Bullish.
Analysis and bias remains the same as analysis dated 23 April 2025
Price has now printed a bearish CHoCH according to my analysis yesterday.
Price is now trading within an established internal range.
Intraday Expectation:
Price to trade down to either discount of internal 50% EQ, or H4 demand zone before targeting weak internal high priced at 3,500.200.
Note:
The Federal Reserve’s sustained dovish stance, coupled with ongoing geopolitical uncertainties, is likely to prolong heightened volatility in the gold market. Given this elevated risk environment, traders should exercise caution and recalibrate risk management strategies to navigate potential price fluctuations effectively.
Additionally, gold pricing remains sensitive to broader macroeconomic developments, including policy decisions under President Trump. Shifts in geopolitical strategy and economic directives could further amplify uncertainty, contributing to market repricing dynamics.
H4 Chart:
M15 Analysis:
-> Swing: Bullish.
-> Internal: Bullish.
Following previous high, and printing of bearish CHoCH, price has pulled back to an M15 supply zone, where we are currently seeing a reaction. Therefore, I shall now confirm internal high.
Price is now trading within an established internal range.
The remainder of my analysis shall remain the same as analysis dated 13 June 2025, apart from target price.
As per my analysis dated 22 May 2025 whereby I mentioned price can be seen to be reacting at discount of 50% EQ on H4 timeframe, therefore, it is a viable alternative that price could potentially print a bullish iBOS on M15 timeframe despite internal structure being bearish.
Price has printed a bullish iBOS followed by a bearish CHoCH, which indicates, but does not confirm, bearish pullback phase initiation. I will however continue to monitor, with respect to depth of pullback.
Intraday Expectation:
Price to continue bearish, react at either M15 supply zone, or discount of 50% internal EQ before targeting weak internal high priced at 3,451.375.
Note:
Gold remains highly volatile amid the Federal Reserve's continued dovish stance, persistent and escalating geopolitical uncertainties. Traders should implement robust risk management strategies and remain vigilant, as price swings may become more pronounced in this elevated volatility environment.
Additionally, President Trump’s recent tariff announcements are expected to further amplify market turbulence, potentially triggering sharp price fluctuations and whipsaws.
M15 Chart:
GOLD Made Inverted H&S Pattern , Long Scalping Ready !Here is my 15 mins chart on gold and we have a reversal pattern , ( inverted head & shoulders ) and we have a clear closure above our neckline so we can buy it to get the target and then wait for the news tonight and then decide the new direction after news effect .

Accurate operation, both long and short gains!Gold has experienced a typical volatile market today, first rising to 3400 and then falling back to around 3380 as expected. The short order plan we arranged in advance was successfully closed, and we successfully took this wave of callback profits. What is more worth mentioning is that we also accurately entered the long order in the previous round of retracement and steadily harvested the rebound profits. The rhythm of long and short switching is smooth, the strategy is clear, and the execution is decisive - this is what trading should be like. The market is repetitive, and opportunities are always there. Whether you can put the profit steadily into your pocket depends not on how many times you are right, but on whether you can execute it at the key points.
At present, the trend of gold shows that although there is a rebound after each decline, the strength is generally weak and it has never been able to break through the 3405 suppression level. The overall situation is still in a range of fluctuations, and market sentiment is still waiting for further guidance from the Fed. Therefore, short-term operations are still based on key points, and the market rhythm is slow, requiring more patience. In the case of no break at present, continue today's thinking to operate, unless there are sharp fluctuations in the short term or sudden news or geopolitical situations, then make adjustments.
Gold operation suggestions: 1. Gold short orders: short near 3397-3405, target 3385-3375. 2. Gold long orders: long near 3375-3370, 3365-3360 can cover positions, target 3380-3390-3400.
If you still lack direction in gold trading, you might as well try to follow my pace. The strategy is open and transparent, and the execution logic is clear and definite, which may bring new breakthroughs to your trading. The real value does not rely on verbal promises, but is verified by the market and time.

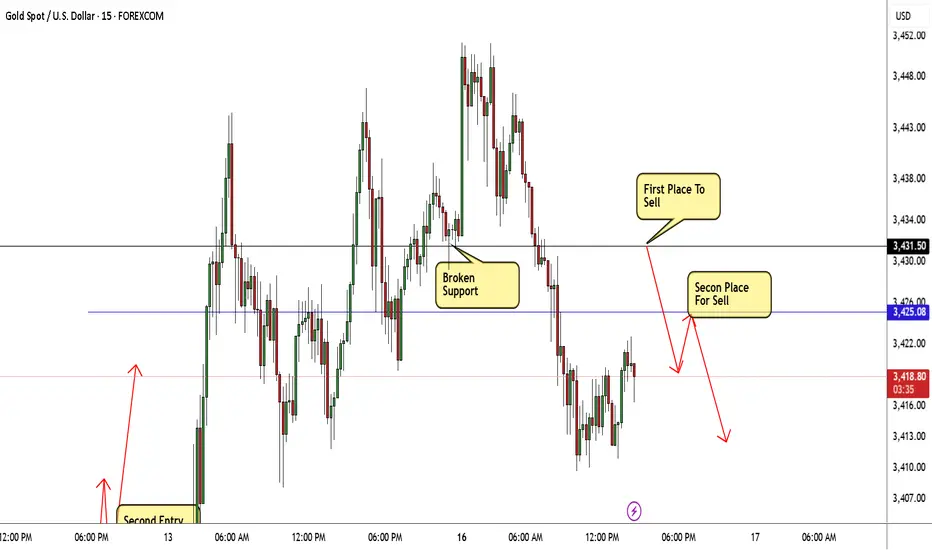
GOLD Best 2 Places For Sell Very Clear To Get 500 Pips !Here is my 15Mins T.F Chart On Gold and here is my fav 2 places to sell this pair , if we take a look on the chart we will see that we have avery good support @ 3431.50 and the price broke it and close below it and now i`m waiting for retest to this broken support and new res , and if i have a good bearish price action i will enter a sell trade and targeting the first support @ 3425.00 and if i have a good closure below it at least with 30 Mins Candle then i can add another contract and targeting the second support , if we have a closure above 3431.50 this idea will not be valid .
GOLD , Making New H.H , 2 Scalping Long Entries, Don`t Miss It Here is my 2 scalping long entries on Gold , if the price close above the highest res , we can wait the price to go back to retest it and then we can enter a new buy scalping trade to create the new H.H . Very Easy And Simple Analysis . Make It Easy Always To Can Continue .

The gold trend is perfectly in line with expectations.The recent trend of gold is consistent with my expectations. Overall, the rebound is mainly based on fluctuating downward, and the rhythm of the oscillation between long and short positions is perfectly grasped. The upper resistance is still strong, and gold can still be shorted if the rebound is not broken.
From the current analysis of the gold trend, the lower support focuses on the area around 3315-3305. If it falls back to this position range, continue to look at the continuation of the rebound upward; the upper resistance focuses on the area around 3350-3362. The overall rhythm of the high-altitude and low-multiple range is still maintained, and the strategy is mainly to participate in the range back and forth.
1. Go long when gold falls back to 3315-3305, and the target is 3330-3340;
2. Go short when gold rebounds to 3350-3360, and the target is 3340-3330.

Gold fluctuates repeatedly, and opportunities emerge!Gold was under pressure for the second time during the day, and the pressure at the 3349 line fell back. It continued to be treated with a fluctuating mindset. The 4H cycle observation showed that the Bollinger Bands were closing, and the K-line repeatedly interspersed around the middle track. The short-term structure tended to fluctuate upward. Pay attention to the 3348-3350 and 3362 pressure zones above, and the support below is located in the 3315 and 3302 areas. In terms of operation, the main long and auxiliary short ideas are maintained, and the guidance of CPI data is paid special attention.
Operational suggestions: Gold retreats to the 3315-3305 area and tries to arrange long orders, with the target looking at 3338 and 3349. A strong breakthrough can look up to 3360. If the 3350-3360 pressure zone above is not broken, short orders can be tried in the short term.
All recent trading strategies and ideas have been realized, and the point predictions are accurate. If your current gold operation is not ideal, we hope to help you avoid detours in your investment. Welcome to communicate with us!

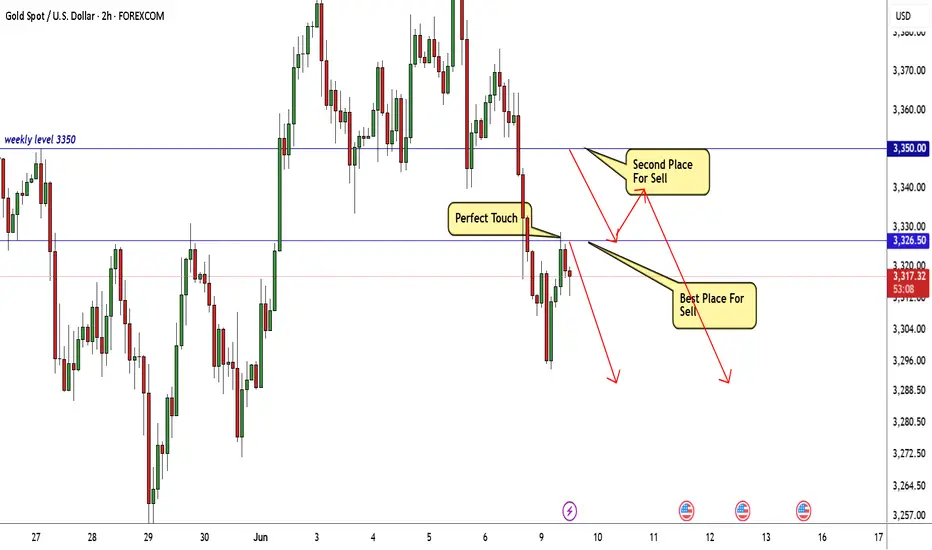
GOLD Best 2 Places For Sell Very Clear , Ready For 500 Pips ?Here is my opinion on gold on 2H T.F , we have a very good bearish price action and we have a very good retest for broken support and new res , so i think 3326.00 will be a very good place to sell and targeting 250 pips at least , also if the price go up a little 3350.00 will be the last place we can sell from it and targeting 500 pips .
Gold drops to support then rebounds; 3325-3330 key bull-bear levAnalysis of Today's Gold Volatility 🔥
The ruling on Trump's tariff overreach and the Fed's cautious stance on rate cuts have delivered a double blow 💥, instantly "freezing" market risk aversion 🧊! Gold prices plunged to a low of 3245 intraday, with the 3245-3250 zone acting as a "safety air cushion" 🛡️ that firmly halted the decline. The price is now rebounding to test resistance near yesterday's high, where the 3325-3330 level has become a "life-or-death line" ⚔️ for bulls and bears, with a showdown imminent!
Trading Strategies (Emoji Signal Guide 📌)
1. Short on Rebound 🚀➡️📉
Entry: Lightly short in the 3325-3330 range (Bearish "sniper zone" 🎯)
Stop Loss: 3335 (Break above resistance? Run 🏃♂️!)
Targets:
First target: 3280 (Bearish "first charging station" 🔋)
Second target: 3250 (Test support validity 🔍)
2. Long at Support 📉➡️📈
Entry: Lightly long after stabilizing above 3250 (Bullish "rally call" 📢)
Stop Loss: 3240 (Break below support? Retreat fast 🚑!)
Targets:
First target: 3280 (Rebound "mini-peak" ⛰️)
Second target: 3300 (Challenge "mid-fortress" 🏰)
Risk Warning ⚠️: Beware of volatile swings from Fed speeches! Exit immediately if prices break above 3330 or below 3240. Control positions and avoid emotional trading 🚗💨!
Professional trading strategies are pushed daily 📊
Lock in precise signals amid market fluctuations 🚀
Confused about market trends? Stuck in strategy bottlenecks?
Real-time strategies serve as your "trading compass" 🌐
From trend analysis to entry/exit points, dissect market logic comprehensively
Refer now 📲
Help you move steadily forward in investments ✨
👇👇👇

XAU/USD (GOLD) TRADE PLAN 6/5/2025XAU/USD (Gold) Trading Outlook
The current price of XAU/USD around 3380 to 3375. We are anticipating a pullback towards the 3300 level, at which point we will look for long (buy) entry opportunities.
Key Resistance/Target Level:
TARGET 1: 3400
TARGET 2: 3450
TARGET 3: 3480
Key Support Levels:
SUPPORT 1: 3200
SUPPORT 2: 3150
This Strategy is based on the expectation of a price retracement, providing a more favorable risk-reward setup for long positions.

The gold strategy is correct, enter the market at key points.Gold clearly treated the wide range of fluctuations, and the strategy was basically realized! In the real market, I also arranged short orders at 3345 and 35, and took profit at 3313-14! I continued to arrange long orders at 3302, and finally successfully reached the profit target of 3315! The overall harvest was good.
Analysis of gold trend:
On Tuesday (April 29) in the Asian market, spot gold fluctuated in a narrow range and is currently trading at $3337.58/ounce. Gold prices reversed their decline on Monday and rose. Earlier, they fell to around $3268, but then there was a low-absorption buying, and gold prices closed at $3343.91/ounce; the dollar fell across the board on Monday, which also provided support for gold prices. Investors cautiously waited for further news on US trade policies and prepared for a week of intensive economic data, which may initially indicate whether US President Trump's trade war is having an impact.
From a technical perspective, gold prices reversed their decline on Monday and rose. Gold repeatedly tested the 3260-3270 area for support. Gold has formed a multiple bottom structure in the short term, so gold may end its short-term adjustment. This time, gold has already adjusted, and it is unlikely to adjust again. Therefore, as long as it does not break the 3260 low in the near future, gold will rise and there will be room for growth. As for the high point, there are two dividing points, one is the 3337 high point, breaking 3337 is a strong shock, and the other is the 3370 high point, breaking 3370 is absolutely strong, then, the upper space is opened, and then look at 3420-3500.
From the daily chart, the daily line forms three bottoms at 3260, and the daily line closes positively, and the bullish trend is obvious. As long as the daily line is positive, it will not be able to go to the upper track or the previous high is just around the corner. The 4-hour cycle is also absolutely strong after Monday's rise, but now the unilateral rising mode of the Bollinger opening has not yet formed, and the gains and losses of 3370 will be tested here. Therefore, if the bullish long position continues on Tuesday, it must pay attention to whether 3370 breaks. If 3370 breaks, there will be a strong unilateral rising space. If 3370 does not break, it will still be a large range of fluctuations. Then, the only thing to consider during the day is to adjust the long position. Today, the lower support is around 3300-3310, and the upper pressure is around 3350-3360.
